uni-app 使用Echarts展示折线图(axisLabel展示不全)以及uCharts展示圆环图 (附代码)(仅支持H5 和APP)
项目过程中发现Echarts 使用时 日期展示有很大问题如图所示左右提示文字以及下方日期均展示不全(使用的逍遥模拟器)。原因是因为xAxis、yAxis 对象中的axisLabel对象使用了 formatter: ()=> {} 方法导致出现上述图片问题,根据查找资料以及实际观察ECharts 实例对象,确实发现,当ECharts更新后,对象中所有的formatter: ()=> {} 方法均被移
项目过程中发现Echarts 使用时 日期展示有很大问题

如图所示 左右提示文字以及下方日期均展示不全(使用的逍遥模拟器)。原因是因为xAxis、yAxis 对象中的axisLabel对象使用了 formatter: ()=> {} 方法导致出现上述图片问题,根据查找资料以及实际观察ECharts 实例对象,确实发现,当ECharts更新后,对象中所有的formatter: ()=> {} 方法均被移除。(后面会讲到解决办法,亲测有效)
这里先说明下如果uni-app要使用ECharts 是不能直接在JS中直接引用的,需要借助renderjs进行使用,当然项目中非vue文件还是可以直接在JS中使用的
在vue文件中使用ECharts(引入,并简单使用)
先拿官网上的示例代码做个说明
官网链接:https://ext.dcloud.net.cn/plugin?id=1207

如图所示,当前Echarts 引入后直接展示为以上效果
代码结构为

上图所述为项目路径,其中static文件最为重要(不要乱动或改名,会引起引入错误)
我们接着来看下index中是如何使用echarts的
<template>
	<view class="content">
		<!-- #ifdef APP-PLUS || H5 -->


        <!-- option 为绑定数据源,只要option更新则会自动触发updateEcharts 函数 -->


		<view @click="echarts.onClick" :prop="option" :change:prop="echarts.updateEcharts" id="echarts" class="echarts"></view>
		<button @click="changeOption">更新数据</button>
		<!-- #endif -->
		<!-- #ifndef APP-PLUS || H5 -->
		<view>非 APP、H5 环境不支持</view>
		<!-- #endif -->
	</view>
</template>

<script>
	export default {
		data() {
			return {
				option: {
					title: {
						text: 'ECharts 入门示例'
					},
					tooltip: {},
					legend: {
						data: ['销量']
					},
					xAxis: {
						data: ["衬衫", "羊毛衫", "雪纺衫", "裤子", "高跟鞋", "袜子"]
					},
					yAxis: {},
					series: [{
						name: '销量',
						type: 'bar',
						data: [5, 20, 36, 10, 10, 20]
					}]
				}
			}
		},
		onLoad() {

		},
		methods: {
			changeOption() {
				const data = this.option.series[0].data
				// 随机更新示例数据
				data.forEach((item, index) => {
					data.splice(index, 1, Math.random() * 40)
				})
			},
			onViewClick(options) {
				console.log(options)
			}
		}
	}
</script>

<script module="echarts" lang="renderjs">
	let myChart
	export default {
		mounted() {
			if (typeof window.echarts === 'function') {
				this.initEcharts()
			} else {
				// 动态引入较大类库避免影响页面展示
				const script = document.createElement('script')
				// view 层的页面运行在 www 根目录,其相对路径相对于 www 计算
				script.src = 'static/echarts.js' // 展示核心文件路径,不要乱动
				script.onload = this.initEcharts.bind(this)
				document.head.appendChild(script)
			}
		},
		methods: {
			initEcharts() {
				myChart = echarts.init(document.getElementById('echarts'))
				// 观测更新的数据在 view 层可以直接访问到
				myChart.setOption(this.option)
			},
			updateEcharts(newValue, oldValue, ownerInstance, instance) {
				// 监听 service 层数据变更
				myChart.setOption(newValue)
			},
			onClick(event, ownerInstance) {
				// 调用 service 层的方法
				ownerInstance.callMethod('onViewClick', {
					test: 'test'
				})
			}
		}
	}
</script>

<style>
	.content {
		display: flex;
		flex-direction: column;
		align-items: center;
		justify-content: center;
	}

	.echarts {
		margin-top: 100px;
		width: 100%;
		height: 300px;
	}
</style>
其中 <script module="echarts" lang="renderjs"> 以及上面 定义的
<view @click="echarts.onClick" :prop="option" :change:prop="echarts.updateEcharts" id="echarts" class="echarts"></view>
使其显示,随后我们就可以随心所欲的在项目中使用Echarts进行绘图了
说回正题,formatter: ()=> {} 方法不生效解决办法可在 updateEcharts() 方法中重新给对象赋值。
updateEcharts(newValue, oldValue, ownerInstance, instance) {
				// 监听 service 层数据变更
				newValue.xAxis.axisLabel.formatter = function formatter(value) {
				  return dateformat.format(new Date(value)).replace(" ", "\n");
				}

				try{
                     // newValue 是当前最新的Echarts 对象  对axisLabel 对象重新挂载formatter 函数
					newValue.yAxis[0].axisLabel.formatter = function formatter (value) {
						 return parseFloat(value.toFixed(newValue.yAxis[0].fixedLeftNum));
					}
					newValue.yAxis[1].axisLabel.formatter = function formatter (value) {
						 return parseFloat(value.toFixed(newValue.yAxis[1].fixedNum));
					}
				}catch(e){}
				setTimeout(() => {
					myChart.setOption(newValue, true)
				}, 500);
			},
重新挂载formatter对象后完美解决axisLabel展示问题(如图)

因当前数据量很大,所以感觉有些拥挤,可使用dataZoom属性进行调整
上图完整代码以及数据可查看https://download.csdn.net/download/weixin_46021159/86406324?spm=1001.2014.3001.5503
uCharts的使用
相比较于Echarts的使用 ucharts就简单很多了,下载一个ucharts的js文件,在进行引入即可
下载地址https://gitee.com/uCharts/uCharts/tree/master
下载完成后在JS 文件中引用, html中定义对应标签即可
// .vue 文件
<view class="charts">
  <canvas canvas-id="canvasArcbar1" id="canvasArcbar1" class="charts" bindtouchend="tap"/>
</view>
// .js 文件
import uCharts from '../../js_sdk/u-charts.js';
data() {
    return: {
        	cWidth: null, //圆环展示宽度
			cHeight: null, //圆环展示高度
			pixelRatio: 1, // 像素化,
            arcbarWidth: null // 圆弧宽度
    }
},
onLoad() {
		this.cWidth = uni.upx2px(144); // 将rpx单位值转换成px
		this.cHeight = uni.upx2px(144); // 将rpx单位值转换成px
		this.arcbarWidth = uni.upx2px(16); // 将rpx单位值转换成px
},
// 取得数据后定义战术数据
getServerData(series1) {
			let Arcbar1 = {
				series: []
			};
			Arcbar1.series = [{
				title: this.convertNum(series1[0]),
				color: series1[0] != '0' ? "#17B770":'#e8e8e8',
				data: series1[1] != '0' ? String(Number(series1[0] / series1[1]).toFixed(2)) : '0.00',
				index: 0,
				legendShape: "circle",
				name: `/${series1[1]}`,
				pointShape: "circle",
				show: true,
				type: "arcbar"
			}];

			this.showArcbar("canvasArcbar1", Arcbar1, 1.5, series1);

		},
		// 环形图配置
		showArcbar(canvasId, chartData, startrotate, data) {
			let titX = 0,titY = 0,subX = 0, subY = 0; // 设置文字偏移量 用于展示
			if(data[0]>99||data[1]>99){
				titX = 0;
				titY = 0;
				subX = 0;
				subY = 0;
			}else if(data[0]>99){
				titX = -12;
				titY = 5;
				subX = 15;
				subY = -10;
			}else if(data[0]>9){
				titX = -10;
				titY = 5;
				subX = 10;
				subY = -10;
			}else{
				titX = -5;
				titY = 5;
				subX = 10;
				subY = -10;
			}
			let canvaArcbar1 = new uCharts({
					$this: this,
					canvasId: canvasId,
					type: 'arcbar',
					fontSize: 8,
					legend: {
						show: false
					},
					// loadingType: 0,
					background: '#e8e8e8',
					pixelRatio: this.pixelRatio,
					series: chartData.series,
					animation: true,
					width: this.cWidth * this.pixelRatio,
					height: this.cHeight * this.pixelRatio,
					dataLabel: true,
					title: {
						name: chartData.series[0].title,
						color: "#17B770",
						fontSize: 14 * this.pixelRatio,
						offsetX: titX * this.pixelRatio,
						offsetY: titY * this.pixelRatio,
					},
					subtitle: {
						name: chartData.series[0].name,
						color: '#929292',
						fontSize: 8 * this.pixelRatio,
						offsetX: subX * this.pixelRatio,
						offsetY: subY * this.pixelRatio,
					},
					extra: {
						arcbar: {
							gap: 2,
							direction: "ccw",
							backgroundColor: '#e8e8e8',
							type: 'circle', //整圆类型进度条图
							width: this.arcbarWidth * this.pixelRatio, //圆弧的宽度
							startAngle: startrotate, //整圆类型只需配置起始角度即可
							endAngle: 0.25,
						}
					}
				});
			if (this.timer !== null) {
			      clearTimeout(this.timer);
				  this.timer = null
			}
		},
		// 数值转换
		convertNum(num) {
			if (num >= 10000) {
				if (num > 10000) {
					return Math.floor(num / 10000) + 'W+';
				} else {
					return Math.floor(num / 10000) + 'W';
				}

			} else {
				return num + '';
			}
		},
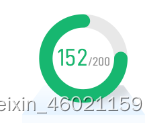
上述代码完成效果图

更多推荐
 已为社区贡献4条内容


所有评论(0)