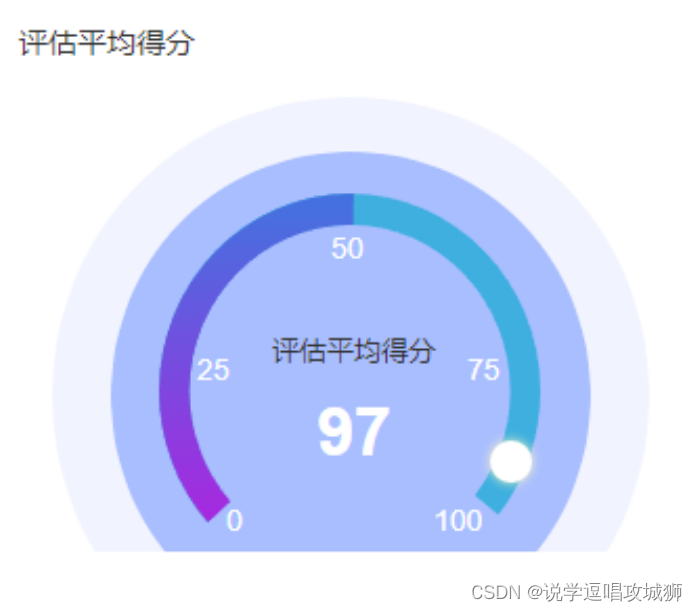
vue3画echarts仪表盘图
【代码】vue3画echarts仪表盘图。
·

<template>
	<div ref="evaluationScore" style="width: 100%; height: 220px"></div>
</template>
<script setup>
	import * as echarts from "echarts";
	import {ref, onMounted, reactive} from "vue";

	const evaluationScore = ref()
	onMounted(() => {
	    initScore()
	});

// 评估平均得分
const initScore = () => {
  var myChart = echarts.init(evaluationScore.value);
  var option;

  option = {
    series: [
      {
        type: "gauge",
        radius: "120%", // 位置
        center: ["50%", "70%"],
        min: 0,
        max: 100,
        startAngle: 360,
        endAngle: 0,
        axisLine: {
          show: true,
          lineStyle: {
            // 轴线样式
            width: 120, // 宽度
            opacity: 0.2,
            color: [[1, "#B7C9FF"]], // 颜色
          },
        },
        axisTick: {
          // 刻度
          show: false,
        },
        pointer: {
          // 仪表盘指针
          show: false,
        },
        splitLine: {
          // 分割线
          show: false,
        },
        axisLabel: {
          // 刻度标签
          show: false,
        },
        pointer: {
          // 仪表盘指针
          show: false,
        },
        detail: {
          // 仪表盘详情
          show: false,
        },
      },
      {
        type: "gauge",
        radius: "100%", // 位置
        center: ["50%", "70%"],
        min: 0,
        max: 100,
        startAngle: 360,
        endAngle: 0,
        axisLine: {
          show: true,
          lineStyle: {
            // 轴线样式
            width: 120, // 宽度
            opacity: 0.8,
            color: [[1, "#B7C9FF"]], // 颜色
          },
        },
        axisTick: {
          // 刻度
          show: false,
        },
        splitLine: {
          // 分割线
          show: false,
        },
        axisLabel: {
          // 刻度标签
          show: false,
        },
        pointer: {
          // 仪表盘指针
          show: false,
        },
        detail: {
          // 仪表盘详情
          show: false,
        },
      },
      {
        type: "gauge",
        center: ["50%", "70%"],
        radius: "80%",
        min: 0,
        max: 100,
        splitNumber: 4,
        axisLine: {
          lineStyle: {
            width: 15,
            color: [
              [
                0.5,
                new echarts.graphic.RadialGradient(0.5, 1, 1, [
                  {
                    offset: 0.5,
                    color: " #A400FF",
                  },
                  {
                    offset: 1,
                    color: "#4770DF",
                  },
                ]),
              ],
              [1, "#3EAFDF"],
            ],
          },
        },
        axisLabel: {
          color: "#fff",
        },
        pointer: {
          icon: "circle",
          width: 18,
          offsetCenter: [0, "-62%"],
          itemStyle: {
            color: "#fff",
          },
        },
        axisTick: {
          distance: -25,
          length: 8,
          lineStyle: {
            color: "transparent",
            width: 2,
          },
        },
        splitLine: {
          distance: -25,
          length: 30,
          lineStyle: {
            color: "transparent",
            width: 5,
          },
        },
        detail: {
          valueAnimation: true,
          formatter: "{name|评估平均得分}\n{score|{value}}",
          color: "#fff",
          offsetCenter: [0, "5%"],
          rich: {
            name: {
              fontSize: 14,
              color: "#333",
            },
            score: {
              padding: [-15, 0, 0, 0],
              fontSize: 22,
              fontWeight: "bold",
              color: "#fff",
            },
          },
        },
        data: [
          {
            value: 85,
          },
        ],
      },
    ],
  };
  option && myChart.setOption(option);
};
</script>
更多推荐
 已为社区贡献3条内容


所有评论(0)