ubuntu 14 nagios监控mysql_Nagios监控Mysql
监控MySQL有两种方法:一种是通过官方的check_mysql插件,另一种是通过第三方的check_mysql_health的插件。check_mysql_health的功能更为强大一些,不但能监控MySQL是否正常运行,还能监控MySQL主从、MySQL连接数情况、MySQL慢查询等多种监控指标。被监控端(Mysql服务器10.15.44.136)通过check_mysql、check_mys
监控MySQL有两种方法:一种是通过官方的check_mysql插件,另一种是通过第三方的check_mysql_health的插件。check_mysql_health的功能更为强大一些,不但能监控MySQL是否正常运行,还能监控MySQL主从、MySQL连接数情况、MySQL慢查询等多种监控指标。
被监控端(Mysql服务器10.15.44.136)
通过check_mysql、check_mysql_health监控mysql,都需要在被监控的远程服务器上(mysql服务器上)要先创建一个可以远程登陆mysql服务器的账号。[root@localhost ~]# yum -y install mysql mysql-server mysql-devel
[root@localhost ~]# service mysqld start
[root@localhost ~]# mysqladmin -u root password 'justin'
[root@localhost ~]# mysql -uroot -pjustin
mysql> use mysql;
Database changed
mysql> grant select on *.* to nagios@'%' identified by 'justin123';
Query OK, 0 rows affected (0.00 sec)
mysql> select User,Password,Host from user; #select User,Password,Host from mysql.user
+--------+-------------------------------------------+-----------------------+
| User | Password | Host |
+--------+-------------------------------------------+-----------------------+
| root | *418F5110126E965257925334DE2CECD97AE332B5 | localhost |
| root | | localhost.localdomain |
| root | | 127.0.0.1 |
| | | localhost |
| | | localhost.localdomain |
| nagios | *E9DD5BD77E90EA650CC5ECE06C3103D040F502A5 | % |
+--------+-------------------------------------------+-----------------------+
6 rows in set (0.00 sec)
mysql> quit;
Bye
[root@localhost ~]# vim /etc/sysconfig/iptables
...
-A INPUT -p tcp -m state --state NEW -m tcp --dport 22 -j ACCEPT
-A INPUT -p tcp -m state --state NEW -m tcp --dport 3306 -j ACCEPT
...
[root@localhost ~]# service iptables restart
监控端(Nagios服务器192.168.100.177)
第一种方法:使用nagios-plugins 官方自带的chech_mysql插件
最新版本的nagios-plugins会有mysql_check,如果没有需要先安装mysql-devel,然后在重新编译安装一次nagios-plugins插件。[root@localhost libexec]# ll check_mysql
-rwxr-xr-x. 1 nagios nagios 129540 Sep 25 2012 check_mysql
[root@localhost libexec]# pwd
/usr/local/nagios/libexec
[root@localhost libexec]# ./check_mysql -h
Usage:
check_mysql [-d database] [-H host] [-P port] [-s socket]
[-u user] [-p password] [-S]
-d, --database=STRING
Check database with indicated name
-H, --hostname=ADDRESS
Host name, IP Address, or unix socket (must be an absolute path)
-P, --port=INTEGER
Port number (default: 3306)
-s, --socket=STRING
Use the specified socket (has no effect if -H is used)
-u, --username=STRING
Connect using the indicated username
-p, --password=STRING
Use the indicated password to authenticate the connection
==> IMPORTANT: THIS FORM OF AUTHENTICATION IS NOT SECURE!!! <==
Your clear-text password could be visible as a process table entry
-S, --check-slave
Check if the slave thread is running properly.
-w, --warning
Exit with WARNING status if slave server is more than INTEGER seconds
behind master
-c, --critical
Exit with CRITICAL status if slave server is more then INTEGER seconds
behind master
[root@localhost libexec]# ./check_mysql -H 10.15.44.136 -u nagios -d mysql -p justin123 -P 3306
Uptime: 2837 Threads: 1 Questions: 89 Slow queries: 0 Opens: 30 Flush tables: 1 Open tables: 23 Queries per second avg: 0.31
[root@localhost libexec]#
第二种方法:使用check_mysql_health
check_mysql_health官方介绍主页:http://labs.consol.de/nagios/check_mysql_health/
最新版本的check_mysql_health-2.2.2:
https://labs.consol.de/assets/downloads/nagios/check_mysql_health-2.2.2.tar.gz
以上地址无法下载可以从这里获取:http://download.csdn.net/detail/hellopengyl/9617697[root@localhost ~]# wget
[root@localhost ~]# tar zxvf check_mysql_health-2.2.2.tar.gz
[root@localhost ~]# cd check_mysql_health-2.2.2
[root@localhost check_mysql_health-2.2.2]# ./configure –prefix=/usr/local/nagios –with-nagios-user=nagios –with-nagios-group=nagios –with-perl –with-statefiles-dir=/tmp
[root@localhost check_mysql_health-2.2.2]# make
[root@localhost check_mysql_health-2.2.2]# make install
[root@localhost check_mysql_health-2.2.2]# cd /usr/local/nagios/libexec
[root@localhost libexec]# ./check_mysql_health
./check_mysql_health: yes: bad interpreter: No such file or directory
[root@localhost libexec]# vim check_mysql_health
#! /usr/bin/perl -w
# nagios: -epn
my %ERRORS=( OK => 0, WARNING => 1, CRITICAL => 2, UNKNOWN => 3 );
...
[root@localhost libexec]#
出现Can't locate DBI.pm的错误时:是由于没有安装perl DBD-MySQL驱动,可以直接用yum安装yum install perl-DBI perl-DBD-MySQL -y,也可以利用源码安装perl DBD-MySQL驱动,http://www.cpan.org/modules/by-module/DBD/找到最新的版本,现在最新的为DBD-mysql-4.036.tar.gz[root@localhost ~]# cd DBD-mysql-4.036
[root@localhost DBD-mysql-4.036]# per Makefile.PL --mysql_config=/usr/bin/mysql_config
[root@localhost DBD-mysql-4.036]# make && make install
./check_mysql_health: yes: bad interpreter: No such file or directory,因为check_mysql_health是用perl写的,将check_mysql_health的第一行由原来的#! yes -w修改为#!/usr/bin/perl -w,这样就OK[root@localhost libexec]# ./check_mysql_health -h
Usage:
check_mysql_health [-v] [-t ] [[--hostname ]
[--port | --socket ]
--username --password ] --mode
[--method mysql]
check_mysql_health [-h | --help]
check_mysql_health [-V | --version]
Options:
--hostname
the database server's hostname
--port
the database's port. (default: 3306)
--username
the mysql db user
--password
the mysql db user's password
--database
the database's name. (default: information_schema)
--warning
the warning range
--critical
the critical range
--mode
threads-connected (Number of currently open connections)
slave-io-running (Slave io running: Yes)
slave-sql-running (Slave sql running: Yes)
connection-time (Time to connect to the server) MySQL连接时间
threads-connected (Number of currently open connections)MySQL连接数
slow-queries (Slow queries)MySQL慢查询情况
table-lock-contention(Table lock contention)MySQL锁表情况
tablecache-hitrate (Table cache hitrate)查询线程缓存命中率状态
qcache-hitrate (Query cache hitrate)查询命中率
...
[root@localhost libexec]# ./check_mysql_health --hostname 10.15.44.136 --port 3306 -username nagios --password justin123 --mode connection-time
OK - 0.87 seconds to connect as nagios | connection_time=0.8670s;1;5
[root@localhost libexec]# ./check_mysql_health --hostname 10.15.44.136 --port 3306 -username nagios --password justin123 --mode connection-time --warning 0.001 --critical 0.0011
CRITICAL - 0.04 seconds to connect as nagios | connection_time=0.0448s;0;0
[root@localhost libexec]#
检查连接时间,默认是warning是1s.critical是5s,后测试用了0.0001s和0.0011s。
后面就是在commands.cfg中定义命令,然后添加服务。
如果web面板可能提示错误:
CRITICAL – statefilesdir /var/tmp/check_mysql_health does not exist or is not writable
可能和权限关系或者/var/temp下没有这个check_mysql_health
查看下check_mysql_health的权限所属。插件的权限应该所属nagios用户和组。[root@localhost libexec]# ll check_mysql_health
-rwxr-xr-x. 1 root root 122024 Sep 23 2014 check_mysql_health
[root@localhost libexec]# chown nagios:nagios check_mysql_health
[root@localhost libexec]# ll check_mysql_health
-rwxr-xr-x. 1 nagios nagios 122024 Sep 23 2014 check_mysql_health
[root@localhost libexec]# ln -s /usr/local/nagios/libexec/check_mysql_health /var/tmp/check_mysql_health
MySQL主从复制监控
监控MySQL主从复制主要是通过在mysql从服务器执行 mysql> show slave status/G 查看其输出,最关键处就是"Slave_IO_Running: Yes “和“Slave_SQL_Running: Yes ”,这两个值全是"Yes"就表明主从复制正常,否则就是有问题。mysql> show slave status/G
*************************** 1. row ***************************
Slave_IO_State: Waiting for master to send event
Master_Host: 10.15.98.112
Master_User: rep1
Master_Port: 3306
Connect_Retry: 60
Master_Log_File: mysql-bin.000004
Read_Master_Log_Pos: 1752541
Relay_Log_File: hy-mysql3-relay-bin.000088
Relay_Log_Pos: 2339
Relay_Master_Log_File: mysql-bin.000004
Slave_IO_Running: Yes
Slave_SQL_Running: Yes
Replicate_Do_DB:
mysql>
监控主从复制需要在MySQL从授权Replication client权限。mysql > grant Replication client on *.* to 'nagios'@'%' identified by 'justin';
mysql> flush privileges;
[root@MQ-2 ~]# /opt/mysql5623/bin/mysql -unagios -pjustin -e 'show slave status\G'
此时在nagios服务端通过check_mysql_health就可以正常获取数据[root@localhost libexec]# ./check_mysql_health --hostname 10.15.97.87 --port 33061 -username nagios --password finchina --mode slave-sql-running
OK - Slave sql is running
[root@localhost libexec]# ./check_mysql_health --hostname 222.73.177.25 --port 33061 -username nagios --password finchina --mode slave-io-running
OK - Slave io is running
[root@localhost libexec]#
通过check_mysql_health检查要写两条命令,我这里通过脚本来检测。
在MySQL从服务器上建立脚本[root@MQ-2 ~]# vim /usr/local/nagios/libexec/chech_mysql_slave.sh
#!/bin/sh
declare -a slave_is
slave_is=($(/opt/mysql5623/bin/mysql -uroot -h127.0.0.1 -p111111 -e 'show slave status\G'|grep Running|awk '{print $2}'))
if [ "${slave_is[0]}" = "Yes" -a "${slave_is[1]}" = "Yes" ];then
echo "OK - Slave is running"
exit 0
else
echo "Critical -Slave is error"
exit 2
fi
[root@MQ-2 ~]# vim /usr/local/nagios/etc/nrpe.cfg
command[check_disk_root]=/usr/local/nagios/libexec/check_disk -w 20% -c 10% -p /dev/sda3
command[check_mysql_slave]= /usr/local/nagios/libexec/chech_mysql_slave.sh
[root@localhost ~]# service nrpe restart
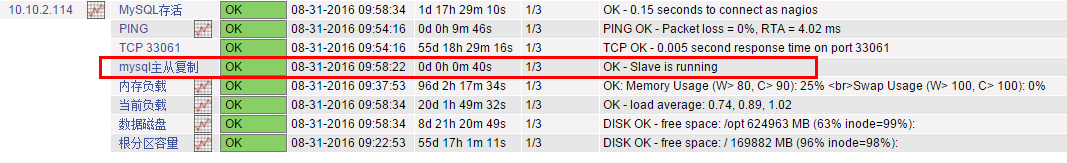
在nagios服务端用命令检测[root@localhost libexec]# ./check_nrpe -H 10.10.2.114 -c check_mysql_Slave
NRPE: Command 'check_mysql_Slave' not defined
[root@localhost libexec]# ./check_nrpe -H 10.10.2.114 -c check_mysql-slave
OK - Slave is running
[root@localhost libexec]#
提示Command 'check_mysql_Slave' not defined,确认-c 后面参数和客户端定义的命令参数保持一致,可以正常获取数据后在Nagios服务端添加服务。
我这里是通过nagiosql管理nagios,在服务力添加即可。
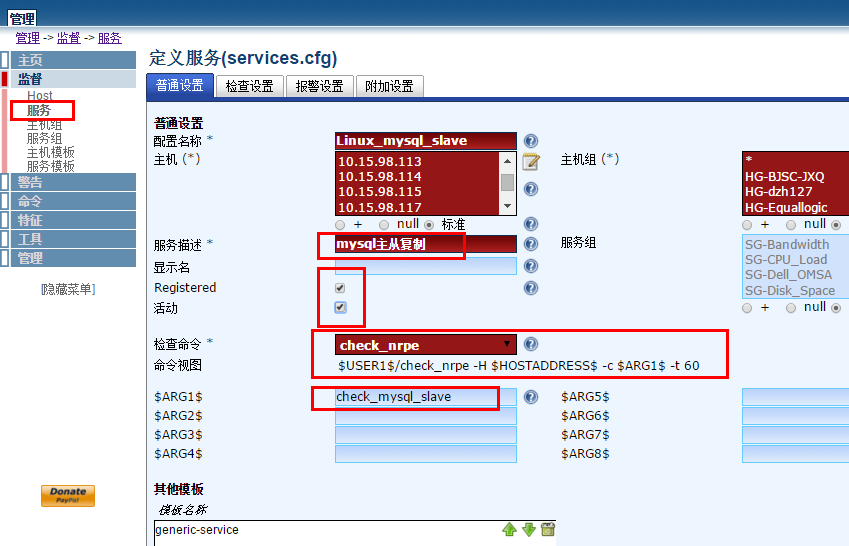

华为开发者空间,是为全球开发者打造的专属开发空间,汇聚了华为优质开发资源及工具,致力于让每一位开发者拥有一台云主机,基于华为根生态开发、创新。
更多推荐


 0
0 0
0- 0


 已为社区贡献2条内容

所有评论(0)