uniapp中使用echarts app/h5适用
uniapp使用echarts
·
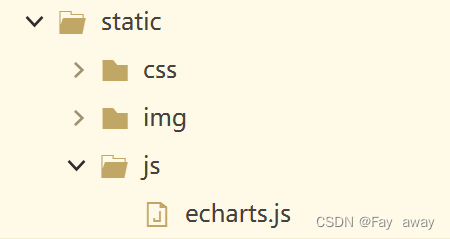
首先下载echarts.min.js
下载完成放在static/js下 ,我的目录是这样的
然后在components写一个echart组件
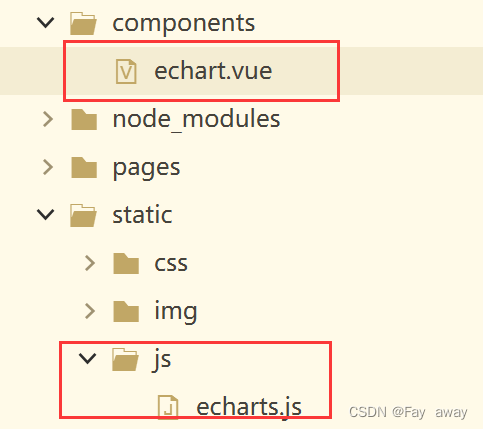
echart.vue
<template>
	<view class="content">
		<view @click="echarts.onClick" :prop="option" :defaultClickNumber="defaultClickNumber"
			:change:defaultClickNumber="echarts.defaultClickNumberMsg" :change:prop="echarts.updateEcharts"
			:id="option.id" class="echarts">
		</view>
	</view>
</template>

<script>
	export default {
		name: "echarts",
		props: {
			option: {
				type: Object,
				require: true,
				default: {
					id: null
				}
			},
			defaultClickNumber: {
				type: Number,
				require: false,
				default: 0
			}
		},
		methods: {
			onViewClick(options) {
				this.$emit("click", options)
			}
		}
	}
</script>

<script module="echarts" lang="renderjs">
//如果app上不管用 就把下边这个松开
	// import * as echarts from 'echarts';
	export default {
		name: "echarts",
		data() {
			return{
				myChart: null,
				// defaultClickNumber: 0,
				clickData: {}
			}

		},
		mounted() {
			console.log(window.echarts)
			if (typeof window.echarts === 'function') {
				this.initEcharts()
			} else {
				const that = this;
				const script = document.createElement('script')
				script.src = '../../static/js/echarts.js'
				script.onload=this.initEcharts() //这行在app端好用
				//下面的代码在h5端是好用的,但是app端不走,如果引入js不好使,你再去官网下载其他的js
				script.onload = function(t) {
					const scriptLi = document.createElement("script");
					scriptLi.src = '../../static/js/echarts.js'
					scriptLi.onload = that.initEcharts.bind(that)
					document.head.appendChild(scriptLi)
				}
				document.head.appendChild(script)
			}
		},
		methods: {
			initEcharts() {
				const that = this;
				try{
					let echartsDoc = document.getElementById(that.option.id);
					// console.log("echarts",echarts)
					that.myChart = echarts.init(echartsDoc)
					if (that.myChart) {
						that.myChart.setOption(that.option)
						if (that.defaultClickNumber != 0) {
							that.defaultClick(that.defaultClickNumber);
						}
						that.myChart.on('click', param => {
							that.clickData = param;
						})
					}
				}catch(e){
					//TODO handle the exception
				}
		},
		//虽然没什么效果 但是一块抄上就完事了
		defaultClickNumberMsg(newValue, oldValue, ownerInstance, instance) {
			// 监听 service 层defaultClickNumber数据变更 必须在view上绑定defaultClickNumber 然后在通过change事件监听执行此方法
			this.defaultClickNumber = newValue;
		},
		updateEcharts(newValue, oldValue, ownerInstance, instance) {
			// 监听 service 层数据变更
			try{
				this.myChart.setOption(newValue)
			}catch(e){
			}
		},
		onClick(event, ownerInstance) {
			// 调用 service 层的方法
			ownerInstance.callMethod('onViewClick', {})
		},
		defaultClick(defaultClickNumber) { //默认选中第几个数据
			if (this.myChart) {
				this.myChart.dispatchAction({
					type: 'highlight',
					seriesIndex: 0,
					dataIndex: defaultClickNumber
				});
				// 当鼠标移入时,如果不是第一项,则把当前项置为选中,如果是第一项,则设置第一项为当前项
				this.myChart.on('mouseover', function(e) {
					this.myChart.dispatchAction({
						type: 'highlight',
						seriesIndex: 0,
						dataIndex: e.dataIndex
					});

				});

				//当鼠标离开时,把当前项置为选中
				this.myChart.on('mouseout', function(e) {
					index = e.dataIndex;
					this.myChart.dispatchAction({
						type: 'highlight',
						seriesIndex: 0,
						dataIndex: e.dataIndex
					});
				});
			}
		}
	}
	}
</script>

<style>
	.content {
		display: flex;
		flex-direction: column;
		align-items: center;
		justify-content: center;
	}

	.echarts {
		width: 100%;
		height: 100%;
	}
</style>
点击好像不管用啊,根据自己的情况酌情删除
然后在父组件中调用echart.vue
下边是父组件的代码
<echart class="echarts" :style="{width:'100%',height:'250px'}" :option="Options"></echart>
import echart from "../../components/echart.vue";
export default {
components: {
'echart': echart
},
data() {
return {
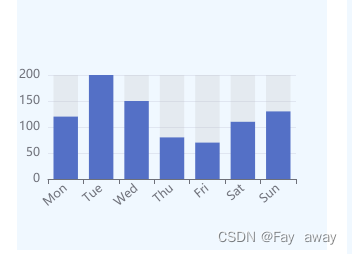
//写配置项,我用的是柱状图,可以根据自己的需求改
Options: {
id: 'option1',
xAxis: {
type: 'category',
axisLabel: {
interval: 0,
rotate: 40
},
data: ['Mon', 'Tue', 'Wed', 'Thu', 'Fri', 'Sat', 'Sun']
},
yAxis: {
type: 'value'
},
series: [{
data: [120, 200, 150, 80, 70, 110, 130],
type: 'bar',
showBackground: true,
backgroundStyle: {
color: 'rgba(180, 180, 180, 0.2)'
}
}]
}
}
},
onLoad(){
this.getlist()
},
methods:{
//根据请求修改数据
getlist(){
var that = this
uni.request({
url:'你的地址',
method:'post',
data:'你的数据',
header:{'你的请求头'},
success(res){
console.log(res)
//根据你的数据格式调整 Options里边的数据
that.Options.xAxis.data = '你的x轴数据'
that.Options.series[0].data = '你的y轴数据'
console.log(that.Options)
}
})
}
}
完成!

为开发者提供学习成长、分享交流、生态实践、资源工具等服务,帮助开发者快速成长。
更多推荐


 1
1 0
0- 0


 已为社区贡献3条内容

所有评论(0)