Centos7 安装ELK7.x,鲲鹏系统
1 引言如果你正在寻找如何快速安装和配置ELK,那么恭喜你找对教程了。这篇博文我们就来分享下如何在Centos7 鲲鹏服务器上搭建ELK 7.x 版本2 开始之前在开始搭建之前,我们首先需要先检查 ELK 对 自己服务器的操作系统以及 JDK 是否兼容。点击查看ELK对操作系统是否兼容点击查看ELK对JDK是否兼容信息列表ELK 是Elasticsearch ,Logstash, Kibana 的
1 引言
如果你正在寻找如何快速安装和配置ELK,那么恭喜你找对教程了。
这篇博文我们就来分享下如何在Centos7 鲲鹏服务器上搭建ELK 7.x 版本
2 开始之前
在开始搭建之前,我们首先需要先检查 ELK 对 自己服务器的操作系统以及 JDK 是否兼容。
ELK 是Elasticsearch ,Logstash, Kibana 的简称缩写,主要专注于可视化日志分析和查询
Elastic Stack 主要包括三大部分,
海量数据存储和检索----- Elasticsearch 分布式存储和查询
可视化界面和图表生成----Kibana 可提供可视化界面和各种图表的生成。
数据采集-----可以用Logstash采集日志也可以使用FileBeat 采集日志。
所以ELK 不过是Elastic Stack 用法中日志分析栈的一部分罢了。
3.下载elk所需的4个压缩包
ES 的官方下载地址: Download Elasticsearch | Elastic
kibana的官方下载地址: Download Kibana Free | Get Started Now | Elastic
Logstash 官方下载地址:Download Logstash Free | Get Started Now | Elastic
Filebeat官方下载地址:Download Logstash Free | Get Started Now | Elastic
首先进入linux文件夹 、usr/local/elk
使用curl 命令行下载ES,kibana,logstash,filebeat
curl -L -O https://artifacts.elastic.co/downloads/elasticsearch/elasticsearch-7.13.4-linux-aarch64.tar.gz;
curl -L -O https://artifacts.elastic.co/downloads/kibana/kibana-7.13.4-linux-aarch64.tar.gz;
curl -L -O https://artifacts.elastic.co/downloads/logstash/logstash-7.13.4-linux-aarch64.tar.gz;
curl -L -O https://artifacts.elastic.co/downloads/beats/filebeat/filebeat-7.13.4-linux-arm64.tar.gz;
如果操作系统不支持curl命令也可以使用wget命令下载
wget https://artifacts.elastic.co/downloads/elasticsearch/elasticsearch-7.13.4-linux-aarch64.tar.gz;
wget https://artifacts.elastic.co/downloads/kibana/kibana-7.13.4-linux-aarch64.tar.gz;
wget https://artifacts.elastic.co/downloads/logstash/logstash-7.13.4-linux-aarch64.tar.gz;
wget https://artifacts.elastic.co/downloads/beats/filebeat/filebeat-7.13.4-linux-arm64.tar.gz;
4.安装es
4.1 解压ES
tar -zxvf elasticsearch-7.13.4-linux-aarch64.tar.gzcd elasticsearch-7.13.4 4.2修改操作系统限制
在Centos7 Linux 操作系统中,默认单个进程可以打开的最多文件数是1024
但是ES 对操作系统有些特殊要求
要求操作系统单个进程可以打开的最大文件数最少要达到65535.
而且ES 将会使用很多线程,也需要修改下操作系统限制。
如果不配置就会报错如下所示:
bootstrap checks failed. You must address the points described in the following [3] lines before starting Elasticsearch.
bootstrap check failure [1] of [3]: max file descriptors [4096] for elasticsearch process is too low, increase to at least [65535]
bootstrap check failure [2] of [3]: max number of threads [3687] for user [elasticsearch] is too low, increase to at least [4096]
bootstrap check failure [3] of [3]: max virtual memory areas vm.max_map_count [65530] is too low, increase to at least [262144]
解决方案:
如果想检查当前操作系统支持单个进程可以打开的最多文件数输入如下命令即可:
ulimit -n
返回值如果没修改会显示1024
要修复bootstrap check failure [1] of [3] 和bootstrap check failure [2] of [3]错误
需要修改/etc/security/limits.conf
vi /etc/security/limits.conf
编辑内容如下:
* soft nofile 65535
* hard nofile 65535
* hard nproc 4096
* soft nproc 4096
如下是参考:
root soft nofile 65535
root hard nofile 65535
* soft nofile 65535
* hard nofile 65535
elastic soft memlock unlimited
elastic hard memlock unlimited
elastic soft nofile 65536
elastic hard nofile 65536
设置限制数量,第一列表示用户,* 表示所有用户
soft nproc :单个用户可用的最大进程数量(超过会警告);
hard nproc:单个用户可用的最大进程数量(超过会报错);
soft nofile :可打开的文件描述符的最大数(超过会警告);
hard nofile :可打开的文件描述符的最大数(超过会报错);
原文链接:https://blog.csdn.net/zxljsbk/article/details/89153690
断开session 链接,重新登陆生效
要修复bootstrap check failure [3] of [3] 错误,需要修改/etc/sysctl.conf
vi /etc/sysctl.conf
编辑内容如下:
vm.max_map_count=262144
vm.max_map_count配置确保操作系统拥有足够多的虚拟内存- 如果使用的是包管理器方式安装,那么不需要这个操作,默认会进行配置。
刷新配置立即生效
sysctl -p
4.3 创建ES 用户
除此之外,ES 7.x 开始不再允许以任何方式使用root 用户直接操作ES,因此需要创建一个非root 用户。
ES 7.x 之前支持通过命令参数强行允许使用root用户执行ES, 但为了安全性,ES7.x 不再允许。
如果想查看当前Linux 下的所有用户列表,可输入如下命令:
compgen -u
因此我们还需要创建一个叫做非root用户,比如我们新创建一个叫做elastic的用户
# 创建用户
adduser elastic
然后为elastic 用户创建登陆密码,至少需要八位
# 选择要修改密码的用户名称
passwd elastic
执行后会提示两次输入密码,比如我们设置密码为es611521
New Password: es611521
Retype new password: es611521
再然后将es文件夹的操作权限授予elastic用户
# 授予执行权限
chmod u+x  /usr/local/elk/elasticsearch-7.13.4/bin
# ES 文件夹权限授权给elastic 用户
chown -R elastic /usr/local/elk/
# 创建数据文件夹
mkdir -p /usr/local/elk/data/es
# 将ES数据存储文件夹权限授权给elastic用户
chown -R elastic /usr/local/elk/data/es
# 创建日志文件夹
# 将ES 日志存储文件夹权限授权给elastic用户
chown -R elastic /usr/local/elk/data/es
4.4 修改 elasticsearch.yml 配置文件
进入config 文件
cd /usr/local/elk/elasticsearch-7.13.4/config编辑elasticsearch.yml
vi elasticsearch.yml# ======================== Elasticsearch Configuration ========================= # # NOTE: Elasticsearch comes with reasonable defaults for most settings. # Before you set out to tweak and tune the configuration, make sure you # understand what are you trying to accomplish and the consequences. # # The primary way of configuring a node is via this file. This template lists # the most important settings you may want to configure for a production cluster. # # Please consult the documentation for further information on configuration options: # https://www.elastic.co/guide/en/elasticsearch/reference/index.html # # ---------------------------------- Cluster ----------------------------------- # # Use a descriptive name for your cluster: #集群名称 cluster.name: my-es # # ------------------------------------ Node ------------------------------------ # # Use a descriptive name for the node: #集群节点���称 node.name: node-1 # ES默认 只允许本地 127.0.0.1 和[::1] 访问 # # 也可以设置成0.0.0.0 允许所有IP主机访问 # # 如果不配置就默认认为是开发者模式,如果配置不正确会写入警告但是能正确运行 # # 如果配置了就会认为进入了生产环境, 如果配置不正确就会升级为异常,ES无法正确启动。 network.host: 0.0.0.0 # Add custom attributes to the node: # #node.attr.rack: r1 # # ----------------------------------- Paths ------------------------------------ # # Path to directory where to store the data (separate multiple locations by comma): #设置数据存放路径,建议修改这个路径到ES的安装文件夹外面,避免ES升级误删掉这个文件夹 path.data: /usr/local/elk/data/es # # Path to log files: #设置数据存放路径,建议修改这个路径到ES的安装文件夹外面,避免ES升级误删掉这个文件夹 path.logs: /usr/local/elk/data/es # ----------------------------------- Memory ----------------------------------- # # Lock the memory on startup: # #bootstrap.memory_lock: false # # Make sure that the heap size is set to about half the memory available # on the system and that the owner of the process is allowed to use this # limit. # # Elasticsearch performs poorly when the system is swapping the memory. # # ---------------------------------- Network ----------------------------------- # # By default Elasticsearch is only accessible on localhost. Set a different # address here to expose this node on the network: # #network.host: 127.0.0.1 # # By default Elasticsearch listens for HTTP traffic on the first free port it # finds starting at 9200. Set a specific HTTP port here: #默认ES节点端口9200,如果是伪集群(在一台服务器上搭建集群),需要修改 http.port: 9200 # For more information, consult the network module documentation. # # --------------------------------- Discovery ---------------------------------- # # Pass an initial list of hosts to perform discovery when this node is started: # The default list of hosts is ["127.0.0.1", "[::1]"] #发现其他节点主机配置 这里配置的是ES所在服务器的公网IP地址 discovery.seed_hosts: ["127.0.0.1"] # # Bootstrap the cluster using an initial set of master-eligible nodes: #哪些节点可以被选举为主节点配置 cluster.initial_master_nodes: ["node-1"] # # For more information, consult the discovery and cluster formation module documentation. # # ---------------------------------- Various ----------------------------------- # # Require explicit names when deleting indices: # #action.destructive_requires_name: true #配置密码登录,kabana相应的配置 #xpack.security.enabled: true #xpack.license.self_generated.type: basic #xpack.security.transport.ssl.enabled: true启动Elasticsearch
最后切换用户登陆
# 切换用户
su elastic
启动ES
./bin/elasticsearch
后台启动ES/usr/local/elk/elasticsearch-7.13.4-1/bin/elasticsearch -d访问Elasticsearch
- http://127.0.0.1:9200/
执行成功后会返回类似下面的内容
{
  "name": "node-1",
  "cluster_name": "my-es",
  "cluster_uuid": "M0PH3gmtRu2Ov0mlP6uZDA",
  "version": {
    "number": "7.13.4",
    "build_flavor": "default",
    "build_type": "tar",
    "build_hash": "78722783c38caa25a70982b5b042074cde5d3b3a",
    "build_date": "2021-03-18T06:17:15.410153305Z",
    "build_snapshot": false,
    "lucene_version": "8.8.0",
    "minimum_wire_compatibility_version": "6.8.0",
    "minimum_index_compatibility_version": "6.0.0-beta1"
  },
  "tagline": "You Know, for Search"
}
5.安装kibana
解压Kibana
tar xzvf kibana-7.13.4-linux-aarch64.tar.gz- 进入Kibana 文件夹并编辑kibana.yml 文件
vim /usr/local/elk/kibana-7.13.4/config/kibana.yml编辑内容如下
# Kibana is served by a back end server. This setting specifies the port to use. #Kibana 默认监听端口5601,如果需要改变就修改这个配置 server.port: 5601 # Specifies the address to which the Kibana server will bind. IP addresses and host names are both valid values. # The default is 'localhost', which usually means remote machines will not be able to connect. # To allow connections from remote users, set this parameter to a non-loopback address. #Kibana 部署服务器IP,如果是单网卡配置0.0.0.0即可,如果是多网卡需要配置IP server.host: "0.0.0.0" # Enables you to specify a path to mount Kibana at if you are running behind a proxy. # Use the `server.rewriteBasePath` setting to tell Kibana if it should remove the basePath # from requests it receives, and to prevent a deprecation warning at startup. # This setting cannot end in a slash. #server.basePath: "" # Specifies whether Kibana should rewrite requests that are prefixed with # `server.basePath` or require that they are rewritten by your reverse proxy. # This setting was effectively always `false` before Kibana 6.3 and will # default to `true` starting in Kibana 7.0. #server.rewriteBasePath: false # Specifies the public URL at which Kibana is available for end users. If # `server.basePath` is configured this URL should end with the same basePath. #server.publicBaseUrl: "" # The maximum payload size in bytes for incoming server requests. #server.maxPayload: 1048576 # The Kibana server's name. This is used for display purposes. # 配置服务器的名称 server.name: "my-kibana" # The URLs of the Elasticsearch instances to use for all your queries. # 配置ES的集群节点地址 elasticsearch.hosts: ["http://127.0.0.1:9200"] # Kibana uses an index in Elasticsearch to store saved searches, visualizations and # dashboards. Kibana creates a new index if the index doesn't already exist. # 创建一个kibana索引 kibana.index: ".kibana" # The default application to load. #kibana.defaultAppId: "home" # index at startup. Your Kibana users still need to authenticate with Elasticsearch, which # is proxied through the Kibana server. #如果有设置访问密码,就填写这个 #elasticsearch.username: "elastic" #elasticsearch.password: "xxxx" # Enables SSL and paths to the PEM-format SSL certificate and SSL key files, respectively. # These settings enable SSL for outgoing requests from the Kibana server to the browser. #server.ssl.enabled: false #server.ssl.certificate: /path/to/your/server.crt #server.ssl.key: /path/to/your/server.key # Optional settings that provide the paths to the PEM-format SSL certificate and key files. # These files are used to verify the identity of Kibana to Elasticsearch and are required when # xpack.security.http.ssl.client_authentication in Elasticsearch is set to required. #elasticsearch.ssl.certificate: /path/to/your/client.crt #elasticsearch.ssl.key: /path/to/your/client.key # Optional setting that enables you to specify a path to the PEM file for the certificate # authority for your Elasticsearch instance. #elasticsearch.ssl.certificateAuthorities: [ "/path/to/your/CA.pem" ] # To disregard the validity of SSL certificates, change this setting's value to 'none'. #elasticsearch.ssl.verificationMode: full # Time in milliseconds to wait for Elasticsearch to respond to pings. Defaults to the value of # the elasticsearch.requestTimeout setting. #elasticsearch.pingTimeout: 1500 # Time in milliseconds to wait for responses from the back end or Elasticsearch. This value # must be a positive integer. elasticsearch.requestTimeout: 60000 # List of Kibana client-side headers to send to Elasticsearch. To send *no* client-side # headers, set this value to [] (an empty list). #elasticsearch.requestHeadersWhitelist: [ authorization ] # Header names and values that are sent to Elasticsearch. Any custom headers cannot be overwritten # by client-side headers, regardless of the elasticsearch.requestHeadersWhitelist configuration. #elasticsearch.customHeaders: {} # Time in milliseconds for Elasticsearch to wait for responses from shards. Set to 0 to disable. #elasticsearch.shardTimeout: 30000 # Logs queries sent to Elasticsearch. Requires logging.verbose set to true. #elasticsearch.logQueries: false # Specifies the path where Kibana creates the process ID file. #pid.file: /run/kibana/kibana.pid # Enables you to specify a file where Kibana stores log output. #logging.dest: stdout # Set the value of this setting to true to suppress all logging output. #logging.silent: false # Set the value of this setting to true to suppress all logging output other than error messages. #logging.quiet: false # Set the value of this setting to true to log all events, including system usage information # and all requests. #logging.verbose: false # Set the interval in milliseconds to sample system and process performance # metrics. Minimum is 100ms. Defaults to 5000. #ops.interval: 5000 # Specifies locale to be used for all localizable strings, dates and number formats. # Supported languages are the following: English - en , by default , Chinese - zh-CN . i18n.locale: "zh-CH"- 启动Kibana
/usr/local/elk/kibana-7.13.4/bin/kibana如果用root 用户执行,那么需要带上参数:
/usr/local/elk/kibana-7.13.4/bin/kibana --allow-root如果想后台运行kibana 那么需要带上参数:
nohup /usr/local/elk/kibana-7.13.4/bin/kibana &
#root用户执行
nohup /usr/local/elk/kibana-7.13.4/bin/kibana  --allow-root &
访问Kibana
启动成功后,打开网址:http://127.0.0.1:5601
6.安装Logstash 采集日志
新建一个配置文件 logstash.conf
vim /usr/local/elk/logstash-7.13.4/config/logstash.conf# 配置文件 开始 #
input {
tcp {
mode => "server"
host => "0.0.0.0"
port => 4560
codec => json_lines
}
}
filter {
grok {
match => { "message" => "%{COMBINEDAPACHELOG}" }
}
geoip {
source => "clientip"
}
}
output {
elasticsearch {
hosts => ["http://127.0.0.1:9200"]
index => "yp-%{[appname]}"
user => "elastic"
password => "xxx"
}
}
# 配置文件 结束 #启动Logstash
/usr/local/elk/logstash-7.13.4/bin/logstash -f /usr/local/elk/logstash-7.13.4/config/logstash.conf后台启动Logstash
nohup /usr/local/elk/logstash-7.13.4/bin/logstash -f /usr/local/elk/logstash-7.13.4/config/logstash.conf &7.使用FileBeat 采集日志
- 解压FileBeat
tar xzvf filebeat-7.13.4-linux-arm64.tar.gz配置Filebeat连接到Elasticsearch 和Kibana
vim /usr/local/elk/filebeat-7.13.4/filebeat.yml编辑filebeat.yml 文件内容如下:
###################### Filebeat Configuration Example #########################

# This file is an example configuration file highlighting only the most common
# options. The filebeat.reference.yml file from the same directory contains all the
# supported options with more comments. You can use it as a reference.
#
# You can find the full configuration reference here:
# https://www.elastic.co/guide/en/beats/filebeat/index.html

# For more available modules and options, please see the filebeat.reference.yml sample
# configuration file.

# ============================== Filebeat inputs ===============================

filebeat.inputs:

# Each - is an input. Most options can be set at the input level, so
# you can use different inputs for various configurations.
# Below are the input specific configurations.

- type: log

  # Change to true to enable this input configuration.
  enabled: false

  # Paths that should be crawled and fetched. Glob based paths.
  paths:
    - /var/log/*.log
    #- c:\programdata\elasticsearch\logs\*

  # Exclude lines. A list of regular expressions to match. It drops the lines that are
  # matching any regular expression from the list.
  #exclude_lines: ['^DBG']

  # Include lines. A list of regular expressions to match. It exports the lines that are
  # matching any regular expression from the list.
  #include_lines: ['^ERR', '^WARN']

  # Exclude files. A list of regular expressions to match. Filebeat drops the files that
  # are matching any regular expression from the list. By default, no files are dropped.
  #exclude_files: ['.gz$']

  # Optional additional fields. These fields can be freely picked
  # to add additional information to the crawled log files for filtering
#fields:
  #  level: debug
  #  review: 1

  ### Multiline options

  # Multiline can be used for log messages spanning multiple lines. This is common
  # for Java Stack Traces or C-Line Continuation

  # The regexp Pattern that has to be matched. The example pattern matches all lines starting with [
  #multiline.pattern: ^\[

  # Defines if the pattern set under pattern should be negated or not. Default is false.
  #multiline.negate: false

  # Match can be set to "after" or "before". It is used to define if lines should be append to a pattern
  # that was (not) matched before or after or as long as a pattern is not matched based on negate.
  # Note: After is the equivalent to previous and before is the equivalent to to next in Logstash
  #multiline.match: after

# filestream is an experimental input. It is going to replace log input in the future.
- type: filestream

  # Change to true to enable this input configuration.
  enabled: false

  # Paths that should be crawled and fetched. Glob based paths.
  paths:
    - /var/log/*.log
    #- c:\programdata\elasticsearch\logs\*

  # Exclude lines. A list of regular expressions to match. It drops the lines that are
  # matching any regular expression from the list.
  #exclude_lines: ['^DBG']

  # Include lines. A list of regular expressions to match. It exports the lines that are
  # matching any regular expression from the list.
  #include_lines: ['^ERR', '^WARN']

  # Exclude files. A list of regular expressions to match. Filebeat drops the files that
 #fields:
  #  level: debug
  #  review: 1

# ============================== Filebeat modules ==============================

filebeat.config.modules:
  # Glob pattern for configuration loading
  path: ${path.config}/modules.d/*.yml

  # Set to true to enable config reloadin配置自动加载
  reload.enabled: true

  # Period on which files under path should be checked for changes10秒检查一次
  reload.period: 10s

# ======================= Elasticsearch template setting =======================

setup.template.settings:
  index.number_of_shards: 1
  #index.codec: best_compression
  #_source.enabled: false


# ================================== General ===================================

# The name of the shipper that publishes the network data. It can be used to group
# all the transactions sent by a single shipper in the web interface.
#name:

# The tags of the shipper are included in their own field with each
# transaction published.
#tags: ["service-X", "web-tier"]

# Optional fields that you can specify to add additional information to the
# output.
#fields:
#  env: staging
# ================================= Dashboards =================================
# These settings control loading the sample dashboards to the Kibana index. Loading
# the dashboards is disabled by default and can be enabled either by setting the
# options here or by using the `setup` command.
#setup.dashboards.enabled: false

# The URL from where to download the dashboards archive. By default this URL
# has a value which is computed based on the Beat name and version. For released
# versions, this URL points to the dashboard archive on the artifacts.elastic.co
# website.
#setup.dashboards.url:

# =================================== Kibana ===================================

# Starting with Beats version 6.0.0, the dashboards are loaded via the Kibana API.
# This requires a Kibana endpoint configuration.
setup.kibana:

  # Kibana Host
  # Scheme and port can be left out and will be set to the default (http and 5601)
  # In case you specify and additional path, the scheme is required: http://localhost:5601/path
  # IPv6 addresses should always be defined as: https://[2001:db8::1]:5601
  host: "localhost:5601"

  # Kibana Space ID
  # ID of the Kibana Space into which the dashboards should be loaded. By default,
  # the Default Space will be used.
  #space.id:

# =============================== Elastic Cloud ================================

# These settings simplify using Filebeat with the Elastic Cloud (https://cloud.elastic.co/).

# The cloud.id setting overwrites the `output.elasticsearch.hosts` and
# `setup.kibana.host` options.
# You can find the `cloud.id` in the Elastic Cloud web UI.
#cloud.id:

# The cloud.auth setting overwrites the `output.elasticsearch.username` and
# `output.elasticsearch.password` settings. The format is `<user>:<pass>`.
#cloud.auth:

# ================================== Outputs ===================================
# Configure what output to use when sending the data collected by the beat.

# ---------------------------- Elasticsearch Output ----------------------------
output.elasticsearch:
  # Array of hosts to connect to.
  hosts: ["localhost:9200"]

  # Protocol - either `http` (default) or `https`.
  protocol: "http"

  # Authentication credentials - either API key or username/password.
  #api_key: "id:api_key"
  username: "elastic"
  password: "xxx"

# ------------------------------ Logstash Output -------------------------------
#output.logstash:
  # The Logstash hosts
  #hosts: ["localhost:5044"]

  # Optional SSL. By default is off.
  # List of root certificates for HTTPS server verifications
  #ssl.certificate_authorities: ["/etc/pki/root/ca.pem"]

  # Certificate for SSL client authentication
  #ssl.certificate: "/etc/pki/client/cert.pem"

  # Client Certificate Key
  #ssl.key: "/etc/pki/client/cert.key"

# ================================= Processors =================================
processors:
  - add_host_metadata:
      when.not.contains.tags: forwarded
  - add_cloud_metadata: ~
  - add_docker_metadata: ~
  - add_kubernetes_metadata: ~

# ================================== Logging ===================================

# Sets log level. The default log level is info.
# Available log levels are: error, warning, info, debug
#logging.level: debug

# At debug level, you can selectively enable logging only for some components.
# To enable all selectors use ["*"]. Examples of other selectors are "beat",
# "publisher", "service".
#logging.selectors: ["*"]

# ============================= X-Pack Monitoring ==============================
# Filebeat can export internal metrics to a central Elasticsearch monitoring
# cluster.  This requires xpack monitoring to be enabled in Elasticsearch.  The
# reporting is disabled by default.

# Set to true to enable the monitoring reporter.
#monitoring.enabled: false

# Sets the UUID of the Elasticsearch cluster under which monitoring data for this
# Filebeat instance will appear in the Stack Monitoring UI. If output.elasticsearch
# is enabled, the UUID is derived from the Elasticsearch cluster referenced by output.elasticsearch.
#monitoring.cluster_uuid:

# Uncomment to send the metrics to Elasticsearch. Most settings from the
# Elasticsearch output are accepted here as well.
# Note that the settings should point to your Elasticsearch *monitoring* cluster.
# Any setting that is not set is automatically inherited from the Elasticsearch
# output configuration, so if you have the Elasticsearch output configured such
# that it is pointing to your Elasticsearch monitoring cluster, you can simply
# uncomment the following line.
#monitoring.elasticsearch:

# ============================== Instrumentation ===============================
# Instrumentation support for the filebeat.
#instrumentation:
    # Set to true to enable instrumentation of filebeat.
    #enabled: false

    # Environment in which filebeat is running on (eg: staging, production, etc.)
    #environment: ""

    # APM Server hosts to report instrumentation results to.
    #hosts:
    #  - http://localhost:8200

    # API Key for the APM Server(s).
    # If api_key is set then secret_token will be ignored.
    #api_key:

    # Secret token for the APM Server(s).
    #secret_token:


# ================================= Migration ==================================

# This allows to enable 6.7 migration aliases
#migration.6_to_7.enabled: true
测试下配置是否正确
/usr/local/elk/filebeat-7.13.4/filebeat test config -e -c /usr/local/elk/filebeat-7.13.4/filebeat.ym启动filebeat
如果首次启动需要输入如下命令:
/usr/local/elk/filebeat-7.13.4/filebeat setup -e -c /usr/local/elk/filebeat-7.13.4/filebeat.yml
以后启动需要输入如下命令:
/usr/local/elk/filebeat-7.13.4/filebeat -e -c /usr/local/elk/filebeat-7.13.4/filebeat.yml
- 如果需要后台运行filebeat
-
nohup /usr/local/elk/filebeat-7.13.4/filebeat -e -c /usr/local/elk/filebeat-7.13.4/filebeat.yml -d "Publish" & > nohup.out如果想停止filebeat,那么可以输入如下命令
-
ps aux | grep filebeat把进程kill掉就可以
-
本篇完~
-
如果需要设置kibana跟elasticsearch密码,请往下看
-
修改es的配置文件:elasticsearch.yml,添加如下配置
-
vim /usr/local/elk/elasticsearch-7.13.4/config/elasticsearch.yml -

-
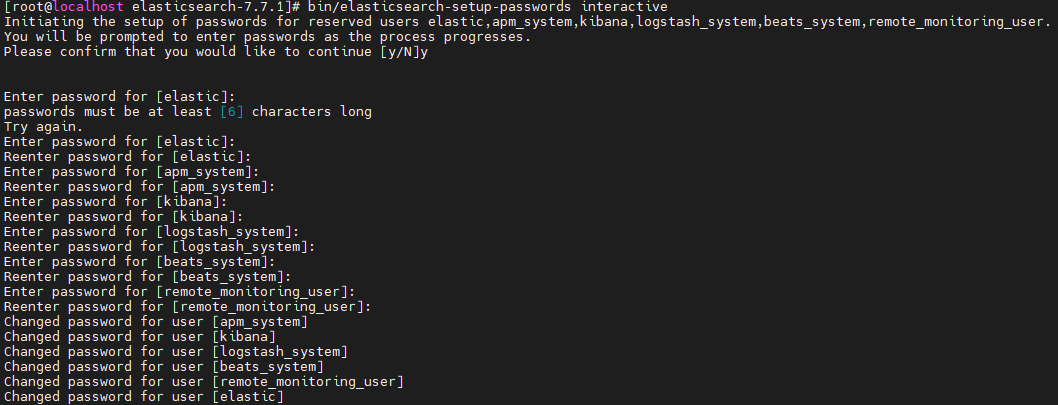
es的bin目录下,执行设置用户名和密码的命令
-
cd /usr/local/elk/elasticsearch-7.13.4/bin/;
./elasticsearch-setup-passwords interactive;
这里会设置六个账号的密码:
elastic,apm_system,kibana,logstash_system,beats_system,remote_monitoring_user.
修改kibana的配置kibana.yml:
vim /usr/local/elk/kibana-7.13.4/config/kibana.yml
重启es和kibana

为开发者提供学习成长、分享交流、生态实践、资源工具等服务,帮助开发者快速成长。
更多推荐


 0
0 0
0- 0


 已为社区贡献2条内容

所有评论(0)