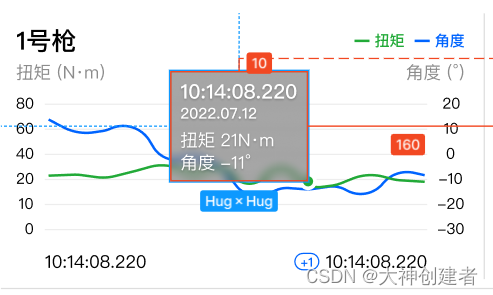
echarts图表 tooltip提示框,xAxis X轴,formatter自定义
实现echarts x轴自定义、悬浮框自定义、双y轴重叠问题
·
做项目时根据设计图用echarts来进行展现数据统计
设计图需要实现效果

根据设计图进行实现的代码、代码里也进行处理了双y轴不重叠问题
<template>

  <chart-item :option="optionBing" style-props="width: 378px;height: 212px;margin:10px 10px 0 0" />

</template>
<script>

import ChartItem from '@/components/ModChart'

export default {
  name: 'ChartAddUnlockStatistics',
  components: { ChartItem },
  props: {
    chartParams: {
      type: Object,
      default: () => {}
    }
  },
  data() {
    return {
      listdata: [],
      min1: '',
      min2: ''
    }
  },

  computed: {
    optionBing() {
      const timeData = JSON.parse(JSON.stringify(this.chartParams.timeData))
      // 获取当前扭转数值和角度数值的最小极值
      this.getNum()

      return {
        color: ['#22AA38', '#0064FF'],
        backgroundColor: '#fff',
        title: {
          text: this.chartParams.title
        },
        grid: {
          left: '15%',
          right: '20%',
          bottom: '15%'
        },
        tooltip: {
          backgroundColor: 'rgba(0, 0, 0, 0.4)',
          padding: [8, 8, 8, 8],
          trigger: 'axis',
          formatter(params) {
            // 先将时间进行拼接添加样式
            let str = `<span style="color: #FFFFFF;font-size: 16px;">${params[0].name}</span>` + '<br />' + `<span style="color: #FFFFFF;font-size: 12px;">${timeData[params[0].dataIndex].split(' ')[0]}</span>` + '<br />'

            // 对数据进行遍历设置好样式和时间进行拼接
            params.forEach((item, index) => {
              str += `<span style="color: #FFFFFF;font-size: 14px;">${item.seriesName + ' : ' + item.data}</span>` + `<span style="color: #FFFFFF;font-size: 14px;">${item.seriesName === '扭矩' ? 'N·m' : '°'}</span>` + '<br />'
            })
            return str
          },
          axisPointer: {
            type: 'cross',
            animation: false,
            label: {
              backgroundColor: 'rgba(0, 0, 0, 0.35)'
            }
          }
        },
        legend: {
          data: ['扭矩', '角度'],
          icon: 'rect',
          itemWidth: 20,
          itemHeight: 3.5,
          align: 'auto',
          right: 5
        },
        xAxis: [
          {
            type: 'category',
            boundaryGap: false,
            axisLine: { onZero: false },

            axisLabel: {
              interval: this.chartParams.timeData.length - 2,
              formatter: function(value, index) {
                // 获取当前x轴的数组长度
                const length = timeData.length
                // 获取当前数组第一条数据的年月日
                const timeDayOne = timeData[0].split(' ')[0]
                // 获取最后一条数据的年月日
                const timeDayTwo = timeData[length - 1].split(' ')[0]
                // 判断x轴数组第一个年月日是否和最后一个数据的年月日是否相同
                if (timeDayOne === timeDayTwo) {
                  return value
                } else {
                  // 当两者不相同时给最后一个年月日前添加 +1的标识
                  if (index === 0) {
                    return value
                  } else {
                    return '{a|+1}{b| }' + value
                  }
                }
              },
              // 设置+1标识的样式
              rich: {
                a: {
                  color: '#0064FF',
                  padding: [2, 4, 2, 4],
                  borderRadius: 5,
                  borderWidth: 1,
                  borderColor: '#0064FF',
                  align: 'center'
                },
                b: {
                  width: 10
                }
              }
            },
            data: timeData.map(function(str) {
              return str.split(' ')[1]
            })
          }
        ],
        yAxis: [
          {
            name: '扭矩 (N·m)',
            type: 'value',
            axisLine: {
              show: false,
              onZero: false
            },
            axisTick: {
              show: false
            },
            splitLine: {
              // show: false,
              lineStyle: {
                color: 'rgba(221, 217, 217, 1)'
              }
            },
            min: this.min1
          },
          {
            name: '角度 (°)',
            alignTicks: true,
            type: 'value',
            splitLine: {
              show: false,
              lineStyle: {
                color: 'rgba(221, 217, 217, 1)'
              }
            },
            axisLine: {
              show: false,
              onZero: false
            },
            axisTick: {
              show: false
            },
            min: this.min2
          }
        ],
        series: [
          {
            name: '扭矩',
            type: 'line',
            smooth: true,
            yAxisIndex: 0,
            data: this.chartParams.reverseData
          },
          {
            name: '角度',
            type: 'line',
            smooth: true,
            yAxisIndex: 1,
            data: this.chartParams.angleToData
          }
        ]
      }
    }
  },

  methods: {
    getNum() {
      // 理想行数(实际行数会有浮动)
      const rowNum = 6
      const data1 = this.chartParams.reverseData
      const data2 = this.chartParams.angleToData
      /* 数据极值
      *   max1 扭矩最大值
      *   max2 角度的最大值
      *   min1 扭矩的最小值
      *   min2 角度的最小值
      * */
      const max1 = Math.max(...data1)
      const max2 = Math.max(...data2)
      let min1 = Math.min(...data1)
      let min2 = Math.min(...data2)

      /* 极值比例*/
      const rat1 = min1 / max1
      const rat2 = min2 / max2

      /* 比例大小对比*/
      const ratState = rat1 > rat2
      /* 设置极小值*/
      if (ratState) {
        min1 = rat2 * max1
      } else {
        min2 = rat1 * max2
      }
      /*
      * inter1 扭矩的行高取整
      * inter2 角度的行高取整
      * */
      const inter1 = Math.ceil((max1 - min1) / rowNum)
      const inter2 = Math.ceil((max2 - min2) / rowNum)

      /* 对极值微调*/
      this.min1 = Math.floor(min1 / inter1) * inter1
      this.min2 = Math.floor(min2 / inter2) * inter2
    }
  }
}
</script>

<style lang="scss">
.unlockStyle{
  display: flex;
  flex-wrap: wrap;
}
</style>
更多推荐
 已为社区贡献1条内容


所有评论(0)