echart折线/柱状虚线设置
·
需求:
在未来月份折线图柱状图用虚线表示
图示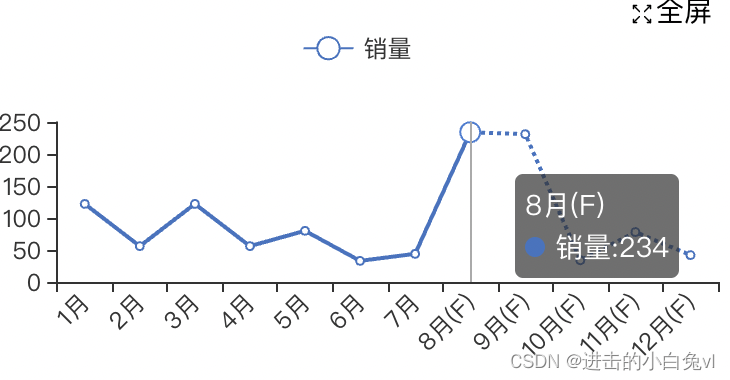
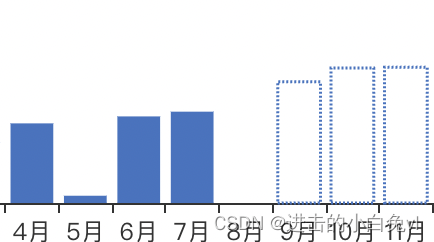
注意点:图例会重合,所以图例需要再处理中,折线图series中叠加一条实线,柱状图 在data中添加样式
代码
methods中
 let end = new Date().getMonth();//当前月份
      let arr = ["122","56","122", "56","80","33", "44","234","231", "34","78", "42", ];
      //series
  (this.series = [
        {
          name: "销量",
          type: "line",
          data: arr.slice(0, end + 1),
          itemStyle: {
            normal: {
              color: "#3c74c2",
              lineStyle: {
                color: "#3c74c2",
              },
            },
          },
        },
        {
          name: "销量",
          type: "line",
          data: arr,
          smooth: false, //关键点,为true是不支持虚线,实线就用true
          itemStyle: {
            normal: {
              color: "#3c74c2",
              lineStyle: {
                color: "#3c74c2",
                type: "dotted",//'dotted'虚线 'solid'实线
              },
            },
          },
        },
      ]),
 tooltip: {
        trigger: "axis",
        formatter: function (params) {
          var valMap = {};
          let html = params[0].name + "<br>";
          for (let i = 0; i < params.length; i++) {
            //过滤无效值
            if (params[i].value == "--") {
              continue;
            }
            //过滤重叠值
            if (valMap[params[i].seriesName] == params[i].value) {
              continue;
            }
            let value = "";
            valMap[params[i].seriesName] = params[i].value;
            if (
              params[i].value > 0 ||
              params[i].value == 0 ||
              params[i].value < 0
            ) {
              value = (params[i].value + "").replace(
                /(\d{1,3})(?=(\d{3})+(?:$|\.))/g,
                "$1,"
              ); //千分号表示;
            } else {
              value = "-";
            }
            html +=
              '<span  style="display:inline-block;margin-right:5px;border-radius:10px;width:10px;height:10px;background-color:' +
              params[i].color +
              ';"></span>';
            html += params[i].seriesName + ":" + value + "<br>";
          }
          return '<div style="text-align:left">' + html + "</div>";
        },
      },
柱状图
 let end = new Date().getMonth();//当前月份
 let arr = ["122","56","122", "56","80","33", "44","234","231", "34","78", "42", ];
 arr.forEach((value, index) => {
                      if (index > end) {
                        arr[index] = {
                          value: arr[index],
                          itemStyle: {
                            borderColor: "#3c74c2",
                            borderWidth: 1.5,
                            borderType: "dotted",//虚线
                            color: "#FFFFFF",
                          },
                        };
                      }
                    }),
                      this.serieSale.push({
                        name: "11",
                        type: "bar",
                        data: arr,
                        itemStyle: {
                          normal: {
                            color:  "#3c74c2",
                            lineStyle: {
                              color:  "#3c74c2",
                            },
                          },
                        },
                      });
                      //也需要处理tooltip重叠问题
X轴完全显示
    xAxis{axisLabel: {
          interval: 0, //代表显示所有x轴标签显示
          rotate: 45, //代表逆时针旋转45度
        },
        data: [],}

华为开发者空间,是为全球开发者打造的专属开发空间,汇聚了华为优质开发资源及工具,致力于让每一位开发者拥有一台云主机,基于华为根生态开发、创新。
更多推荐

 1
1 0
0- 0


 已为社区贡献1条内容

所有评论(0)