Echarts-数据可视化legend图例属性设置
//Echarts数据可视化legend图例属性设置legend={show:true,//是否显示zlevel:0,//所属图形的Canvas分层,zlevel 大的 Canvas 会放在 zlevel 小的 Canvas 的上面z:2,//所属组件的z分层
·
//Echarts数据可视化legend图例属性设置
legend={
    show:true,                                  //是否显示
    zlevel:0,                                   //所属图形的Canvas分层,zlevel 大的 Canvas 会放在 zlevel 小的 Canvas 的上面
    z:2,                                         //所属组件的z分层,z值小的图形会被z值大的图形覆盖
    left:"center",                              //组件离容器左侧的距离,'left', 'center', 'right','20%'
    top:"top",                                   //组件离容器上侧的距离,'top', 'middle', 'bottom','20%'
    right:"auto",                               //组件离容器右侧的距离,'20%'
    bottom:"auto",                              //组件离容器下侧的距离,'20%'
    width:"auto",                               //图例宽度
    height:"auto",                              //图例高度
    orient:"horizontal",                        //图例排列方向
    align:"auto",                               //图例标记和文本的对齐,left,right
    padding:5,                                   //图例内边距,单位px  5  [5, 10]  [5,10,5,10]
    itemGap:10,                                  //图例每项之间的间隔
    itemWidth:25,                               //图例标记的图形宽度
    itemHeight:14,                              //图例标记的图形高度
    formatter:function (name) {                 //用来格式化图例文本,支持字符串模板和回调函数两种形式。模板变量为图例名称 {name}
        return 'Legend ' + name;
    },
    formatter: function(name){
        return name.length>12?name.substr(0,12)+"...":name;
  },													//legend文字超出宽度显示省略号
    selectedMode:"single",                    //图例选择的模式,true开启,false关闭,single单选,multiple多选
    inactiveColor:"#ccc",                     //图例关闭时的颜色
    textStyle:mytextStyle,                    //文本样式
    data:['类别1', '类别2', '类别3'],          //series中根据名称区分
    backgroundColor:"transparent",            //标题背景色
    borderColor:"#ccc",                         //边框颜色
    borderWidth:0,                               //边框线宽
    shadowColor:"red",                          //阴影颜色
    shadowOffsetX:0,                            //阴影水平方向上的偏移距离
    shadowOffsetY:0,                            //阴影垂直方向上的偏移距离
    shadowBlur:10,                               //阴影的模糊大小
};
const option = {
'grid': {
'top': '40',
'left': '0',
'bottom': '5%',
'right': '0',
'containLabel': true
},
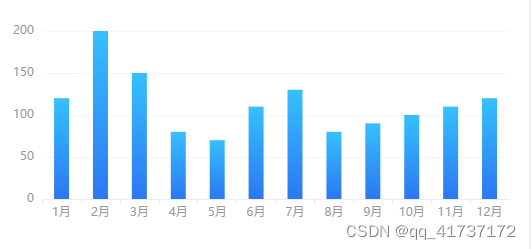
xAxis: {
type: 'category',
data: ['1月', '2月', '3月', '4月', '5月', '6月', '7月', '8月', '9月', '10月', '11月', '12月'],
axisLine: {
show: false,
},
axisLabel: {//y轴文字的配置
textStyle: {
color: "#999",//Y轴内容文字颜色
},
},
axisLine: {//y轴线的配置
show: true,//是否展示
lineStyle: {
color: "#ECEDF0",//y轴线的颜色(若只设置了y轴线的颜色,未设置y轴文字的颜色,则y轴文字会默认跟设置的y轴线颜色一致)
width: 1,//y轴线的宽度
type: "solid"//y轴线为实线
},
},
},
yAxis: {
type: 'value',
axisLine: {
show: false,
},
axisLabel: {//y轴文字的配置
textStyle: {
color: "#999",//Y轴内容文字颜色
},
},
axisLine: {//y轴线的配置
show: true,//是否展示
lineStyle: {
color: "#fff",//y轴线的颜色(若只设置了y轴线的颜色,未设置y轴文字的颜色,则y轴文字会默认跟设置的y轴线颜色一致)
width: 1,//y轴线的宽度
type: "solid"//y轴线为实线
},
},
splitLine: {//分割线配置
show: true,
lineStyle: {
color: "#f5f5f5",
},
},
},
series: [
{
data: [120, 200, 150, 80, 70, 110, 130, 80, 90, 100, 110, 120],
type: 'bar',
barWidth: 15,
color: new this.$echarts.graphic.LinearGradient(0, 0, 0, 1,
[
{ offset: 0, color: "#35c0fd" },
{ offset: 1, color: "#2c77f3" }
],
false
) // 渐变
}
]
}

为开发者提供学习成长、分享交流、生态实践、资源工具等服务,帮助开发者快速成长。
更多推荐


 2
2 0
0- 0


 已为社区贡献3条内容

所有评论(0)