echarts柱状图 双柱状图基本用法
echarts柱状图 双柱状图基本用法
·
内容有点多,慢慢看哦!废话不多说,上代码
如果想要把横向变成竖向的话就把xAxis和yAxis的内容交换一下就好啦
首先定义一个盒子,设置大小
<style>
    .box{
        width: 50%;
        height: 500px;
        margin: 0 auto;
    }
</style>

<body>
    <div class="box" id="echart"></div>
</body
引入提前下载好的echarts文件
<head>
            这里我是放在head标签里面的,你们可以试试放到其他地方
    <script type="text/javascript" src="./jquery.js"></script>

</head>

<script type="text/javascript" src="./area_echarts.js"></script>
<script type="text/javascript" src="./echarts.min.js"></script>
下面就是echarts代码
<script>
echarts_1()
function echarts_1() {
var myChart = echarts.init(document.getElementById('echart'));
option = {
calculable: true,
legend: {
// 指示框名字 注意!要和下方series中的name一起改
data: ['女', '男'],
// 指示框位置 距离上下左右多少
right: '5%',
// top: '50%',
textStyle: {
color: '#4F4F4F' //字体颜色
}
},
xAxis: [
{
type: 'category',
data: ['2018', '2019', '2020', '2021', '2022'],
axisLine: { //x轴线的颜色以及宽度
show: true, //是否显示X轴
lineStyle: {
color: "#4F4F4F",
}
},
axisLabel: {
// interval: 0, //间隔几条显示
// rotate: 20, // 切斜度数
// fontSize: 10, //字体大小
},
axisTick: {
//是否显示刻度线
show: false
},
}
],
yAxis: [
{
type: 'value',
axisTick: {
//y轴刻度线
show: false
},
axisLine: {
show: false, // Y轴
lineStyle: {
color: "#4F4F4F",
}
},
splitLine: { // 表格里面Y轴线条
show: true,
lineStyle: {
type: 'dashed', //虚线
color: '#04072F' //虚线颜色
}
}
}
],
// 整体大小
grid: {
left: '3%',
right: '4%',
top: '10%',
bottom: '5%',
containLabel: true
},
series: [
{
barWidth: 12,//柱子宽度
name: '女',
type: 'bar',
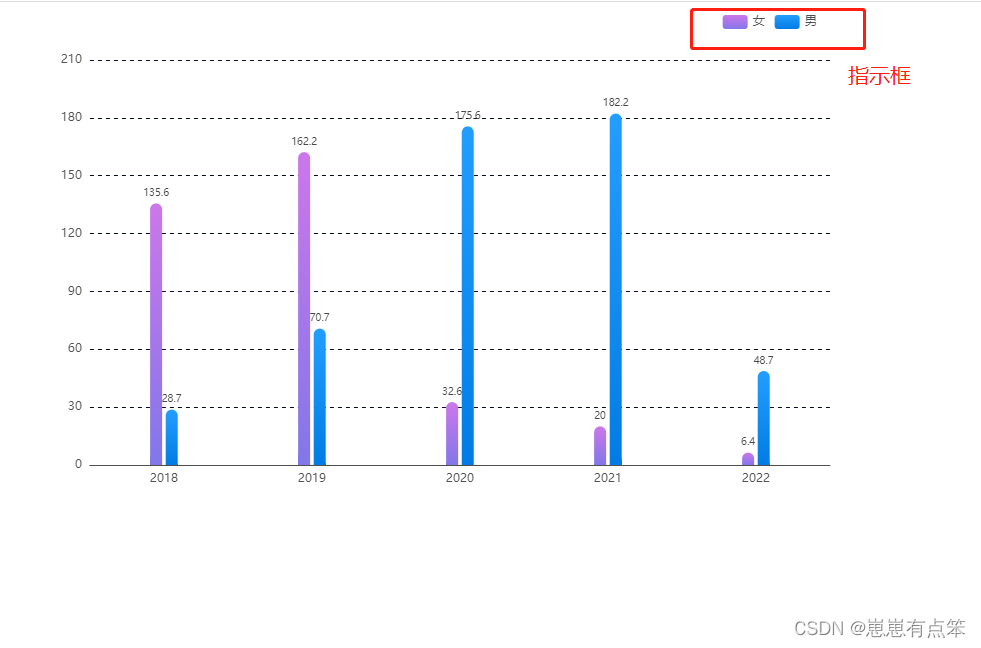
data: [
135.6, 162.2, 32.6, 20.0, 6.4
],
itemStyle: {
//颜色样式部分
normal: {
barBorderRadius: [20, 20, 0, 0], //圆角[上左,上右,下右,下左]
label: {
show: true, //开启数字显示
position: 'top', //在上方显示数字
textStyle: { //数值样式
color: '#474646', //字体颜色
fontSize: 10 //字体大小
}
},
// 柱状图颜色渐变
color: new echarts.graphic.LinearGradient(0, 1, 0, 0, [
{ offset: 0, color: "#8277E9" },
{ offset: 1, color: "#CC77E9" },
]),
}
}
},
{
barWidth: 12,//柱子宽度
name: '男',
type: 'bar',
data: [
28.7, 70.7, 175.6, 182.2, 48.7
],
itemStyle: {
//颜色样式部分
normal: {
barBorderRadius: [20, 20, 0, 0], //圆角[上左,上右,下右,下左]
label: {
show: true, //开启数字显示
position: 'top', //在上方显示数字
textStyle: { //数值样式
color: '#474646', //字体颜色
fontSize: 10 //字体大小
}
},
// 柱状图颜色渐变
color: new echarts.graphic.LinearGradient(0, 1, 0, 0, [
{ offset: 0, color: "#017CE4" },
{ offset: 1, color: "#249EFD" },
]),
}
}
}
]
};
// 使用刚指定的配置项和数据显示图表。
myChart.setOption(option);
window.addEventListener("resize", function () {
myChart.resize();
})
}
</script>这里有注意的详细看法

最终内容
 okk,有不足欢迎补充啊

为开发者提供学习成长、分享交流、生态实践、资源工具等服务,帮助开发者快速成长。
更多推荐


 7
7 0
0- 0


 已为社区贡献1条内容

所有评论(0)