vosviewer入门-分析web of science
vosviewer入门-分析web of science文章目录vosviewer入门-分析web of science1.web of science检索文献2.vosviewer创建图1.web of science检索文献内容是这样的,2.vosviewer创建图1.加载界面2.点击create3.选择数据类型4.悬选择数据源5.选择文件6.选择域7.选择连续的方法8.设置阈值9.选择成员的
·
vosviewer入门-分析web of science
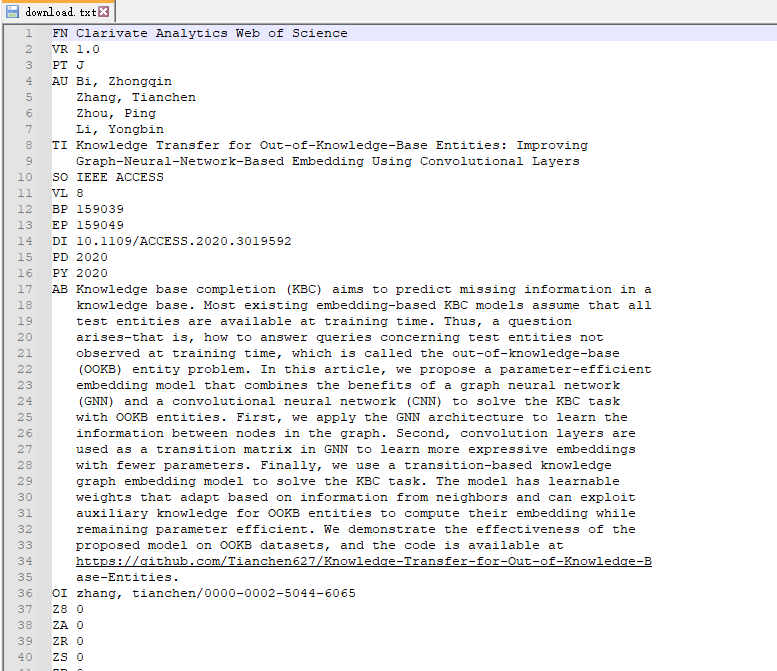
1.web of science检索文献
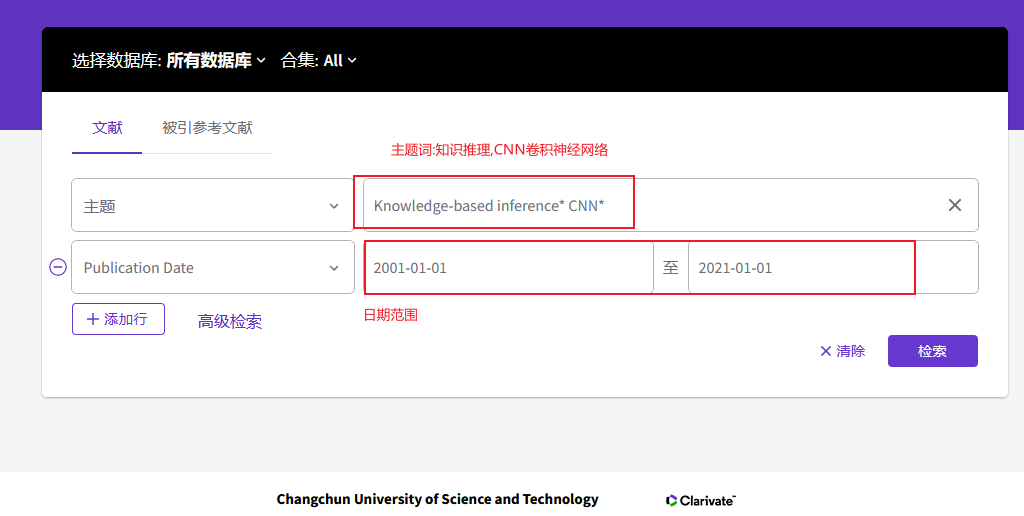
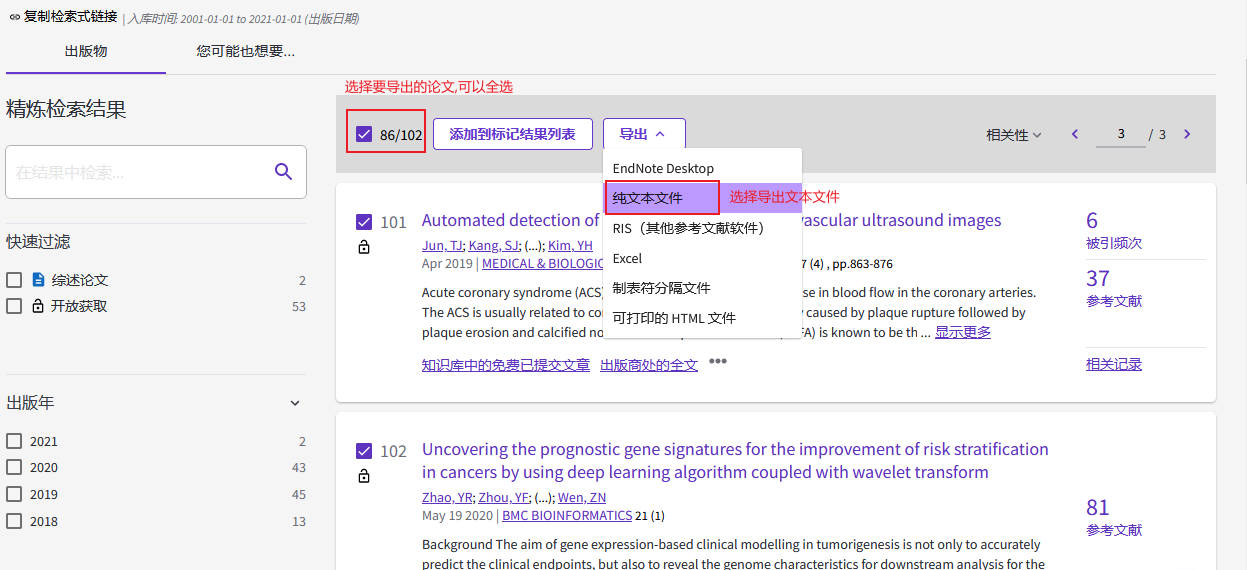
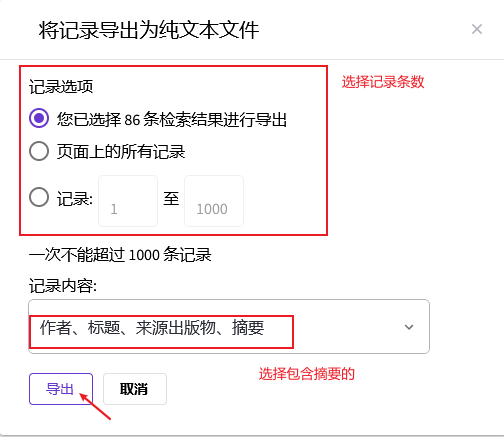
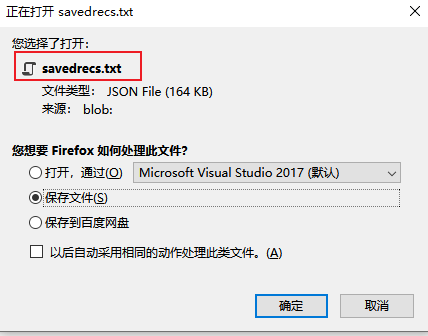
内容是这样的,
2.vosviewer创建图
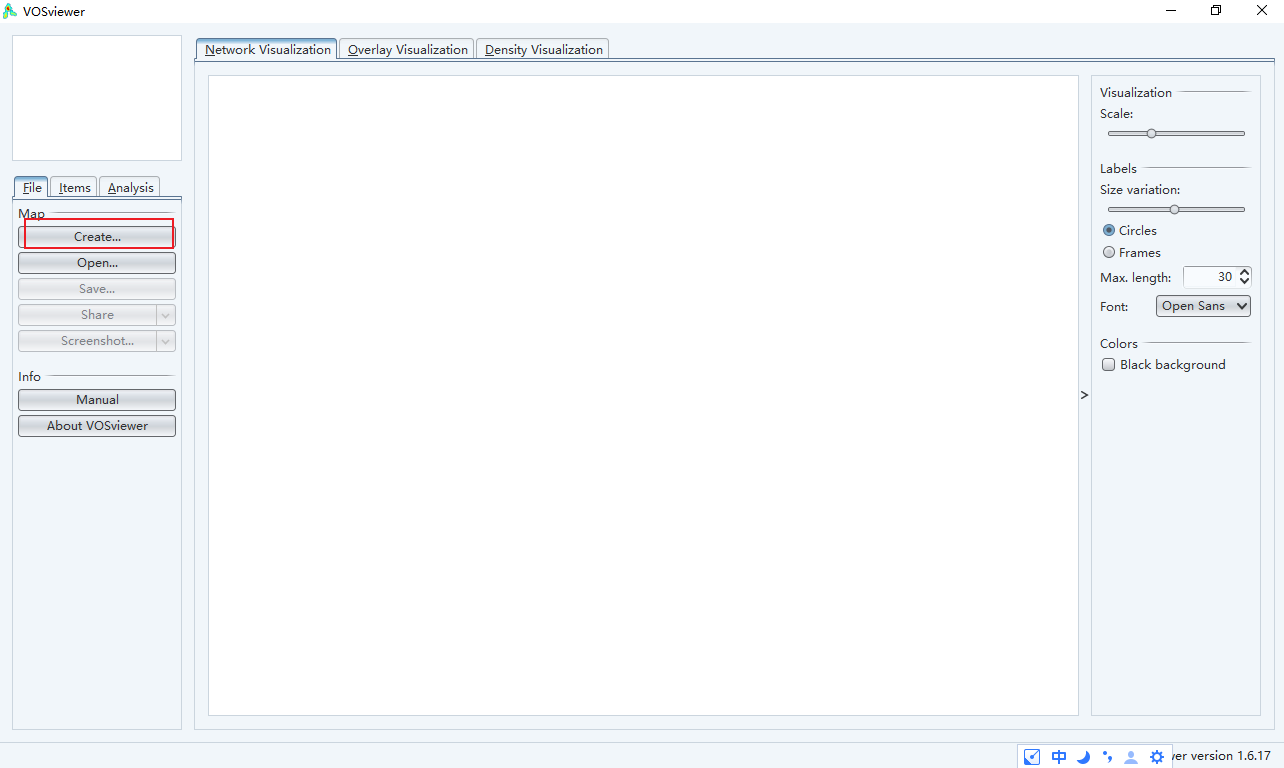
1.加载界面

2.点击create
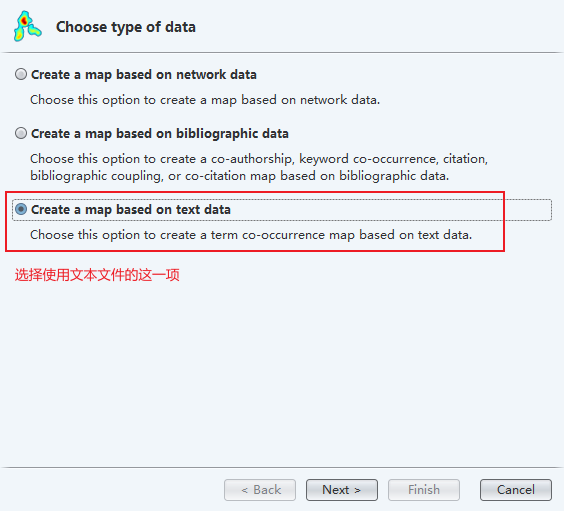
3.选择数据类型
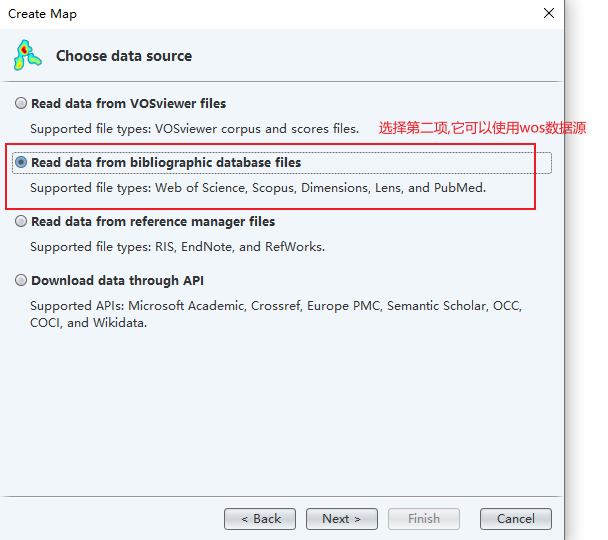
4.选择数据源
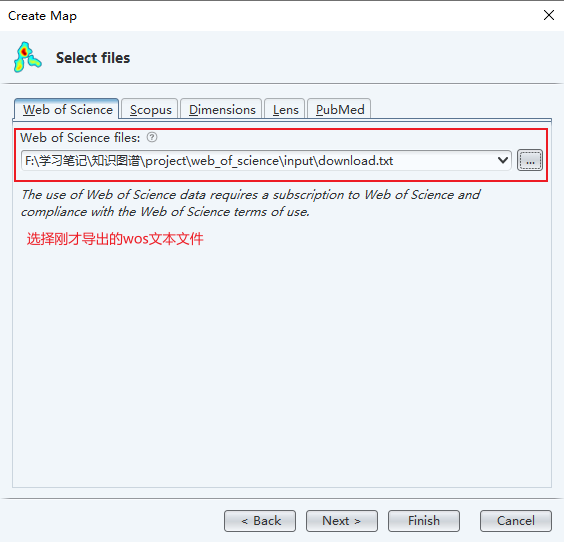
5.选择文件
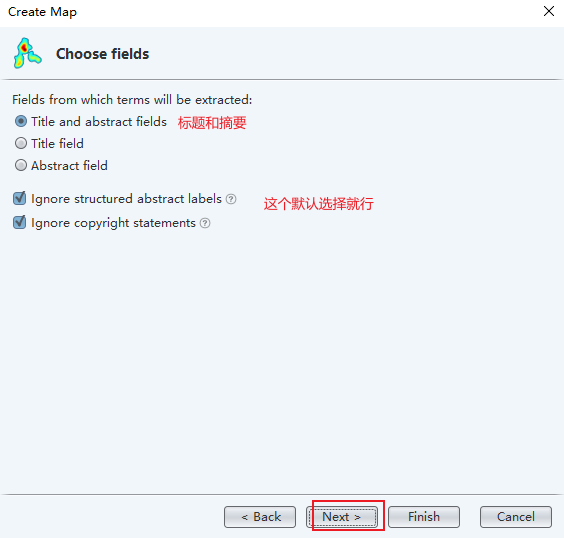
6.选择域
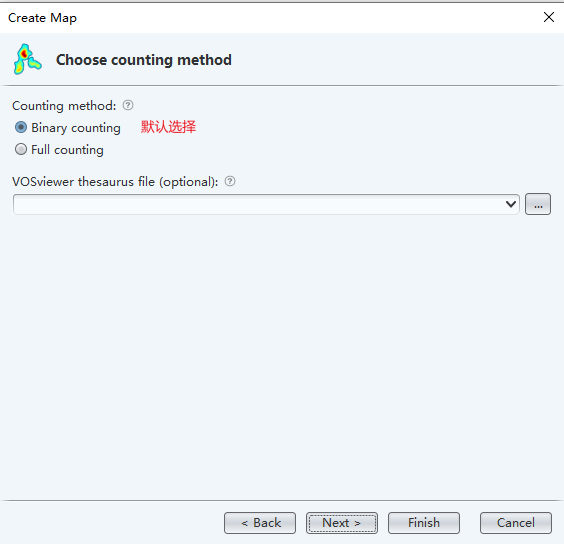
7.选择连续的方法
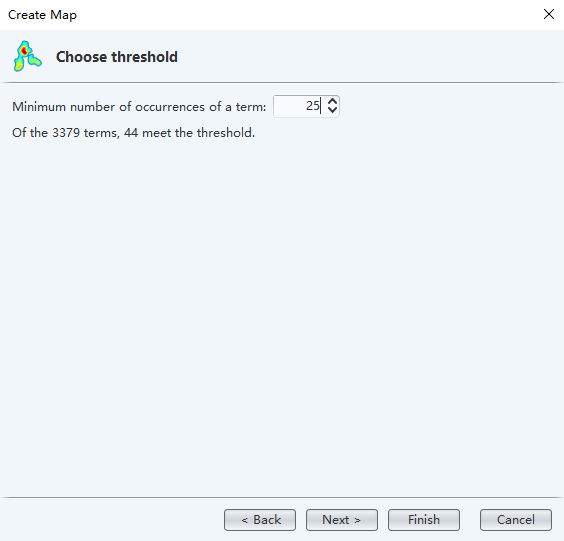
8.设置阈值
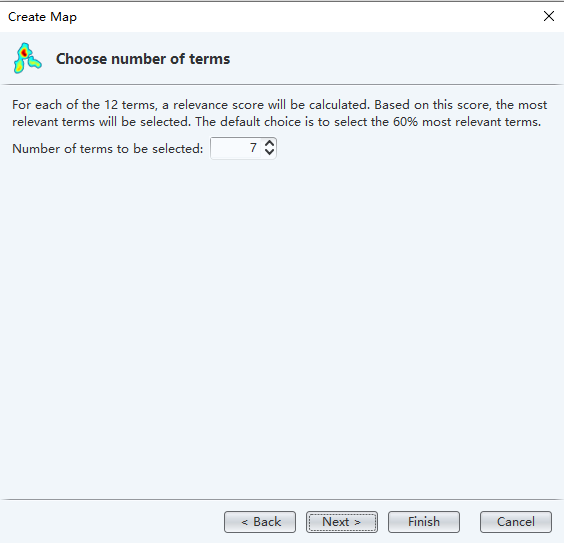
9.选择成员的数量
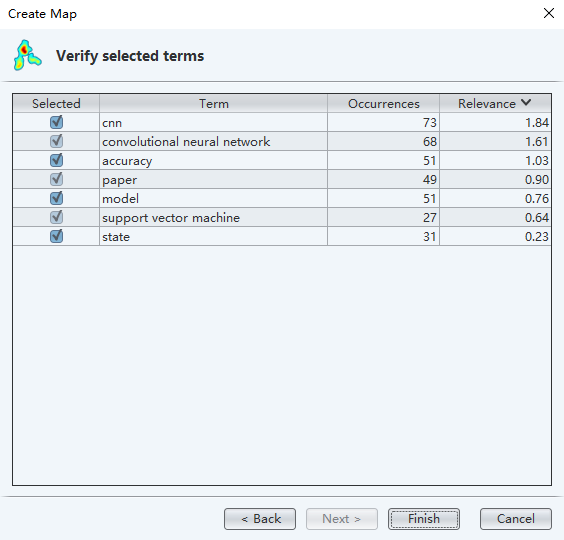
10.确认选择的成员
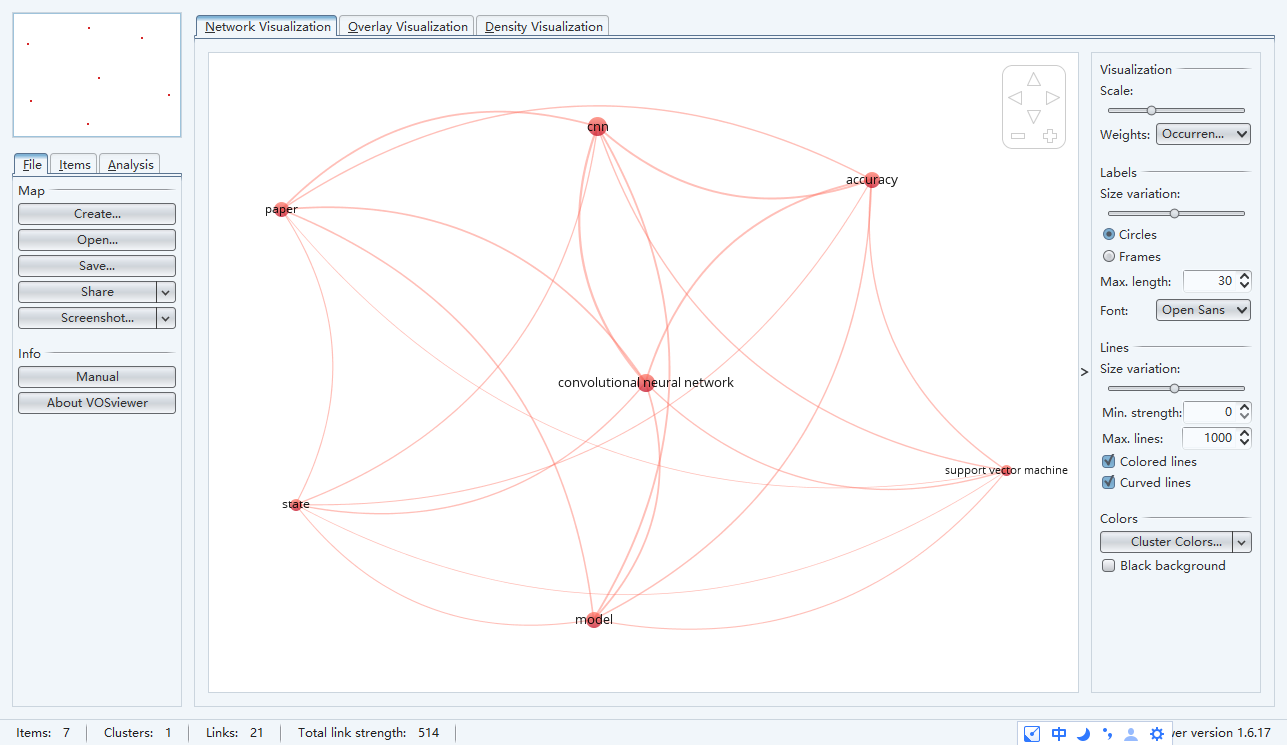
11.在阈值=25的情况下展示的图谱
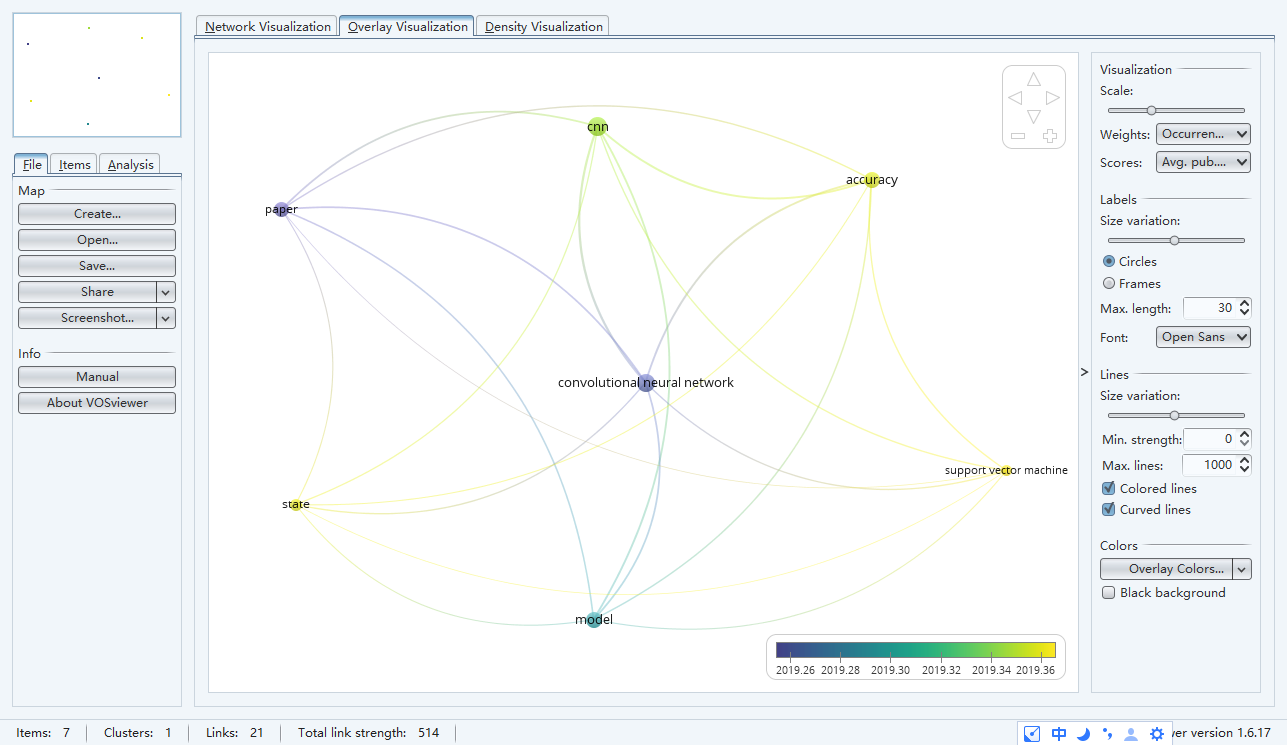
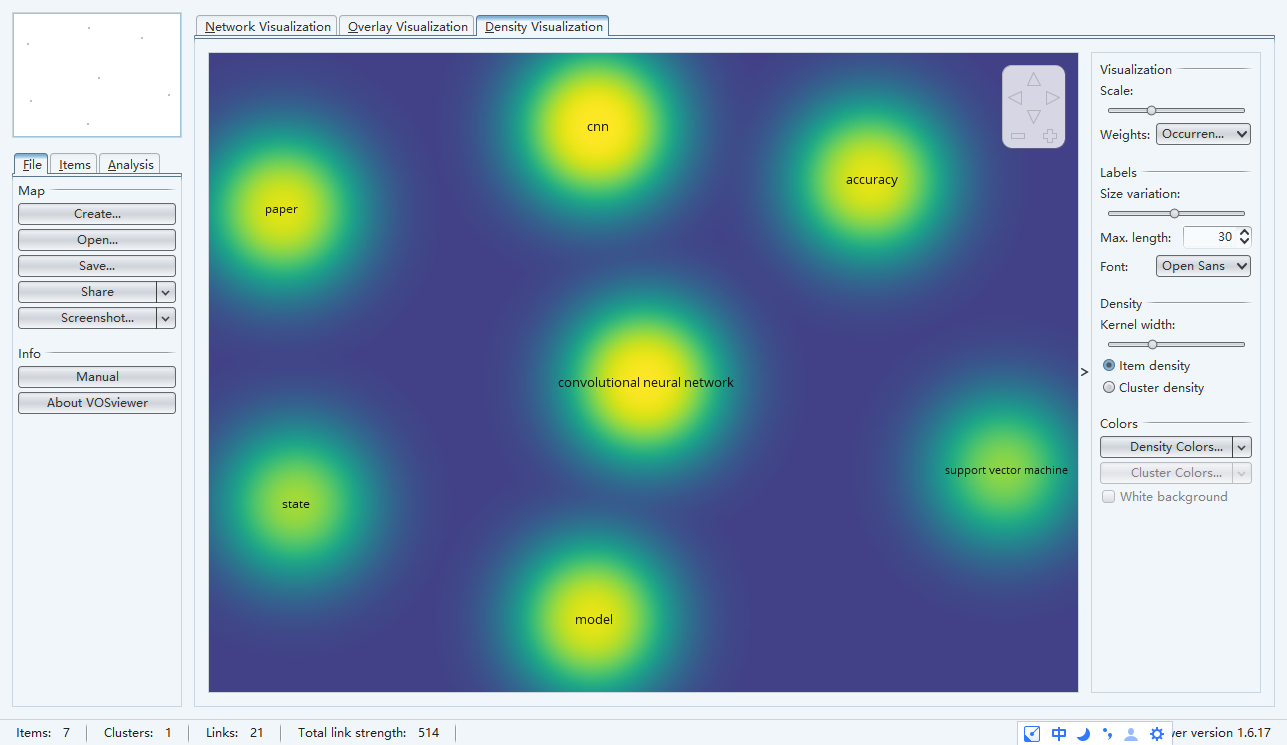
12.可以保存图谱文件
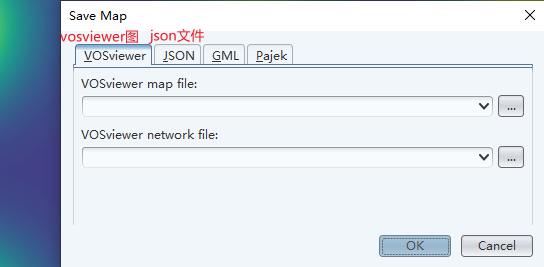
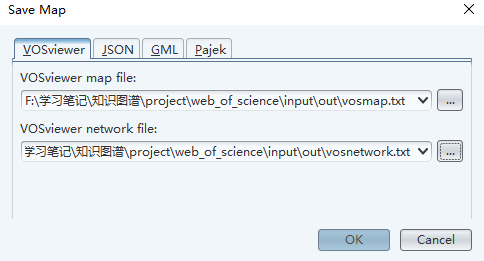
vosmap.txt
id	label	x	y	cluster	weight<Links>	weight<Total link strength>	weight<Occurrences>	score<Avg. pub. year>	score<Avg. citations>	score<Avg. norm. citations>
1	accuracy	0.5894	0.4024	1	6	161	51	2019.3529	10.8235	0.8574
2	cnn	-0.0359	0.5239	1	6	210	73	2019.3425	11.5616	0.9039
3	convolutional neural network	0.0736	-0.0599	1	6	202	68	2019.2647	13.3676	0.9867
4	model	-0.0448	-0.6014	1	6	151	51	2019.2941	15.8039	1.2059
5	paper	-0.7546	0.3334	1	6	135	49	2019.1837	16.8571	1.2508
6	state	-0.7241	-0.3377	1	6	82	31	2019.3548	15.2258	1.1097
7	support vector machine	0.8963	-0.2609	1	6	87	27	2019.3704	14.4444	1.1234
vosnetwork.txt
1	2	42
1	3	41
1	4	24
1	5	22
1	6	12
1	7	20
2	3	55
2	4	39
2	5	35
2	6	18
2	7	21
3	4	35
3	5	31
3	6	20
3	7	20
4	5	27
4	6	12
4	7	14
5	6	14
5	7	6
6	7	6

为开发者提供学习成长、分享交流、生态实践、资源工具等服务,帮助开发者快速成长。
更多推荐


 9
9 0
0- 0


 已为社区贡献1条内容

所有评论(0)