Echarts折线图的tooltip样式,背景,位置,折线颜色渐变(自定义样式)
效果图//24小时发车趋势图var trend = document.getElementById('fachetrend')var trenddata = [['06:00', '07:00', '08:00', '09:00', '10:00', '11:00', '12:00', '13:00', '14:00', '15:00', '16:00', '17:00'],[5, 40, 30,
·
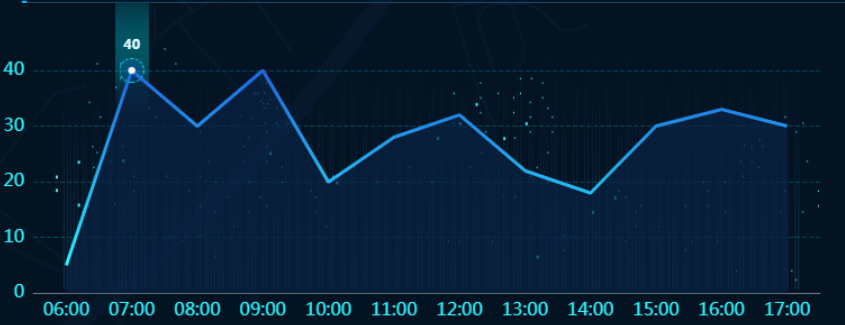
效果图


//24小时发车趋势图

var trend = document.getElementById('fachetrend')
var trenddata = [['06:00', '07:00', '08:00', '09:00', '10:00', '11:00', '12:00', '13:00', '14:00', '15:00', '16:00', '17:00'],
[5, 40, 30, 40, 20, 28, 32, 22, 18, 30, 33, 30]]
function trendchart(dom, data) {


  var trendchart = echarts.init(dom)

  var optiontrend = {
    tooltip: {
      trigger: 'axis',
      showContent: false,//关闭原有样式
      axisPointer: {
        type: 'none'
      }
    },
    grid: { //调整地图位置
      left: '3%',
      right: '4%',
      bottom: '3%',
      containLabel: true
    },
    xAxis: { //横坐标样式
      axisTick: {
        show: false
      },
      axisLabel: {
        textStyle: {
          color: '#2cf4fd',
          fontSize: 16,
        }
      },
      data: data[0]
    },
    yAxis: { //纵坐标样式
      splitLine: {
        show: true,
        lineStyle: {
          type: 'dashed',
          color: 'rgba(0, 188, 208,0.3)'
        }
      },
      axisLabel: {
        textStyle: {
          color: '#2cf4fd',
          fontSize: 16,
        }
      },
    },
    graphic: [ //地图的背景  这里放的是图片,也可以是纯颜色背景
      {
        type: 'image',
        style: {
          image: '../img/bgimg/24bghour.png',
          x: 70,
          y: 35,
          width: 680,
          height: 220
        }
      }
    ],
    series: [
      {
        name: '数量',
        type: 'line',
        areaStyle: { //折线区域颜色
          color: '#091f3e',
        },
        symbol: 'image://../img/bgimg/circle.png',
        symbolSize: 20,
        showSymbol: false,
        itemStyle: {
          normal: {
            lineStyle: {
              color: new echarts.graphic.LinearGradient(0, 0, 0, 1, [					//设置折线渐变色
                { offset: 0, color: "#1e66e1" },
                { offset: 1, color: "#2cf4fd" }
              ])
            }
          }
        },
        label: { //鼠标放上去显示数值
          show: true,
          color: '#d9fcff',
          fontWeight: 'bold',
          offset: [0, -6],
          align: 'center',
          verticalAlign: 'middle',
          backgroundColor: { //设置为图片
            image: '../img/bgimg/zhexiansh.png'
          },
          width: 30,
          height: 130,
        },
        data: data[1]
      }
    ]
  };
  trendchart.setOption(optiontrend);
}
trendchart(trend, trenddata)

为开发者提供学习成长、分享交流、生态实践、资源工具等服务,帮助开发者快速成长。
更多推荐


 3
3 0
0- 0


 已为社区贡献2条内容

所有评论(0)