前端导出excel
Excel
·
- 背景
在做前端需求中通常遇到将表格作为excel导出,或者将excel文件上传到浏览器页面中进行展示,以前还没遇到过这种情况,都是后端将数据生成文档,前端直接导出文件。现在将这个功能整理下,方便后续借鉴。 - excel文件尾缀有
- .xls(excel97-2003版,可以有宏,可以用记事本打开,为html格式,有css样式,支持多个多个sheet页)
- .xlsx(excel2007-2016版默认的文件格式,不能有宏,底层是xml形式存储,可以用压缩包打开)
- .cvs(以逗号分隔的文本文件,便于兼容其他程序,只保存活动工作表。一个逗号会是一个单元格,单元格里有逗号时会将单元格数据用引号括起来,只支持一个sheet页签)
- .xlsm(启动宏的工作簿)
- .pdf:可移植文档格式,不能轻易修改文件中的数据
- js原生导出
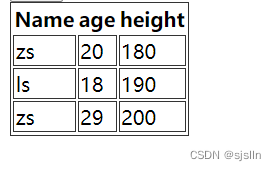
.xls导出:可以将数据拼接为html字符串,然后进行导出
  <table id="tableContainer">
    <tr>
      <th>Name</th>
      <th>age</th>
      <th>height</th>
    </tr>
    <tr>
      <td>zs</td>
      <td>20</td>
      <td>180</td>
    </tr>
    <tr>
      <td>ls</td>
      <td>18</td>
      <td>190</td>
    </tr>
    <tr>
      <td>zs</td>
      <td>29</td>
      <td>200</td>
    </tr>
  </table>
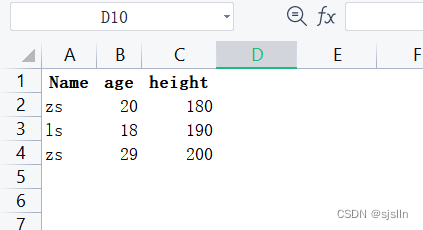
const table = document.getElementById('tableContainer');
    const tableHTML = table.outerHTML.replace(/ /g, "%20");
    const url = `data:application/vnd.ms-excel,
            <html>
            <body>${tableHTML}
            </body>
            </html>`;
    // 新窗口需要载入的 url 地址。strUrl可以是 web 上的 html 页面也可以是图片文件或者其他任何浏览器支持的文件格式。
    const otherWindow = window.open(url)
    otherWindow.opener = null;
    otherWindow.location = url;
前端插件
- xlsx.js
- ejs-excel
- exceljs
- jquery.table2excel.js
根据以上背景可以想象将页面导出为excel文件
- 构建html
- 页面中的标签可以作为一个个的表格框,html中包含文字及图片(我用的是echarts画图)
刚开始是想着将页面图片转为Blob流,后面做着就放弃了,因为内容过多的话,流拼接就不会了。这里直接将canvas转为base64的地址,然后用字符串拼接去搞
先绘制页面图表,在这里直接使用echarts官网demo数据详见地址,这里只举例其中一部分
let myChart = echarts.init(document.getElementById("echartsContainer"));
option = copyOption;
myChart.setOption(option);
因为想着拼接table内容,excel支持img图片,就想着将他转为base64图片
imgURL = myChart.getDataURL({
  pixelRatio: 2,
  backgroundColor: '#fff'
});
将html转为Blob流,这里使用文件扩展名为.xls(application/vnd.ms-excel),常见文件扩展名类型表
// 表格表头,加入两列,十行
const imgWidth = 400;
const imgHeigth = 400;
const headerHeight = 100;
const indexWidth = 40;
let tableHTML = `<table border="1">
                  <tr style="font-size:16px;font-weight:bold;">
                    <th width="${indexWidth}" height="${headerHeight}">Index</th>
                    <th width="${imgWidth}" height="${headerHeight}">对应图片</th>
                  </tr>`;
/*
这里循环遍历,每行加入tr标签,每个单元格加td标签
*/
for (let i = 0; i < 1; i++) {
  // 10行数据
  tableHTML += `<tr>`;
  // 两列对应的内容拼接,增加\t为了不让表格显示科学计数法或者其他格式
  tableHTML += `<td>${i}\t</td>
   <td><img width="${imgWidth}" height="${imgHeigth}" src="${imgURL}">\t</td>`;
  tableHTML += '</tr>';
}
tableHTML += '</table>';
let containerHtml = '<html><head><meta charset="UTF-8"></head><body>';
containerHtml += tableHTML;
containerHtml += '</body></html>';
// 转为流
let excelBlob = new Blob([containerHtml], {
  type: 'application/vnd.ms-excel'
});
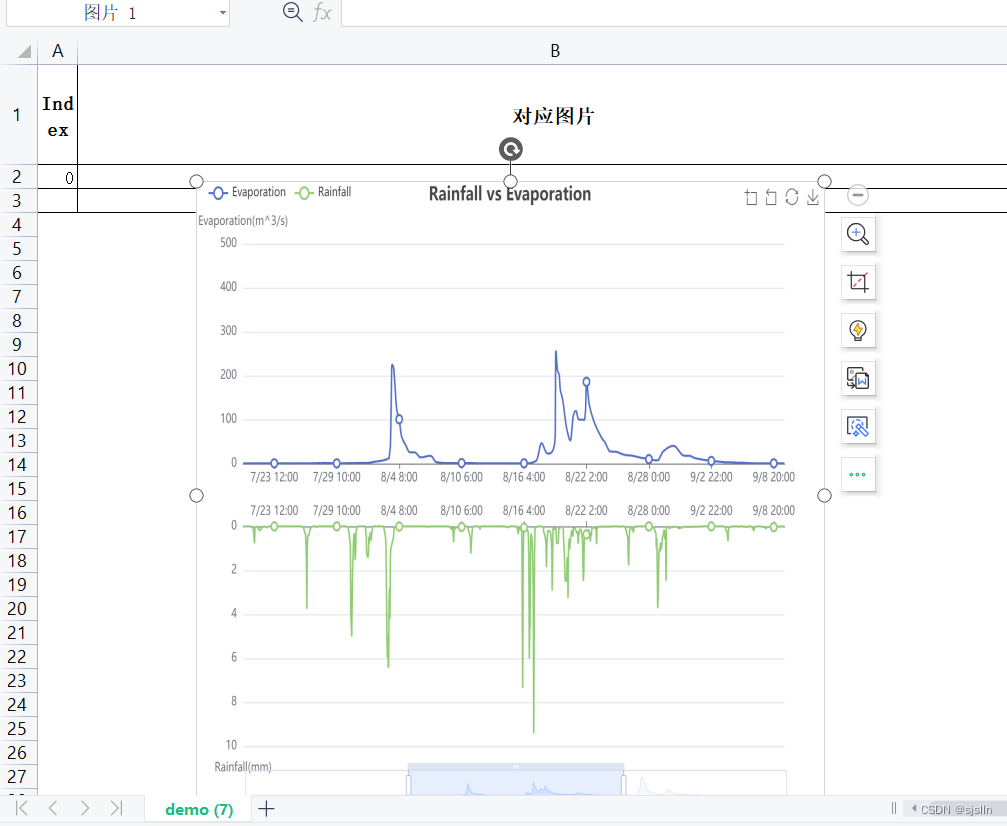
导出文件,这里导出图片折线图,有部分没数据,根本原因是渲染图表时有个动画配置默认是true(option.animation = true;),导致在canvas渲染过程中将canvas转为图片,这时候图表还没渲染完成,就会导致页面数据丢失,从而使导出表格中的图标显示不全,在这里可以
- 将默认参数修改为false(option.animation = false;),
- 简单粗暴的方式是根据动画时长来执行setTimeout延迟执行
- 使用 ECharts 提供的rendered事件来判断 ECharts 已经动画结束停止了渲染
function onRendered() {
  const dataUrl = chart.getDataURL();
  // 后续如果有交互,交互发生重绘也会触发该事件,因此使用完就需要移除
  chart.off('rendered', onRendered);
}
chart.on('rendered', onRendered);
- 也可以将生成的echarts实例作为一个全局变量,当鼠标点击下载时将canvas转为图片
这样导出的图表就完整了
官网也给出了具体的解决方法
页面渲染图片为

导出的excel内容为
const fileName = "demo.xls";
// 創建一个a标签
const aEle = document.createElement('a');
// 利用URL.createObjectURL()方法为a元素生成blob URL
aEle.href = URL.createObjectURL(excelBlob);
aEle.download = fileName;
aEle.click();
中间的折腾,将图片转为BLob流
// 图片转blob对象
const arr = imgURL.split(',');
mime = arr[0].match(/:(.*?);/)[1];
bstr = atob(arr[1])
n = bstr.length;
u8arr = new Uint8Array(n);
while (n--) {
  u8arr[n] = bstr.charCodeAt(n);
}
const blob = new Blob([u8arr], {
  type: mime
});
- 导出文件
- 利用a标签的download 属性
```javascript
let link = document.createElement("a");
link.href = href; // href包含文件名,链接等
link.download = href;
document.body.appendChild(link);
link.click();
document.body.removeChild(link);

为开发者提供学习成长、分享交流、生态实践、资源工具等服务,帮助开发者快速成长。
更多推荐


 1
1 0
0- 0


 已为社区贡献2条内容

所有评论(0)