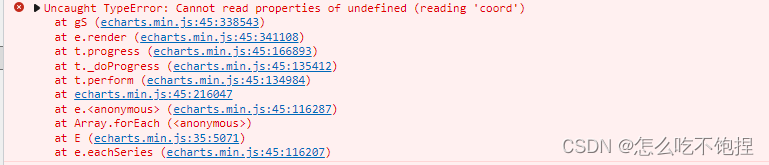
echarts 报错Cannot read properties of undefined (reading ‘coord‘)
解决echarts报错Cannot read properties of undefined (reading 'coord')
由于项目需要,我使用了echarts的北京AQI可视化图,即下图这种

他里面的visualMap属性如下
visualMap: {
        top: 50,
        right: 10,
        pieces: [
          {
            gt: 0,
            lte: 50,
            color: '#93CE07'
          },
          {
            gt: 50,
            lte: 100,
            color: '#FBDB0F'
          },
          {
            gt: 100,
            lte: 150,
            color: '#FC7D02'
          },
          {
            gt: 150,
            lte: 200,
            color: '#FD0100'
          },
          {
            gt: 200,
            lte: 300,
            color: '#AA069F'
          },
          {
            gt: 300,
            color: '#AC3B2A'
          }
        ],
        outOfRange: {
          color: '#999'
        }
      },
其中
gt:大于 gte:大于等于
lt:小于 lte:小于等于
我的数据范围值是后台给的,有的给两个边界值,有的就只给了我一个lt:0.55也就是小于0.55的线要以某种颜色显示,但是我不管是自己写还是在echarts官网试,控制台都会给我报错Cannot read properties of undefined (reading 'coord')
解决办法:
1.首先:以div来代替官网右侧的区间以及颜色说明,把官网的用show:false给隐藏掉
<div
style="position: absolute;width: 30%;height: 6%;top: 5px;right: 3px;display:flex"
>
<div
style="flex:5;color:#000;display:flex;justify-content:end;align-items:center;"
>{{thresholdColorText}} </div>
<div class="thresholdColor"></div>
</div>.thresholdColor {
flex: 1;
border-radius: 5px;
background-color: blue;
}2.我的思路: echarts官网的这个图表的visualMap属性里面,要求起码有一个数值区间是有最大值和最小值的,如果后台只返给我们一个,当后台返给我最小值,也就是数值区间以及颜色显示为
{
  lt:0.55,
  color:'blue'
}
我们就手动创造另一个有最大值和最小值的区间,这里什么意思呢,就是后台跟我说当曲线数值小于0.55的时候显示蓝色,那我就自己搞一个区间,当曲线数值大于0.55小于0.55的100倍时,显示红色,一般echarts图表没有指定y轴刻度是多少的时候,y轴刻度是不会出现0.55的100倍的数字的,只会根据你的曲线数值来显示刻度,这个时候你把这两个对象都放进visualMap的pieces的属性中,就不会报错了
{
  gt:0.55,
  lt:55,
  color:'red'
}
同理,当后台只返给你一个最小值,也就是数值区间以及显示颜色为
{
  gt:0.55,
  color:'blue'
}
这里意思是当曲线数值大于0.55时显示蓝色,我们就手动创造一个区间,当曲线数值小于0.55大于负的0.55的100倍时,显示红色
{
  gt:-55,
  lt:0.55,
  color:'red'
}
下面的js代码主要讲的就是创建新的区间,然后去初始化echarts图的配置项,里面有的配置项可能你用不到,删了就行
         // 对只传给阈值最大值或最小值进行处理
// this.threshold是后台返给我的一个对象,里面有边界值(即lt或lte或gt或gte)和要显示的颜色(即color)
          let threshold1 = {};
// 当传给我的值只有一个最大值的时候
          if (
            this.threshold.lt != undefined ||
            this.threshold.lte != undefined
          ) {
            threshold1.color = "#FF0000";
            threshold1.gt =
              this.threshold.lt != undefined
                ? this.threshold.lt
                : this.threshold.lte;
            threshold1.lt =
              this.threshold.lt != undefined
                ? parseInt((this.threshold.lt * 100).toFixed(0))
                : parseInt((this.threshold.lte * 100).toFixed(0));
            this.thresholdColorText =
              this.threshold.lt != undefined
                ? "< " + this.threshold.lt
                : "≤ " + this.threshold.lte;
          } else if (
            this.threshold.gt != undefined ||
            this.threshold.gte != undefined
          ) {
            threshold1.color = "#FF0000";
            threshold1.lt =
              this.threshold.gt != undefined
                ? this.threshold.gt
                : this.threshold.gte;
            threshold1.gt =
              this.threshold.gt != undefined
                ? -parseInt((this.threshold.gt * 100).toFixed(0))
                : -parseInt((this.threshold.gte * 100).toFixed(0));
            this.thresholdColorText =
              this.threshold.gt != undefined
                ? "> " + this.threshold.gt
                : "≥ " + this.threshold.gte;
          }
          let option = {
            title: {
              text: "",
              left: "1%"
            },
            tooltip: {
              trigger: "axis"
            },
            grid: {
              left: "10%",
              right: "15%",
              bottom: "10%"
            },
            xAxis: {
              data: this.time.map(function(item) {
                return item;
              })
            },
            yAxis: {},
            visualMap: {
              show: false,
              type: "piecewise",
              // splitNumber: 2,
              top: 10,
              right: 10,
              precision: 0, //数据展示的小数精度,默认为0,无小数点
              pieces: [this.threshold, threshold1],
              outOfRange: {
                color: "#FF0000"
              }
            },
            series: {
              name: "实时曲线",
              type: "line",
              data: this.value.map(function(item) {
                return item;
              }),
              markLine: {
                silent: true,
                lineStyle: {
                  color: "red"
                },
                data: this.yAxisList
              }
            }
          };
          myChart.setOption(option);
          window.onresize = myChart.resize;
最后效果图如下

我当时被echarts图的这个bug真的搞得很烦,实在没办法才想到这样做,我在我的项目里应用起来暂时没发现什么问题,不知道这个方法通不通用

为开发者提供学习成长、分享交流、生态实践、资源工具等服务,帮助开发者快速成长。
更多推荐


 7
7 1
1- 0


 已为社区贡献3条内容

所有评论(0)