echarts 显示暂无数据的具体方法
有数据时记得调用 hideLoading() 否则图表将无法展示。实现原理是在图表上再增加一个图层,图层上写着暂无数据的提示。
·
在 echarts 渲染过程中,当没有数据的时候,页面像没有完成的项目一般,为了更好的用户体验,需要显示暂无数据,这里整理了三种实现方案:
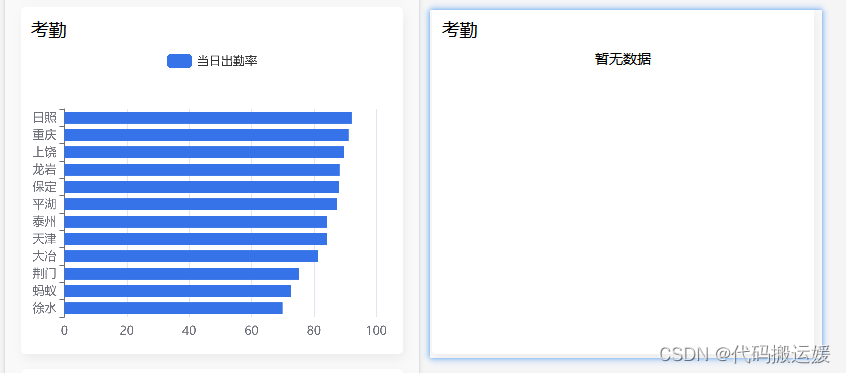
(1)通过判断是否有渲染需要的图表数据,给 DOM 插入文字。
if(this.chartData.series[0].data.length > 0){
    this.$nextTick(() => {
      this.charts = this.$echarts.init(this.$refs.chart);
      this.setOption();
      var _this = this;

      // 点击柱形图事件
      this.charts.on("click", (params) => {
        _this.$emit("getBar", params.name);
      });
    });
  } else {
    this.$nextTick(() => {
      var dom = this.$refs.chart
      dom.innerHTML = '暂无数据'
      dom.removeAttribute('_echarts_instance_')
    })
  }
(2) 通过 showLoading API 来实现
myChart = this.$echarts.init(this.$refs.chart);
myChart.setOption(option)
  if (!data.length) {
    myChart.showLoading({
      text: '暂无数据',
      showSpinner: false,
      textColor: 'black',
      maskColor: 'rgba(255, 255, 255, 1)',
      fontSize: '26px',
      fontWeight: 'bold'
    })
  } else {
  	myChart.hideLoading()
  }
有数据时记得调用 hideLoading() 否则图表将无法展示。
(3)通过 给 options 增加 graphic 配置项来实现
graphic: {
   type: 'text',
   left: 'center',
   top: 'middle',
   silent: true,
   invisible: data.length == 0, //是否可见,这里的意思是当没有数据时可见
   style: {
     fill: 'black',
     fontWeight: 'bold',
     text: '暂无数据',
     fontSize: '26px'
   }
 }
实现原理是在图表上再增加一个图层,图层上写着暂无数据的提示。

华为开发者空间,是为全球开发者打造的专属开发空间,汇聚了华为优质开发资源及工具,致力于让每一位开发者拥有一台云主机,基于华为根生态开发、创新。
更多推荐


 2
2 0
0- 0


 已为社区贡献8条内容

所有评论(0)