echarts——横向柱状图
功能描述全屏横向柱状图从小到大排序,每次显示5条,每3秒切换循环显示鼠标移入停止切换,鼠标移出继续切换柱状图组件源码<template><div class="w100 h100"><div ref="bar" class="w100 h100"></div></div></template><script>imp
·
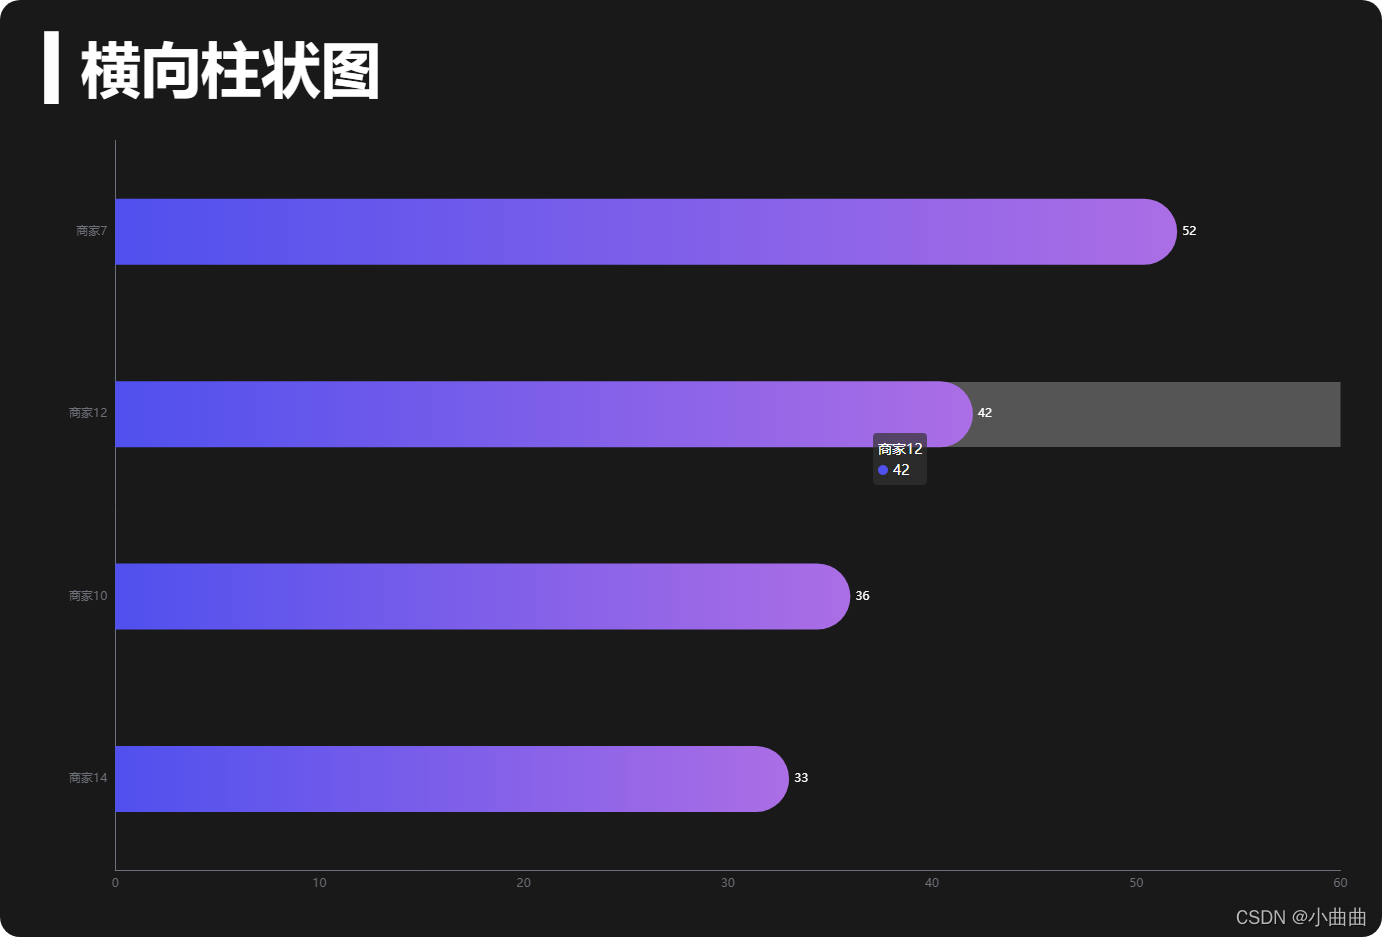
功能描述
- 全屏横向柱状图
- 从小到大排序,每次显示5条,每3秒切换循环显示
- 鼠标移入停止切换,鼠标移出继续切换
柱状图组件源码
<template>
  <div class="w100 h100">
    <div ref="bar" class="w100 h100"></div>
  </div>
</template>

<script>
import { ququ } from "../../public/static/theme/ququ"; // 引入主题
export default {
  data() {
    return {
      barChart: null,
      barData: [
        {
          name: "商家1",
          value: 12,
        },
        {
          name: "商家2",
          value: 22,
        },
        {
          name: "商家3",
          value: 10,
        },
        {
          name: "商家4",
          value: 32,
        },
        {
          name: "商家5",
          value: 25,
        },
        {
          name: "商家6",
          value: 16,
        },
        {
          name: "商家7",
          value: 52,
        },
        {
          name: "商家8",
          value: 33,
        },
        {
          name: "商家9",
          value: 19,
        },
        {
          name: "商家10",
          value: 36,
        },
        {
          name: "商家11",
          value: 24,
        },
        {
          name: "商家12",
          value: 42,
        },
        {
          name: "商家13",
          value: 29,
        },
        {
          name: "商家14",
          value: 33,
        },
      ],
      current: 1, // 当前页
      total: null, // 总页数
      timerId: null, // 定时器
    };
  },
  mounted() {
    /**
     * 需求:
     * 1、对数据进行从小到大排序,分为5个一组
     * 2、每隔3S切换一组展示,页面销毁清除定时器
     * 3、当鼠标移入图表停止切换,鼠标移出开启切换
     */
    this.init();
    this.update();
    this.openTimer();
  },
  beforeDestroy() {
    clearInterval(this.timerId);
  },
  methods: {
    // 初始化图表
    init() {
      this.$echarts.registerTheme("ququ", ququ); // 注册主题
      this.barChart = this.$echarts.init(this.$refs.bar, "ququ"); // 使用主题初始化
      // 监听鼠标移入移出事件
      this.barChart.on("mouseover", (params) => {
        console.log(params);
        clearInterval(this.timerId);
      });
      this.barChart.on("mouseout", () => {
        this.openTimer();
      });
    },
    // 获取并处理数据,然后渲染图表
    update() {
      // 排序
      this.barData = this.barData.sort((a, b) => a.value - b.value);
      // 总页数
      this.total =
        this.barData.length % 5 == 0
          ? this.barData.length / 5
          : parseInt(this.barData.length / 5) + 1;
      // 当前显示的5条数据
      let list = this.barData.slice((this.current - 1) * 5, this.current * 5);
      // 当前X、Y轴数据
      let barDataY = list.map((item) => item.name);
      let barDataX = list.map((item) => item.value);
      let option = {
        // 标题
        title: {
          text: "▍横向柱状图", // ▍ 任意打一个字,调出搜狗输入法卡片,右键单击——表情符号——符号大全
          left: 40,
          top: 40,
          textStyle: {
            fontSize: 60,
            color: "#fff",
          },
        },
        // 坐标轴
        grid: {
          top: "15%",
          left: "5%",
          right: "3%",
          bottom: "5%",
          containLabel: true, //是否包含坐标轴的文字
        },
        // X轴:横向柱状图,将xAxis的type设置为value
        xAxis: {
          type: "value",
        },
        // Y轴:横向柱状图,将xAxis的type设置为category
        yAxis: {
          type: "category",
          data: barDataY,
        },
        // 图表内容
        series: [
          {
            type: "bar", // 图表类型
            data: barDataX, // 数据
            barWidth: 66, // 柱的宽度
            // 柱上面的数值配置
            label: {
              show: true, // 显示值
              position: "right", // 显示位置
              color: "white",
            },
            // 每一个条目的样式配置
            itemStyle: {
              barBorderRadius: [0, 34, 34, 0], // 圆角
              // 渐变色  1、指明颜色渐变的方向  2、指明不同百分比之下颜色的值
              color: new this.$echarts.graphic.LinearGradient(0, 0, 1, 0, [
                { offset: 0, color: "#5050ee" },
                { offset: 1, color: "#ab6ee5" },
              ]),
            },
          },
        ],
        // 提示框设置
        tooltip: {
          trigger: "axis", //触发类型——坐标轴
          // 鼠标移入条目下面的背景
          axisPointer: {
            type: "line",
            z: 0,
            lineStyle: {
              color: "rgba(225,225,225,.3)",
              width: 65,
            },
          },
        },
      };

      // 生成图表
      this.barChart.setOption(option);
    },
    // 定时切换当前展示页码
    openTimer() {
      if (this.timerId) {
        clearInterval(this.timerId);
      }
      this.timerId = setInterval(() => {
        if (this.current < this.total) {
          this.current++;
        } else {
          this.current = 1;
        }
        this.update();
      }, 6000);
    },
  },
};
</script>
option配置项的拆分
- initOption:初始化的静态配置
- dataOption:获取到动态数据后的数据配置
- screenOption:适配屏幕分辨率大小的配置
// 每一次set option 是合并的关系,所以可以拆分在不同的时机设置不同的
this.barChart.setOption(option);
加上适配屏幕和option拆分的代码
<template>
  <div class="w100 h100">
    <div ref="bar" class="w100 h100"></div>
  </div>
</template>

<script>
import { ququ } from "../../public/static/theme/ququ";
export default {
  props: {
    msg: String,
  },
  data() {
    return {
      barChart: null,
      barData: [
        {
          name: "商家1",
          value: 12,
        },
        {
          name: "商家2",
          value: 22,
        },
        {
          name: "商家3",
          value: 10,
        },
        {
          name: "商家4",
          value: 32,
        },
        {
          name: "商家5",
          value: 25,
        },
        {
          name: "商家6",
          value: 16,
        },
        {
          name: "商家7",
          value: 52,
        },
        {
          name: "商家8",
          value: 33,
        },
        {
          name: "商家9",
          value: 19,
        },
        {
          name: "商家10",
          value: 36,
        },
        {
          name: "商家11",
          value: 24,
        },
        {
          name: "商家12",
          value: 42,
        },
        {
          name: "商家13",
          value: 29,
        },
        {
          name: "商家14",
          value: 33,
        },
      ],
      current: 1, // 当前页
      total: null, // 总页数
      timerId: null, // 定时器
    };
  },
  mounted() {
    /**
     * 需求:
     * 1、对数据进行从小到大排序,分为5个一组
     * 2、每隔3S切换一组展示,页面销毁清除定时器
     * 3、当鼠标移入图表停止切换,鼠标移出开启切换
     */
    this.init();
    this.getData();
    this.openTimer();
    // 监听屏幕大小变化
    window.addEventListener("resize", this.screenResize);
    // 一进来主动调取屏幕适配
    this.screenResize();
  },
  beforeDestroy() {
    clearInterval(this.timerId);
    window.removeEventListener("resize", this.screenResize);
  },
  methods: {
    // 初始化图表
    init() {
      this.$echarts.registerTheme("ququ", ququ);
      this.barChart = this.$echarts.init(this.$refs.bar, "ququ");

      // 拆分option:1、静态配置在初始化的时候先注册,每一次setOption是合并关系
      let initOption = {
        // 标题
        title: {
          text: "▍横向柱状图", // ▍ 任意打一个字,调出搜狗输入法卡片,右键单击——表情符号——符号大全
          left: 40,
          top: 40,
          textStyle: {
            color: "#fff",
          },
        },
        // 坐标轴
        grid: {
          top: "15%",
          left: "5%",
          right: "3%",
          bottom: "5%",
          containLabel: true, //是否包含坐标轴的文字
        },
        // X轴:横向柱状图,将xAxis的type设置为value
        xAxis: {
          type: "value",
        },
        // Y轴:横向柱状图,将xAxis的type设置为category
        yAxis: {
          type: "category",
        },
        // 图表内容
        series: [
          {
            type: "bar", // 图表类型
            // 柱上面的数值配置
            label: {
              show: true, // 显示值
              position: "right", // 显示位置
              color: "white",
            },
            // 每一个条目的样式配置
            itemStyle: {
              // 渐变色  1、指明颜色渐变的方向  2、指明不同百分比之下颜色的值
              color: new this.$echarts.graphic.LinearGradient(0, 0, 1, 0, [
                { offset: 0, color: "#5050ee" },
                { offset: 1, color: "#ab6ee5" },
              ]),
            },
          },
        ],
        // 提示框设置
        tooltip: {
          trigger: "axis", //触发类型——坐标轴
          // 鼠标移入条目下面的背景
          axisPointer: {
            type: "line",
            z: 0,
            lineStyle: {
              color: "rgba(225,225,225,.3)",
            },
          },
        },
      };
      this.barChart.setOption(initOption);
      // 监听鼠标移入移出事件
      this.barChart.on("mouseover", (params) => {
        console.log(params);
        clearInterval(this.timerId);
      });
      this.barChart.on("mouseout", () => {
        this.openTimer();
      });
    },
    // 获取并处理数据,然后渲染图表
    getData() {
      // 排序
      this.barData = this.barData.sort((a, b) => a.value - b.value);
      // 总页数
      this.total =
        this.barData.length % 5 == 0
          ? this.barData.length / 5
          : parseInt(this.barData.length / 5) + 1;
      // 当前显示的5条数据
      let list = this.barData.slice((this.current - 1) * 5, this.current * 5);
      // 当前X、Y轴数据
      let barDataY = list.map((item) => item.name);
      let barDataX = list.map((item) => item.value);

      // 拆分option:2、data配置在获取导数据的时候注册,每一次setOption是合并关系
      let dataOption = {
        // Y轴:横向柱状图,将xAxis的type设置为category
        yAxis: {
          data: barDataY,
        },
        // 图表内容
        series: [
          {
            data: barDataX, // 数据
          },
        ],
      };
      // 生成图表
      this.barChart.setOption(dataOption);
    },
    // 定时切换当前展示页码
    openTimer() {
      if (this.timerId) {
        clearInterval(this.timerId);
      }
      this.timerId = setInterval(() => {
        if (this.current < this.total) {
          this.current++;
        } else {
          this.current = 1;
        }
        this.getData();
      }, 6000);
    },
    // 监听屏幕变化
    screenResize() {
      this.$nextTick(() => {
        // 获取图表区域的宽度,作为基准值来设置其他需要动态改变的尺寸
        let width = this.$refs.bar.offsetWidth;
        let size = (width / 100) * 3.6; // 定义一个基准尺寸

        // 拆分option:3、受屏幕大小影响的配置在屏幕改变的时候set
        let screenOption = {
          // 标题
          title: {
            textStyle: {
              fontSize: size, //标题大小
            },
          },
          // 图表内容
          series: [
            {
              barWidth: size, // 柱的宽度
              // 每一个条目的样式配置
              itemStyle: {
                barBorderRadius: [0, size / 2, size / 2, 0], // 圆角
              },
            },
          ],
          // 提示框设置
          tooltip: {
            // 鼠标移入条目下面的背景
            axisPointer: {
              lineStyle: {
                width: size,
              },
            },
          },
        };
        this.barChart.setOption(screenOption);
        // 更新图表
        this.barChart.resize();
      });
    },
  },
};
</script>

为开发者提供学习成长、分享交流、生态实践、资源工具等服务,帮助开发者快速成长。
更多推荐


 8
8 0
0- 0


 已为社区贡献18条内容

所有评论(0)