k8s部署 filebeat 步骤、踩坑及解决方案
k8s,kubernetes,部署 filebeat,ELK
·
写在最前
本文中部署 filebeat 的流程步骤,前置条件需安装好官方 k8s 的 operator ECK,以及准备好合适的环境,具体请参考前文:k8s部署生产级elasticsearch+kibana 步骤、踩坑及解决方案
部署
创建 filebeat.yml 配置文件
apiVersion: beat.k8s.elastic.co/v1beta1
kind: Beat
metadata:
  name: filebeat
  namespace: elastic-system
spec:
  type: filebeat
  version: 7.14.1
  elasticsearchRef:
    name: es
  config:
    filebeat.inputs:
      - type: container
        paths:
          - /var/log/containers/*.log

    processors:
      - add_kubernetes_metadata: # 增加 k8s label 等相关信息,方便筛选
          host: ${NODE_NAME} # 在 AWS EKS 托管服务中,这一项必须设置,否则拿不到数据
          matchers:
          - logs_path:
              logs_path: "/var/log/containers/"
      - drop_fields: # 这里可以根据需求增减需要去除的值
          fields: ["agent", "ecs", "container", "host", "input", "log", "offset", "stream", "kubernetes.node", "kubernetes.pod", "kubernetes.replicaset", "kubernetes.namespace_uid", "kubernetes.labels.pod-template-hash"]
          ignore_missing: true # 忽略丢失值,如果日志格式完全统一,可以设为 false
      - decode_json_fields: # 将 message 字段按照 JSON 分析
          fields: ["message"]
          target: "" # 映射到的目录层级,可以映射为 message.
          overwrite_keys: false # 是否覆盖原有值
          process_array: false # 是否解析数组格式
          max_depth: 1 # 最大解析深度,默认是1,即1层,如果是 json 中 string 套 json的模式,需要设置为更高

    output.elasticsearch:
      hosts: ["http://es-es-http:9200"] # 根据上文的服务信息获取 es http 的地址
      username: "elastic"
      password: {%PASSWORD} # TODO: 这里需要改成正确的密码
      index: "product-other-log-%{+yyyy.MM.dd}"
      indices: # 满足条件分类的,单独生成一个 index,方便 kibana 分别展示
        - index: "product-containers-log-%{+yyyy.MM.dd}"
          when.or:
            - contains:
                kubernetes.labels.app: "etcd"
        - index: "product-services-log-%{+yyyy.MM.dd}"
          when.contains:
            kubernetes.labels.type: "service"
      pipelines: # 利用 pipeline 做生命周期管理,不需要可删除
        - pipeline: "product-containers-log-pipeline"
          when.or:
            - contains:
                kubernetes.labels.app: "etcd"
        - pipeline: "product-services-log-pipeline"
          when.contains:
            kubernetes.labels.type: "service"

    setup.template.enabled: false # 这三个配置需要设置,才能改写 es 的默认 index 设置
    setup.template.overwrite: true
    setup.ilm.enabled: false
  daemonSet:
    podTemplate:
      spec:
        serviceAccount: elastic-beat-filebeat-quickstart
        automountServiceAccountToken: true
        dnsPolicy: ClusterFirstWithHostNet
        hostNetwork: true
        securityContext:
          runAsUser: 0
        containers:
        - name: filebeat
          env: # 必须设置环境变量,才能在日志收集时获取 k8s 相关值
          - name: NODE_NAME
            valueFrom:
              fieldRef:
                fieldPath: spec.nodeName
          volumeMounts:
          - name: varlogcontainers
            mountPath: /var/log/containers
          - name: varlogpods
            mountPath: /var/log/pods
          - name: varlibdockercontainers
            mountPath: /var/lib/docker/containers
        volumes:
        - name: varlogcontainers
          hostPath:
            path: /var/log/containers
        - name: varlogpods
          hostPath:
            path: /var/log/pods
        - name: varlibdockercontainers
          hostPath:
            path: /var/lib/docker/containers
---
# 下述为官方文档未设置功能,但需要设置相应权限才能读取 k8s 参数,详见踩坑及解决方案
apiVersion: v1
kind: ServiceAccount
metadata:
  name: elastic-beat-filebeat-quickstart
  namespace: elastic-system
---
apiVersion: rbac.authorization.k8s.io/v1
kind: ClusterRoleBinding
metadata:
  name: elastic-beat-autodiscover-binding
  namespace: elastic-system
roleRef:
  apiGroup: rbac.authorization.k8s.io
  kind: ClusterRole
  name: elastic-beat-autodiscover
subjects:
- kind: ServiceAccount
  name: elastic-beat-filebeat-quickstart
  namespace: elastic-system
---
apiVersion: rbac.authorization.k8s.io/v1
kind: ClusterRole
metadata:
  name: elastic-beat-autodiscover
  namespace: elastic-system
rules:
- apiGroups:
  - ""
  resources:
  - nodes
  - namespaces
  - events
  - pods
  verbs:
  - get
  - list
  - watch
直接部署
kubectl apply -f filebeat.yml
验证是否部署成功
-
ops view:
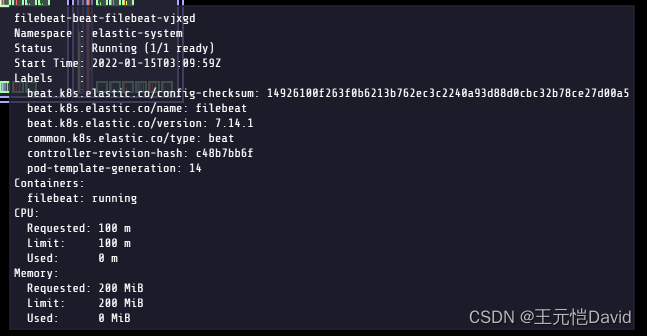
-
kibana 收到数据

踩坑及解决方案
filebeat 开启失败
使用 k8s 日志功能查看 filebeat 启动失败原因
kubectl get pods -n elastic-system # 获取报错 filebeat id
kubectl logs filebeat-beat-filebeat-{id} -n elastic-system
然后通过官方文档、论坛等搜索解决方案,大多数都是 config 配置里的设置问题,例:
问题:es index 无法创建
解决方案:参照上述 yaml 配置正确的 hosts、username、password
发送的数据中不带 k8s container name、labels 等关键数据
查看yaml设置是否都正确
apiVersion: beat.k8s.elastic.co/v1beta1
kind: Beat
spec:
  config:
	processors:
      - add_kubernetes_metadata: # 增加 k8s label 等相关信息,方便筛选
          host: ${NODE_NAME} # 在 AWS EKS 托管服务中,这一项必须设置,否则拿不到数据
          matchers:
          - logs_path:
              logs_path: "/var/log/containers/"
      ......
  daemonSet:
    podTemplate:
      spec:
        containers:
        - name: filebeat
          env: # 必须设置环境变量,才能在日志收集时获取 k8s 相关值
          - name: NODE_NAME
            valueFrom:
              fieldRef:
                fieldPath: spec.nodeName
      ......
---
# 检查 ServiceAccount、ClusterRole 的 rules 是否配置正确(有足够访问 k8s API 的权限)
apiVersion: v1
kind: ServiceAccount
......

为开发者提供学习成长、分享交流、生态实践、资源工具等服务,帮助开发者快速成长。
更多推荐


 2
2 0
0- 0


 已为社区贡献3条内容

所有评论(0)