Spring Boot Actuator、Prometheus、Grafana
Spring Boot Actuator、Prometheus、Grafana
spring-boot-actuator
grafana 是一个跨平台的开源的度量分析和可视化工具
prometheus 是 SoundCloud 开源监控警告解决方案,存储的是时序数据
spring boot actuator 可以监控和度量spring boot 应用程序
micrometer 是java平台上性能数据收集提供的一个通用api,系统多种度量指标类型
1 micrometer
Micrometer 为 Java 平台上的性能数据收集提供了一个通用的 API,应用程序只需要使用 Micrometer 的通用 API 来收集性能指标即可。Micrometer 会负责完成与不同监控系统的适配工作。这就使得切换监控系统变得很容易。Micrometer 还支持推送数据到多个不同的监控系统。
springboot2在spring-boot-actuator中引入了micrometer,对1.x的metrics进行了重构,另外支持对接的监控系统也更加丰富(Atlas、Datadog、Ganglia、Graphite、Influx、JMX、NewRelic、Prometheus、SignalFx、StatsD、Wavefront)。1.x的metrics都有点对齐dropwizard-metrics的味道,而micrometer除了一些基本metrics与dropwizard-metrics相类似外,重点支持了tag。这是一个很重要的信号,标志着老一代的statsd、graphite逐步让步于支持tag的influx以及prometheus。
etsy原版的statsd是不支持tag的,不过datadog以及influx都有对statsd进行改良以支持tag。而influxdb以及prometheus则是天生支持tag的。
对比
2 Actuator
Spring Boot Actuator是Spring Boot的一个组件,可以帮助你监控和管理Spring Boot应用,比如健康检查、审计、统计和HTTP追踪等。所有的这些特性可以通过JMX或者HTTP endpoints来获得。
你可以访问 http://ip:端口/actuator 查看系统中暴露的endpoint信息,也可以加上具体的 endpoint 查看他们的详细情况,例如 http://127.0.0.1:7001/actuator/health 查看健康信息。Spring Boot 2中的依赖actuator中集成的度量统计API使用的框架是Micrometer。
SpringBoot自带监控功能Actuator,可以帮助实现对程序内部运行情况监控,比如监控状况、Bean加载情况、环境变量、日志信息、线程信息、健康检查、审计、统计和HTTP追踪等
Actuator同时还可以与外部应用监控系统整合,比如Prometheus。可以选择使用HTTP端点或JMX来管理和监视应用程序。
Actuator使用Micrometer来整合上面提到的外部应用监控系统。这使得只要通过非常小的配置就可以集成任何应用监控系统。
Spring-Boot-Actuator官方文档
3 metrics
Spring Boot1 spring-boot-actuator中引入 metrics
打开 ip:端口/actuator/metrics 网址就可以看到当前微服务的所有metrics,每一个metric都相当于influx数据库的一个measurement,也就是传统数据库的数据表的概念。
metrics tag/label
关于metrics是否支持tag/label,则代表其metrics是否能够有多维度的支持。像statsd不支持tag,如果要区分多host的同一个jvm指标,则通常是通过添加prefix来解决,不过这个给查询统计以及后续扩展带了诸多的不变。
支持tag的好处就是可以进行多维度的统计和查询,以同一微服务但是不同实例的jvm指标来说,可以通过tag来添加host标识,这样监控系统就可以灵活根据tag查询过滤来查看不同主机粒度的,甚至是不同数据中心的粒度。
4 Prometheus
spring boot 2x版本中,actuator使用的是micrometer,Micrometer是一个监控门面,可以类比成监控界的 Slf4j , 借助Micrometer,应用能够对接各种监控系统,prometheus数据源可以直接使用spring boot的actuator接口。例如本文所要介绍的:Prometheus
springboot2启用/actuator/prometheus端点,供Prometheus来抓取指标。
Prometheus 是一套开源的系统监控报警框架。它启发于 Google 的 borgmon 监控系统,由工作在 SoundCloud 的 google 前员工在 2012 年创建,作为社区开源项目进行开发,并于 2015 年正式发布。2016 年,Prometheus 正式加入 Cloud Native Computing Foundation,成为受欢迎度仅次于 Kubernetes 的项目。
作为新一代的监控框架,Prometheus 具有以下特点:
强大的多维度数据模型:
时间序列数据通过 metric 名和键值对来区分。
所有的 metrics 都可以设置任意的多维标签。
数据模型更随意,不需要刻意设置为以点分隔的字符串。
可以对数据模型进行聚合,切割和切片操作。
支持双精度浮点类型,标签可以设为全 unicode。
灵活而强大的查询语句(PromQL):在同一个查询语句,可以对多个 metrics 进行乘法、加法、连接、取分数位等操作。
易于管理: Prometheus server 是一个单独的二进制文件,可直接在本地工作,不依赖于分布式存储。
高效:平均每个采样点仅占 3.5 bytes,且一个 Prometheus server 可以处理数百万的 metrics。
使用 pull 模式采集时间序列数据,这样不仅有利于本机测试而且可以避免有问题的服务器推送坏的 metrics。
可以采用 push gateway 的方式把时间序列数据推送至 Prometheus server 端。
可以通过服务发现或者静态配置去获取监控的 targets。
有多种可视化图形界面。
易于伸缩。
需要指出的是,由于数据采集可能会有丢失,所以 Prometheus 不适用对采集数据要 100% 准确的情形。但如果用于记录时间序列数据,Prometheus 具有很大的查询优势,此外,Prometheus 适用于微服务的体系架构。
4.1 依赖
        <dependency>
            <groupId>org.springframework.boot</groupId>
            <artifactId>spring-boot-starter-actuator</artifactId>
        </dependency>
        <dependency>
            <groupId>io.micrometer</groupId>
            <artifactId>micrometer-registry-prometheus</artifactId>
        </dependency>
如果使用InfluxDB进行数据存储可以使用 micrometer-registry-influx
4.2 配置
application.properties
#prometheus配置
spring.application.name = prometheus-demo
management.security.enabled = false
management.metrics.export.prometheus.enabled = true
management.metrics.export.prometheus.step = 1ms
management.metrics.export.prometheus.descriptions = true
management.web.server.auto-time-requests = true

management.endpoint.prometheus.enabled = true
#启用 prometheus和health监控
management.endpoints.web.exposure.include=prometheus,health
#management.endpoints.web.exposure.include=*
#刚开始没配置web-path,prometheus一直监控不到
management.endpoints.web.base-path = /
#关闭elasticsearch客户端检查
management.health.elasticsearch.enabled=false
management.metrics.tags.application=${spring.application.name}
yml配置
server:
  port: 8803
spring:
  application:
    name: myactuator
management:
  endpoints:
    web:
      exposure:
        include: "*" #'prometheus,health'
        exclude: "shutdown"
      base-path: /actuator
  endpoint:
    prometheus:
      enabled: true
  metrics:
    export:
      prometheus:
        enabled: true
        step: 1ms
        descriptions: true
    tags:
      # 为指标设置一个Tag,这里设置为应用名,Tag是Prometheus提供的一种能力,从而实现更加灵活的筛选
      application: ${spring.application.name}
  health:
    elasticsearch:
      enabled: false
配置自定义bean
@Configuration
public class ActuatorConfig {

  @Bean
public MeterRegistryCustomizer<MeterRegistry> configurer(@Value("${spring.application.name}") String applicationName) {
    return (registry) -> registry.config().commonTags("application", applicationName);
}
}
ActuatorController.java
@RestController
public class ActuatorController {

  @GetMapping("/user/info/{id}")
  public ResponseEntity<Map<String, Object>> queryUserInfoById(@PathVariable("id") long id)
      throws InterruptedException {
    Map<String, Object> map = new HashMap<>();
    map.put("id", id);
    map.put("username", "shawn");
    map.put("realname", "shawn");
    map.put("age", 25);
    TimeUnit.SECONDS.sleep(2);
    return ResponseEntity.ok(map);
  }

  @GetMapping("/user/list")
  public ResponseEntity<List<Map<String, Object>>> listUser()
      throws InterruptedException {
    List<Map<String, Object>> list = new ArrayList<>();
    for (int i = 1; i <= 5; i++) {
      Map<String, Object> map = new HashMap<>();
      map.put("id", i);
      map.put("username", "shawn_" + i);
      map.put("realname", "shawn_" + i);
      map.put("age", 25 + i);
      list.add(map);
    }
    TimeUnit.SECONDS.sleep(2);
    return ResponseEntity.ok(list);
  }

}
url http://localhost:8080/actuator/prometheus
curl -i http://localhost:8088/actuator/prometheus
curl -i http://localhost:8088/actuator/metrics
curl -i http://localhost:8088/actuator/metrics/http.server.requests
curl -i http://localhost:8088/user/info/1
curl -i http://localhost:8088/user/list
4.3 返回参数
| 序号 | 参数 | 参数说明 |
|---|---|---|
| – | JVM | — |
| 1 | jvm.memory.max | JVM最大内存 |
| 2 | jvm.memory.committed | JVM可用内存 |
| 3 | jvm.memory.used | JVM已用内存 |
| 4 | jvm.buffer.memory.used | JVM缓冲区已用内存 |
| 5 | jvm.buffer.count | 当前缓冲区数 |
| 6 | jvm.threads.daemon | JVM守护线程数 |
| 7 | jvm.threads.live | JVM当前活跃线程数 |
| 8 | jvm.threads.peak | JVM峰值线程数 |
| 9 | jvm.classes.loaded | 加载classes数 |
| 10 | jvm.classes.unloaded | 未加载的classes数 |
| 11 | jvm.gc.memory.allocated | GC时,年轻代分配的内存空间 |
| 12 | jvm.gc.memory.promoted | GC时,老年代分配的内存空间 |
| 13 | jvm.gc.max.data.size | GC时,老年代的最大内存空间 |
| 14 | jvm.gc.live.data.size | FullGC时,老年代的内存空间 |
| 15 | jvm.gc.pause | GC耗时 |
| – | TOMCAT | — |
| 16 | tomcat.sessions.created | tomcat已创建session数 |
| 17 | tomcat.sessions.expired | tomcat已过期session数 |
| 18 | tomcat.sessions.active.current | tomcat活跃session数 |
| 19 | tomcat.sessions.active.max | tomcat最多活跃session数 |
| 20 | tomcat.sessions.alive.max.second | tomcat最多活跃session数持续时间 |
| 21 | tomcat.sessions.rejected | 超过session最大配置后,拒绝的session个数 |
| 22 | tomcat.global.error | 错误总数 |
| 23 | tomcat.global.sent | 发送的字节数 |
| 24 | tomcat.global.request.max | request最长时间 |
| 25 | tomcat.global.request | 全局request次数和时间 |
| 26 | tomcat.global.received | 全局received次数和时间 |
| 27 | tomcat.servlet.request | servlet的请求次数和时间 |
| 28 | tomcat.servlet.error | servlet发生错误总数 |
| 29 | tomcat.servlet.request.max | servlet请求最长时间 |
| 30 | tomcat.threads.busy | tomcat繁忙线程 |
| 31 | tomcat.threads.current | tomcat当前线程数 |
| 32 | tomcat.threads.config.max | tomcat配置的线程最大数 |
| 33 | tomcat.cache.access | tomcat读取缓存次数 |
| 34 | tomcat.cache.hit | tomcat缓存命中次数 |
| – CPU — | ||
| 35 | system.cpu.count | CPU数量 |
| 36 | system.load.average. | 1m load average |
| 37 | system.cpu.usage | 系统CPU使用率 |
| 38 | process.cpu.usage | 当前进程CPU使用率 |
| 39 | http.server.requests | http请求调用情况 |
| 40 | process.uptime | 应用已运行时间 |
| 41 | process.files.max | 允许最大句柄数 |
| 42 | process.start.time | 应用启动时间点 |
| 43 | process.files.open | 当前打开句柄数 |
返回内容:(监控项和监控数值)
# HELP jvm_threads_states_threads The current number of threads having NEW state
# TYPE jvm_threads_states_threads gauge
jvm_threads_states_threads{application="feedback",state="new",} 0.0
jvm_threads_states_threads{application="feedback",state="timed-waiting",} 17.0
jvm_threads_states_threads{application="feedback",state="blocked",} 0.0
jvm_threads_states_threads{application="feedback",state="waiting",} 24.0
jvm_threads_states_threads{application="feedback",state="terminated",} 0.0
jvm_threads_states_threads{application="feedback",state="runnable",} 19.0
# HELP jvm_gc_max_data_size_bytes Max size of old generation memory pool
# TYPE jvm_gc_max_data_size_bytes gauge
jvm_gc_max_data_size_bytes{application="feedback",} 5.703204864E9
# HELP tomcat_sessions_active_max_sessions
# TYPE tomcat_sessions_active_max_sessions gauge
tomcat_sessions_active_max_sessions{application="feedback",} 0.0
# HELP jvm_memory_committed_bytes The amount of memory in bytes that is committed for the Java virtual machine to use
# TYPE jvm_memory_committed_bytes gauge
jvm_memory_committed_bytes{application="feedback",area="nonheap",id="Metaspace",} 6.4094208E7
jvm_memory_committed_bytes{application="feedback",area="nonheap",id="Code Cache",} 1.6973824E7
jvm_memory_committed_bytes{application="feedback",area="heap",id="PS Survivor Space",} 2.0447232E7
jvm_memory_committed_bytes{application="feedback",area="heap",id="PS Old Gen",} 3.89021696E8
jvm_memory_committed_bytes{application="feedback",area="heap",id="PS Eden Space",} 4.5350912E8
jvm_memory_committed_bytes{application="feedback",area="nonheap",id="Compressed Class Space",} 8519680.0
# HELP jvm_memory_max_bytes The maximum amount of memory in bytes that can be used for memory management
# TYPE jvm_memory_max_bytes gauge
jvm_memory_max_bytes{application="feedback",area="nonheap",id="Metaspace",} -1.0
jvm_memory_max_bytes{application="feedback",area="nonheap",id="Code Cache",} 2.5165824E8
jvm_memory_max_bytes{application="feedback",area="heap",id="PS Survivor Space",} 2.0447232E7
jvm_memory_max_bytes{application="feedback",area="heap",id="PS Old Gen",} 5.703204864E9
jvm_memory_max_bytes{application="feedback",area="heap",id="PS Eden Space",} 2.809659392E9
jvm_memory_max_bytes{application="feedback",area="nonheap",id="Compressed Class Space",} 1.073741824E9
# HELP jvm_buffer_total_capacity_bytes An estimate of the total capacity of the buffers in this pool
# TYPE jvm_buffer_total_capacity_bytes gauge
jvm_buffer_total_capacity_bytes{application="feedback",id="direct",} 81936.0
jvm_buffer_total_capacity_bytes{application="feedback",id="mapped",} 0.0
# HELP tomcat_sessions_active_current_sessions
# TYPE tomcat_sessions_active_current_sessions gauge
tomcat_sessions_active_current_sessions{application="feedback",} 0.0
# HELP system_cpu_count The number of processors available to the Java virtual machine
# TYPE system_cpu_count gauge
system_cpu_count{application="feedback",} 6.0
# HELP process_cpu_usage The "recent cpu usage" for the Java Virtual Machine process
# TYPE process_cpu_usage gauge
process_cpu_usage{application="feedback",} 0.001260906050531724
# HELP system_cpu_usage The "recent cpu usage" for the whole system
# TYPE system_cpu_usage gauge
system_cpu_usage{application="feedback",} 0.06223864591061535
# HELP process_uptime_seconds The uptime of the Java virtual machine
# TYPE process_uptime_seconds gauge
process_uptime_seconds{application="feedback",} 6079.537
# HELP jvm_gc_live_data_size_bytes Size of old generation memory pool after a full GC
# TYPE jvm_gc_live_data_size_bytes gauge
jvm_gc_live_data_size_bytes{application="feedback",} 3.5917448E7
# HELP tomcat_sessions_expired_sessions_total
# TYPE tomcat_sessions_expired_sessions_total counter
tomcat_sessions_expired_sessions_total{application="feedback",} 0.0
# HELP jvm_threads_live_threads The current number of live threads including both daemon and non-daemon threads
# TYPE jvm_threads_live_threads gauge
jvm_threads_live_threads{application="feedback",} 60.0
# HELP http_server_requests_seconds
# TYPE http_server_requests_seconds summary
http_server_requests_seconds_count{application="feedback",exception="None",method="GET",outcome="SUCCESS",status="200",uri="/actuator",} 1.0
http_server_requests_seconds_sum{application="feedback",exception="None",method="GET",outcome="SUCCESS",status="200",uri="/actuator",} 0.0041683
http_server_requests_seconds_count{application="feedback",exception="None",method="PUT",outcome="SUCCESS",status="200",uri="/feedback",} 1.0
http_server_requests_seconds_sum{application="feedback",exception="None",method="PUT",outcome="SUCCESS",status="200",uri="/feedback",} 60.8246484
http_server_requests_seconds_count{application="feedback",exception="None",method="GET",outcome="SUCCESS",status="200",uri="/actuator/prometheus",} 326.0
http_server_requests_seconds_sum{application="feedback",exception="None",method="GET",outcome="SUCCESS",status="200",uri="/actuator/prometheus",} 19.7430817
http_server_requests_seconds_count{application="feedback",exception="None",method="GET",outcome="CLIENT_ERROR",status="404",uri="/**",} 5.0
http_server_requests_seconds_sum{application="feedback",exception="None",method="GET",outcome="CLIENT_ERROR",status="404",uri="/**",} 0.1397898
# HELP http_server_requests_seconds_max
# TYPE http_server_requests_seconds_max gauge
http_server_requests_seconds_max{application="feedback",exception="None",method="GET",outcome="SUCCESS",status="200",uri="/actuator",} 0.0
http_server_requests_seconds_max{application="feedback",exception="None",method="PUT",outcome="SUCCESS",status="200",uri="/feedback",} 0.0
http_server_requests_seconds_max{application="feedback",exception="None",method="GET",outcome="SUCCESS",status="200",uri="/actuator/prometheus",} 0.0560053
http_server_requests_seconds_max{application="feedback",exception="None",method="GET",outcome="CLIENT_ERROR",status="404",uri="/**",} 0.0
# HELP jvm_threads_peak_threads The peak live thread count since the Java virtual machine started or peak was reset
# TYPE jvm_threads_peak_threads gauge
jvm_threads_peak_threads{application="feedback",} 60.0
# HELP jvm_threads_daemon_threads The current number of live daemon threads
# TYPE jvm_threads_daemon_threads gauge
jvm_threads_daemon_threads{application="feedback",} 47.0
# HELP tomcat_sessions_created_sessions_total
# TYPE tomcat_sessions_created_sessions_total counter
tomcat_sessions_created_sessions_total{application="feedback",} 0.0
# HELP jvm_gc_memory_allocated_bytes_total Incremented for an increase in the size of the young generation memory pool after one GC to before the next
# TYPE jvm_gc_memory_allocated_bytes_total counter
jvm_gc_memory_allocated_bytes_total{application="feedback",} 8.452706E8
# HELP tomcat_sessions_rejected_sessions_total
# TYPE tomcat_sessions_rejected_sessions_total counter
tomcat_sessions_rejected_sessions_total{application="feedback",} 0.0
# HELP jvm_gc_pause_seconds Time spent in GC pause
# TYPE jvm_gc_pause_seconds summary
jvm_gc_pause_seconds_count{action="end of minor GC",application="feedback",cause="Metadata GC Threshold",} 1.0
jvm_gc_pause_seconds_sum{action="end of minor GC",application="feedback",cause="Metadata GC Threshold",} 0.021
jvm_gc_pause_seconds_count{action="end of minor GC",application="feedback",cause="Allocation Failure",} 2.0
jvm_gc_pause_seconds_sum{action="end of minor GC",application="feedback",cause="Allocation Failure",} 0.028
jvm_gc_pause_seconds_count{action="end of major GC",application="feedback",cause="Metadata GC Threshold",} 1.0
jvm_gc_pause_seconds_sum{action="end of major GC",application="feedback",cause="Metadata GC Threshold",} 0.113
# HELP jvm_gc_pause_seconds_max Time spent in GC pause
# TYPE jvm_gc_pause_seconds_max gauge
jvm_gc_pause_seconds_max{action="end of minor GC",application="feedback",cause="Metadata GC Threshold",} 0.0
jvm_gc_pause_seconds_max{action="end of minor GC",application="feedback",cause="Allocation Failure",} 0.0
jvm_gc_pause_seconds_max{action="end of major GC",application="feedback",cause="Metadata GC Threshold",} 0.0
# HELP jvm_gc_memory_promoted_bytes_total Count of positive increases in the size of the old generation memory pool before GC to after GC
# TYPE jvm_gc_memory_promoted_bytes_total counter
jvm_gc_memory_promoted_bytes_total{application="feedback",} 1.9524136E7
# HELP jvm_buffer_memory_used_bytes An estimate of the memory that the Java virtual machine is using for this buffer pool
# TYPE jvm_buffer_memory_used_bytes gauge
jvm_buffer_memory_used_bytes{application="feedback",id="direct",} 81936.0
jvm_buffer_memory_used_bytes{application="feedback",id="mapped",} 0.0
# HELP jvm_classes_unloaded_classes_total The total number of classes unloaded since the Java virtual machine has started execution
# TYPE jvm_classes_unloaded_classes_total counter
jvm_classes_unloaded_classes_total{application="feedback",} 6.0
# HELP tomcat_sessions_alive_max_seconds
# TYPE tomcat_sessions_alive_max_seconds gauge
tomcat_sessions_alive_max_seconds{application="feedback",} 0.0
# HELP process_start_time_seconds Start time of the process since unix epoch.
# TYPE process_start_time_seconds gauge
process_start_time_seconds{application="feedback",} 1.599642895483E9
# HELP logback_events_total Number of error level events that made it to the logs
# TYPE logback_events_total counter
logback_events_total{application="feedback",level="error",} 0.0
logback_events_total{application="feedback",level="debug",} 0.0
logback_events_total{application="feedback",level="info",} 236.0
logback_events_total{application="feedback",level="trace",} 0.0
logback_events_total{application="feedback",level="warn",} 964.0
# HELP jvm_buffer_count_buffers An estimate of the number of buffers in the pool
# TYPE jvm_buffer_count_buffers gauge
jvm_buffer_count_buffers{application="feedback",id="direct",} 11.0
jvm_buffer_count_buffers{application="feedback",id="mapped",} 0.0
# HELP jvm_memory_used_bytes The amount of used memory
# TYPE jvm_memory_used_bytes gauge
jvm_memory_used_bytes{application="feedback",area="nonheap",id="Metaspace",} 6.0684336E7
jvm_memory_used_bytes{application="feedback",area="nonheap",id="Code Cache",} 1.6949312E7
jvm_memory_used_bytes{application="feedback",area="heap",id="PS Survivor Space",} 6370080.0
jvm_memory_used_bytes{application="feedback",area="heap",id="PS Old Gen",} 3.5945144E7
jvm_memory_used_bytes{application="feedback",area="heap",id="PS Eden Space",} 2.6841788E8
jvm_memory_used_bytes{application="feedback",area="nonheap",id="Compressed Class Space",} 7853464.0
# HELP jvm_classes_loaded_classes The number of classes that are currently loaded in the Java virtual machine
# TYPE jvm_classes_loaded_classes gauge
jvm_classes_loaded_classes{application="feedback",} 11494.0
5 docker 运行 Prometheus + Grafana
5.1 Docker
docker run -d \
	--name prometheus \
    -p 9090:9090 \
    -v /home/docker/conf/prometheus.yml:/etc/prometheus/prometheus.yml \
    prom/prometheus
docker run -d --name grafana -p 3000:3000 grafana/grafana
5.2 Docker-compose
docker-compose.yaml
version: '3'
services:
  grafana:
    container_name: grafana
    image: grafana/grafana
    environment:
      - TZ=Asia/Shanghai
    ports:
      - 3000:3000
    volumes:
      - ./grafanaplugin:/var/lib/grafana/plugins/grafanaplugin
    privileged: true
    restart: always
  prom:
    image: quay.io/prometheus/prometheus:latest
    volumes:
      # 将prometheus.yml 文件放在与docker-compose 同级目录
      - ./monitor/prometheus.yml:/etc/prometheus/prometheus.yml
    command: "--config.file=/etc/prometheus/prometheus.yml --storage.tsdb.path=/prometheus"
    ports:
     - "23333:9090"
    depends_on:
     - exporter
  exporter:
    image: prom/node-exporter:latest
    ports:
     - "19100:9100"
docker-compose up -d
5.3 配置 Prometheus
编辑 prometheus.yml
scrape_configs:
  - job_name: 'actuator-springboot'
    scrape_interval: 15s
    scrape_timeout: 10s
    metrics_path: '/actuator/prometheus'
    static_configs:
      - targets: ['localhost:8080']
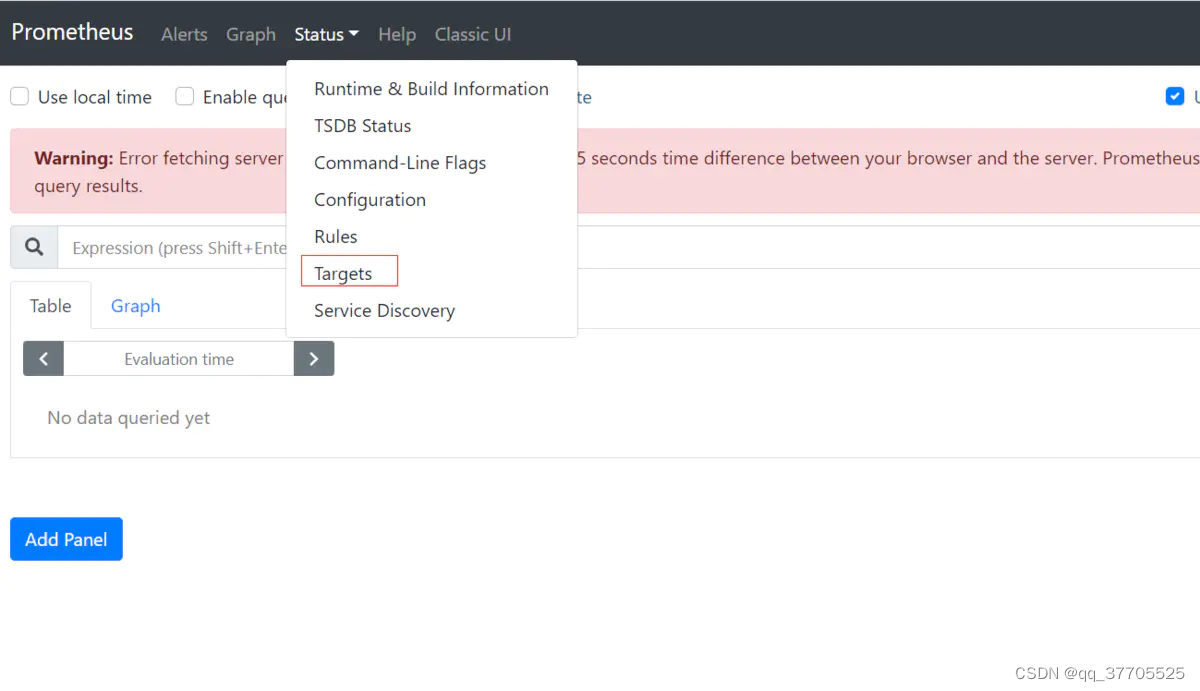
验证 prometheus 采集
浏览器里打开 http://localhost:9090, 通过菜单,将页面切换到 Targets, 在targets 里能看到我们的监控任务
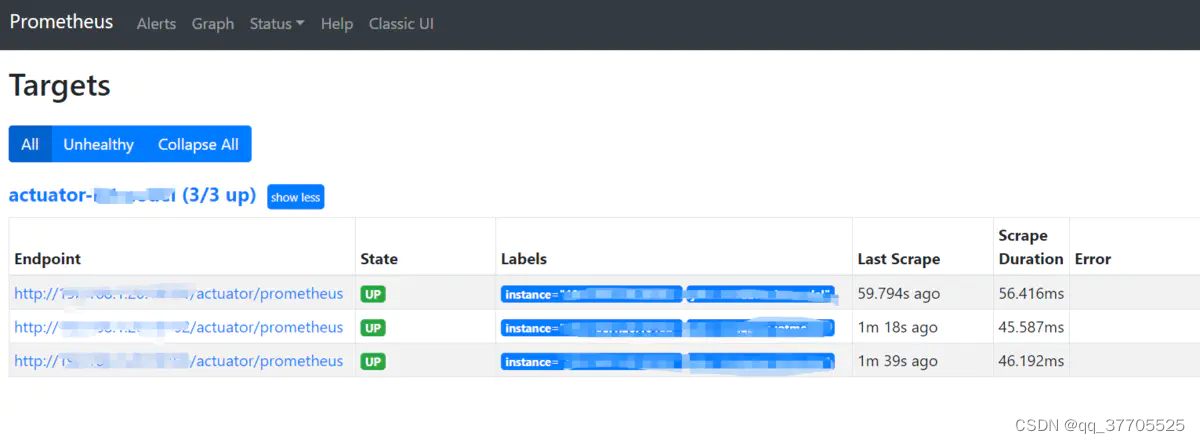
异常信息正常后,Prometheus现在已经可以正常监控到应用的JVM信息了
查看配置已守护线程线程数(jvm_threads_daemon_threads)
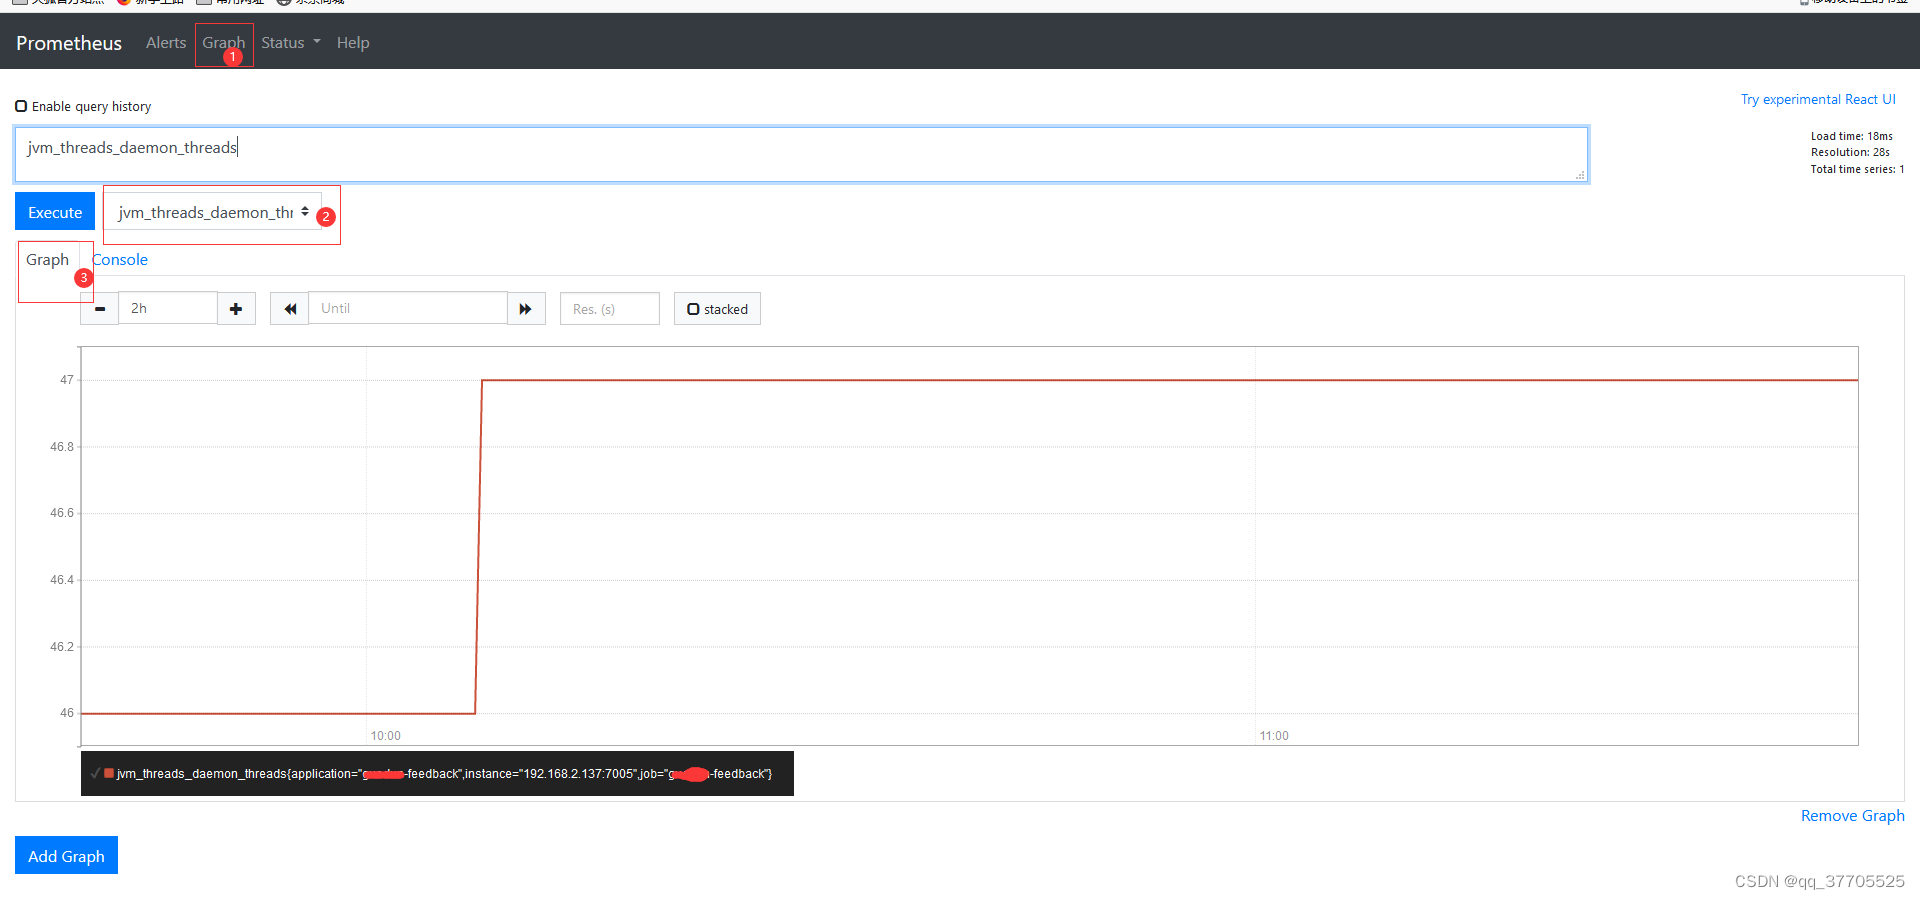
- 选择 Graph 图表
- 选择 jvm_threads_daemon_threads JVM守护线程数
- 选择 Graph TAB
5.4 配置Grafana
简介
Grafana是一个跨平台的开源的度量分析和可视化工具,可以通过将采集的数据查询然后可视化的展示,并及时通知。它主要有以下六大特点:
1、展示方式:快速灵活的客户端图表,面板插件有许多不同方式的可视化指标和日志,官方库中具有丰富的仪表盘插件,比如热图、折线图、图表等多种展示方式;
2、数据源:Graphite,InfluxDB,OpenTSDB,Prometheus,Elasticsearch,CloudWatch和KairosDB等;
3、通知提醒:以可视方式定义最重要指标的警报规则,Grafana将不断计算并发送通知,在数据达到阈值时通过Slack、PagerDuty等获得通知;
4、混合展示:在同一图表中混合使用不同的数据源,可以基于每个查询指定数据源,甚至自定义数据源;
5、注释:使用来自不同数据源的丰富事件注释图表,将鼠标悬停在事件上会显示完整的事件元数据和标记;
6、过滤器:Ad-hoc过滤器允许动态创建新的键/值过滤器,这些过滤器会自动应用于使用该数据源的所有查询。
Grafana 是一款采用 GO 语言编写的开源应用,支持跨平台度量分析和可视化 + 告警。可以通过将采集的数据查询然后可视化地展示,并及时通知。Grafana 支持多种数据源和展示方式,总而言之是一款强大酷炫的监控指标可视化工具。
登录地址:http://192.168.1.233:3000
用户名/密码 : admin/admin
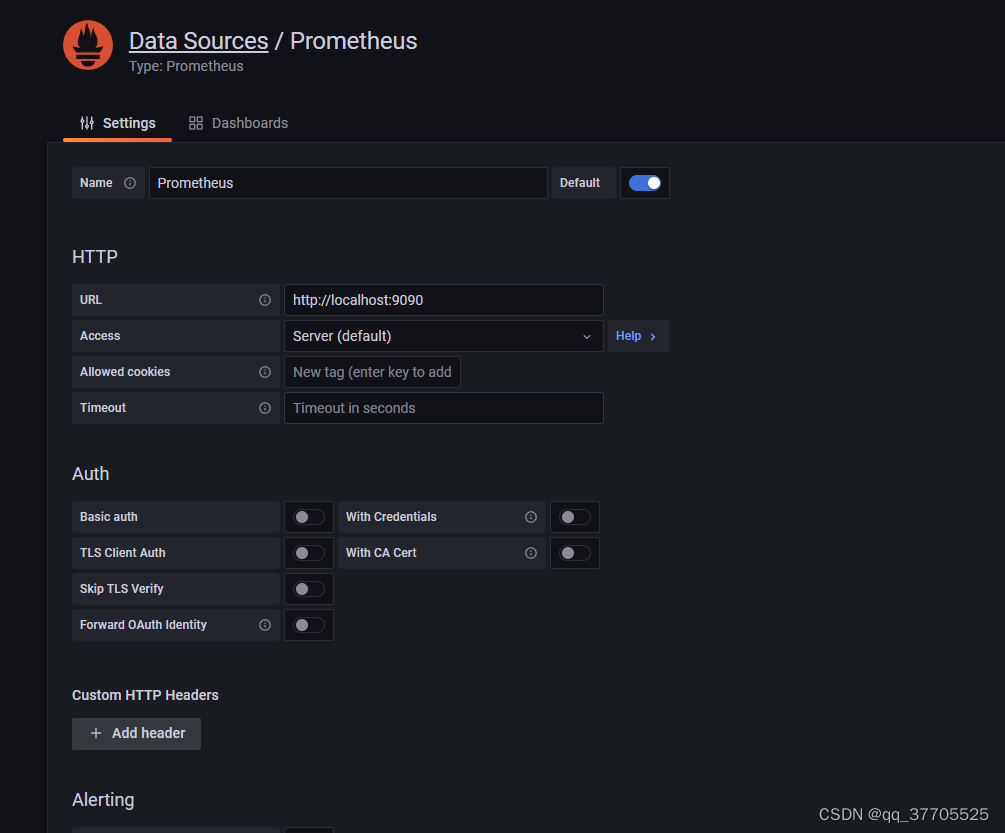
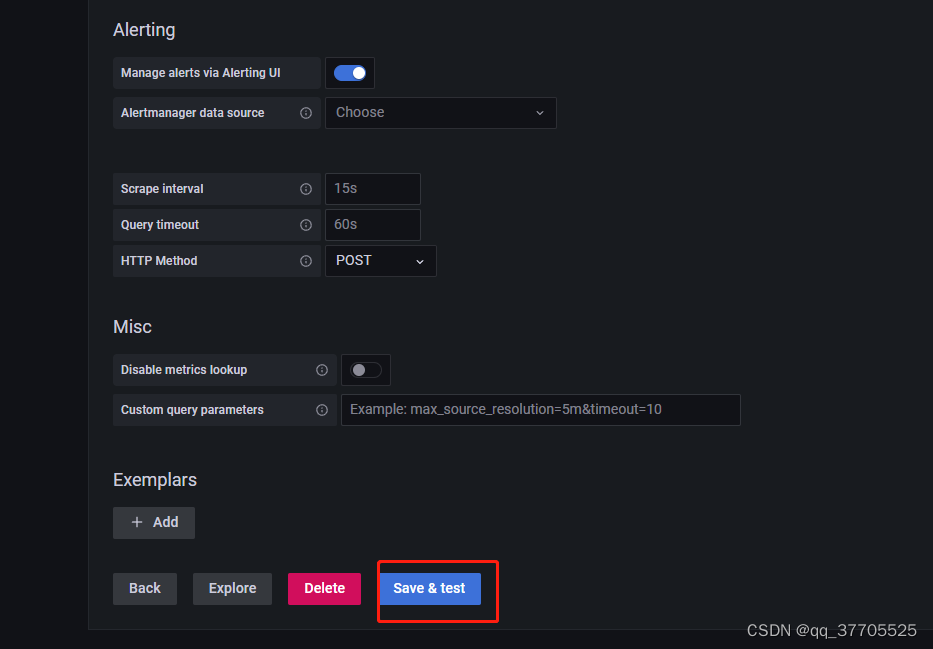
添加prometheus 数据源
这里我们要添加的就是上面的Prometheus数据源
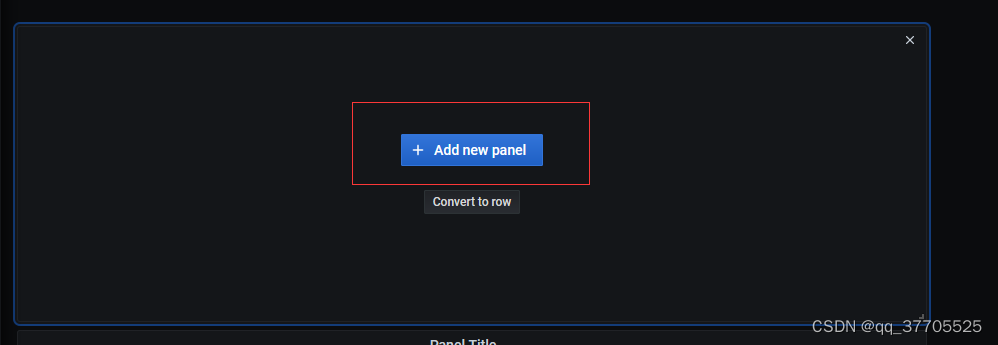
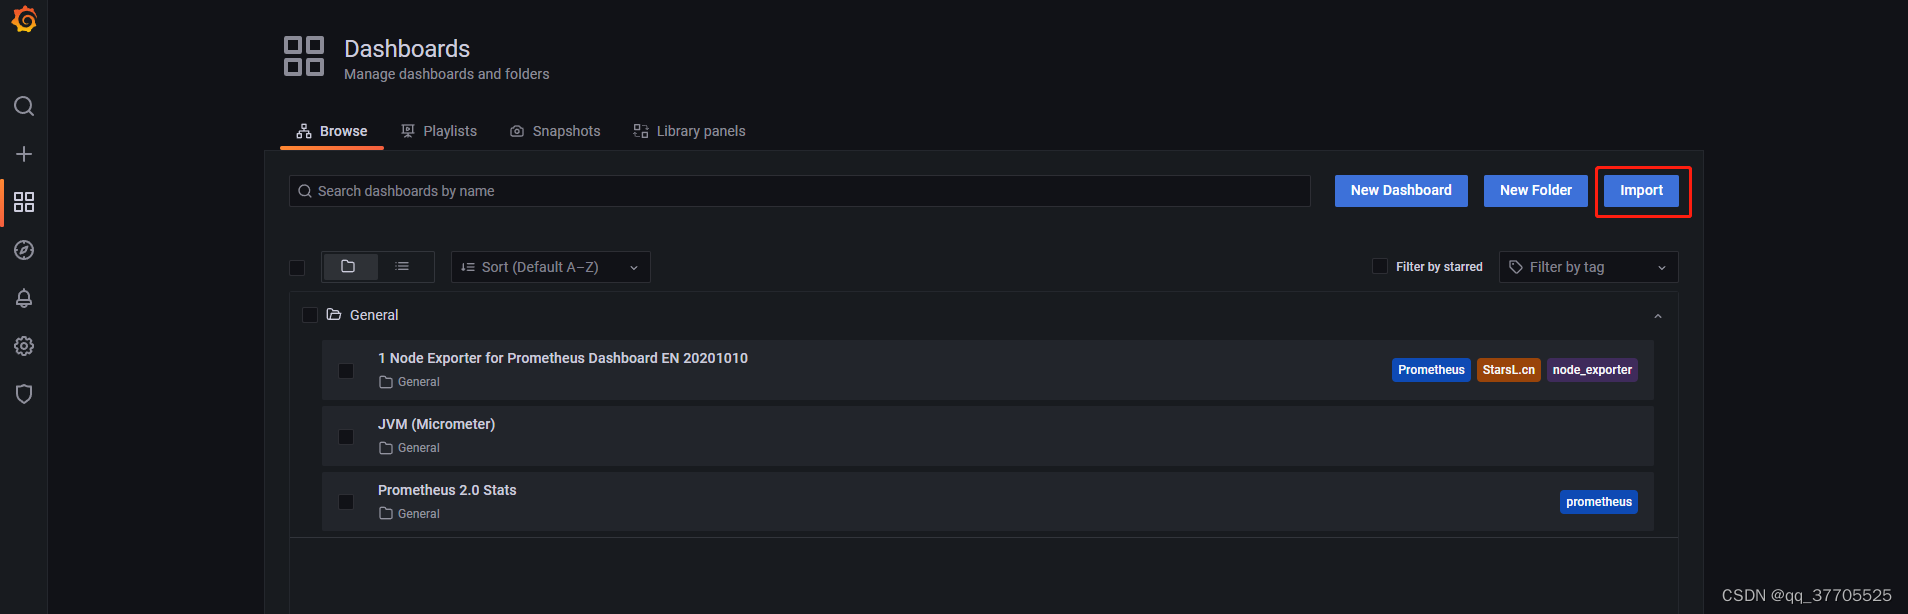
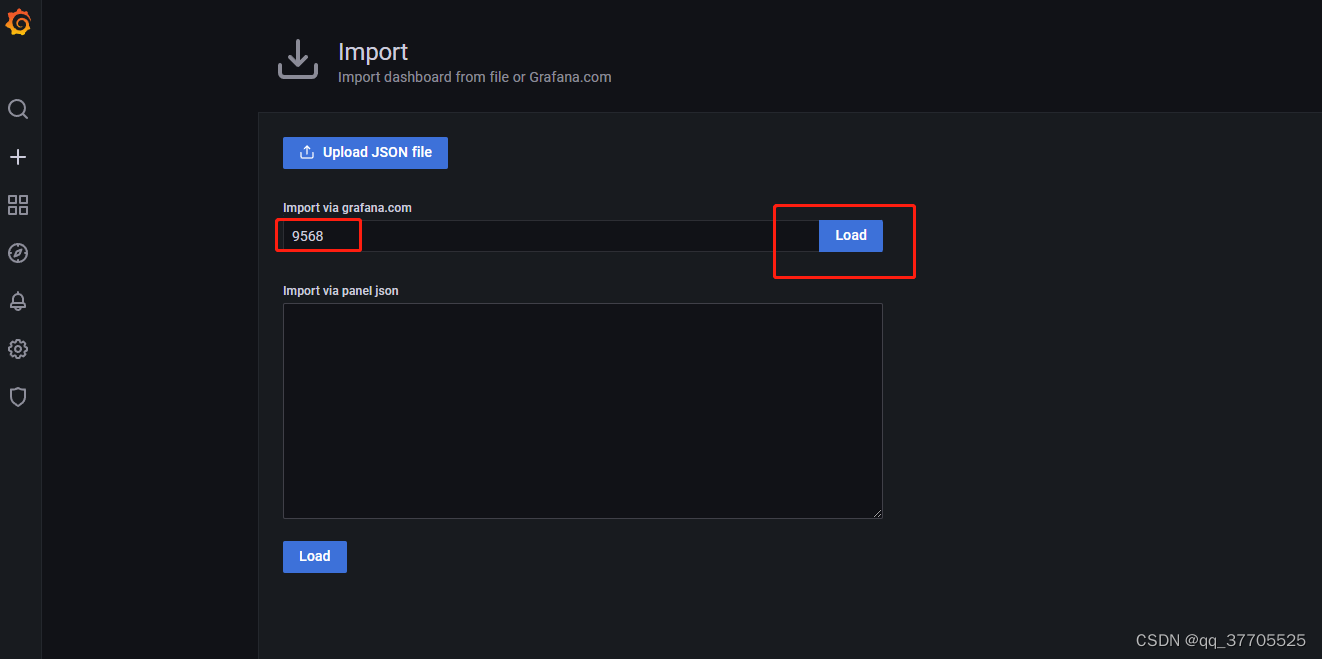
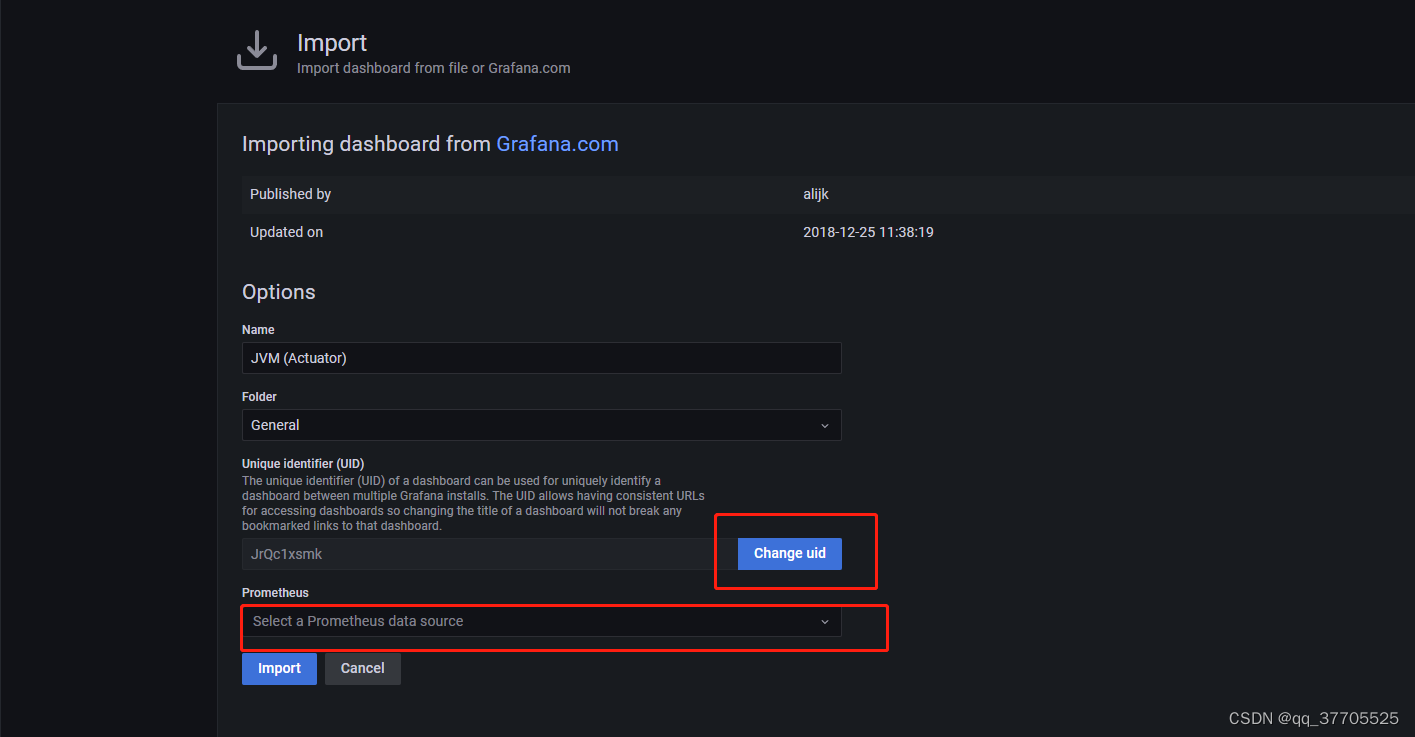
添加Dashboard
数据源配置成功后,选择Create->Import,在此界面上传或配置Dashboard,在https://github.com/percona/grafana-dashboards 这个项目,我们可以找到一些成熟的Dashboard配置,对于Linux监控可以选择 System_Overview.json,对于MySQL可以选择 MySQL_Overview.json,将这两个文件下载,依次选择 【Upload JSON file】按钮进行上传。
除了这个开源项目之外,Grafana还提供了官方的Dashboard市场:https://grafana.com/grafana/dashboards 。我们可以在这里找到各种数据源各种收集器的Dashboard配置。
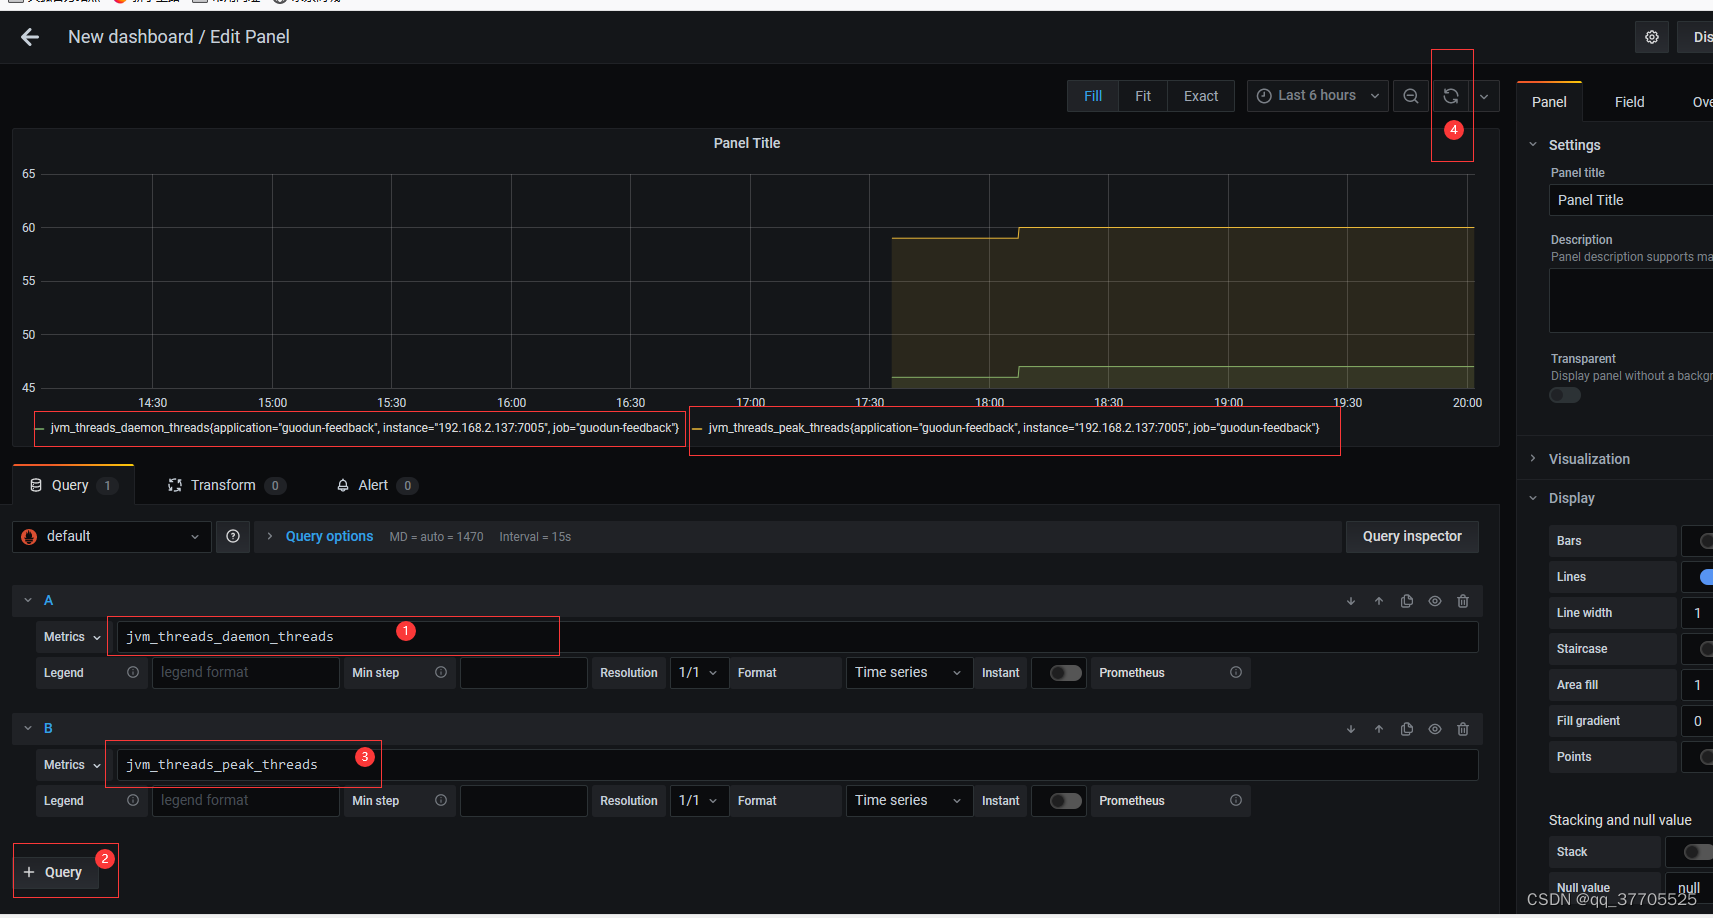
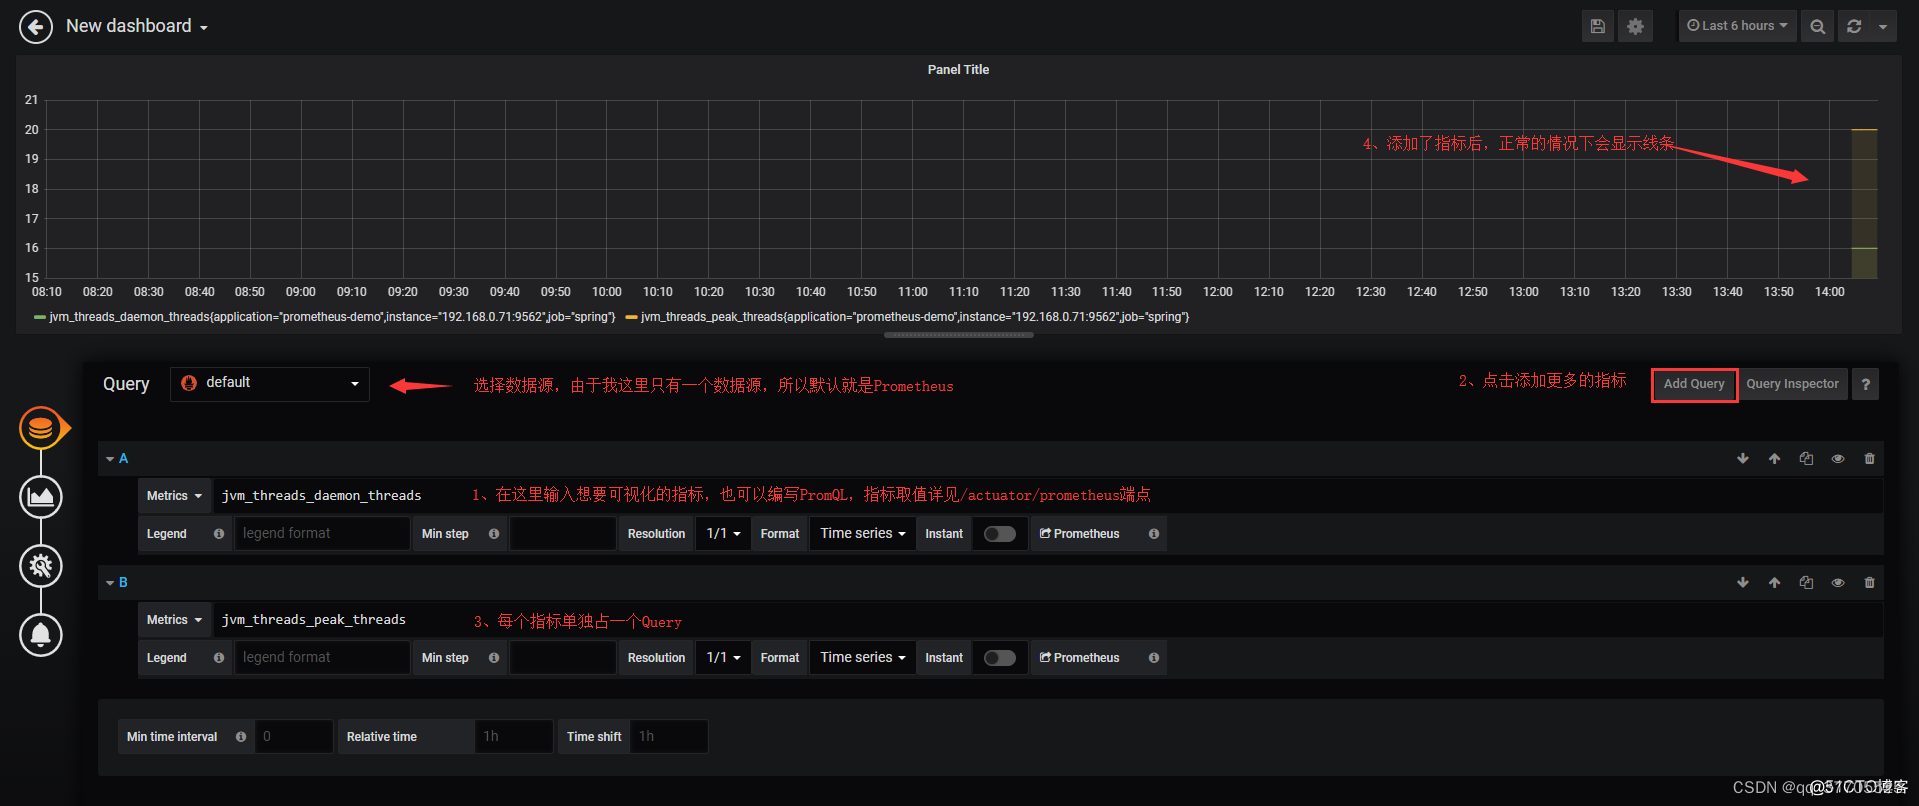
在红框标记的位置添加指标查询,指标的取值详见Spring Boot应用的 /actuator/prometheus 端点,例如jvm_memory_used_bytes 、jvm_threads_states_threads 、jvm_threads_live_threads 等。
Grafana会给你较好的提示,并且支持较为复杂的计算,例如聚合、求和、平均等。如果想要绘制多个线条,可点击Add Query 按钮。如上图所示,笔者为图表绘制了两条线,分别代表daemon以及peak线程。
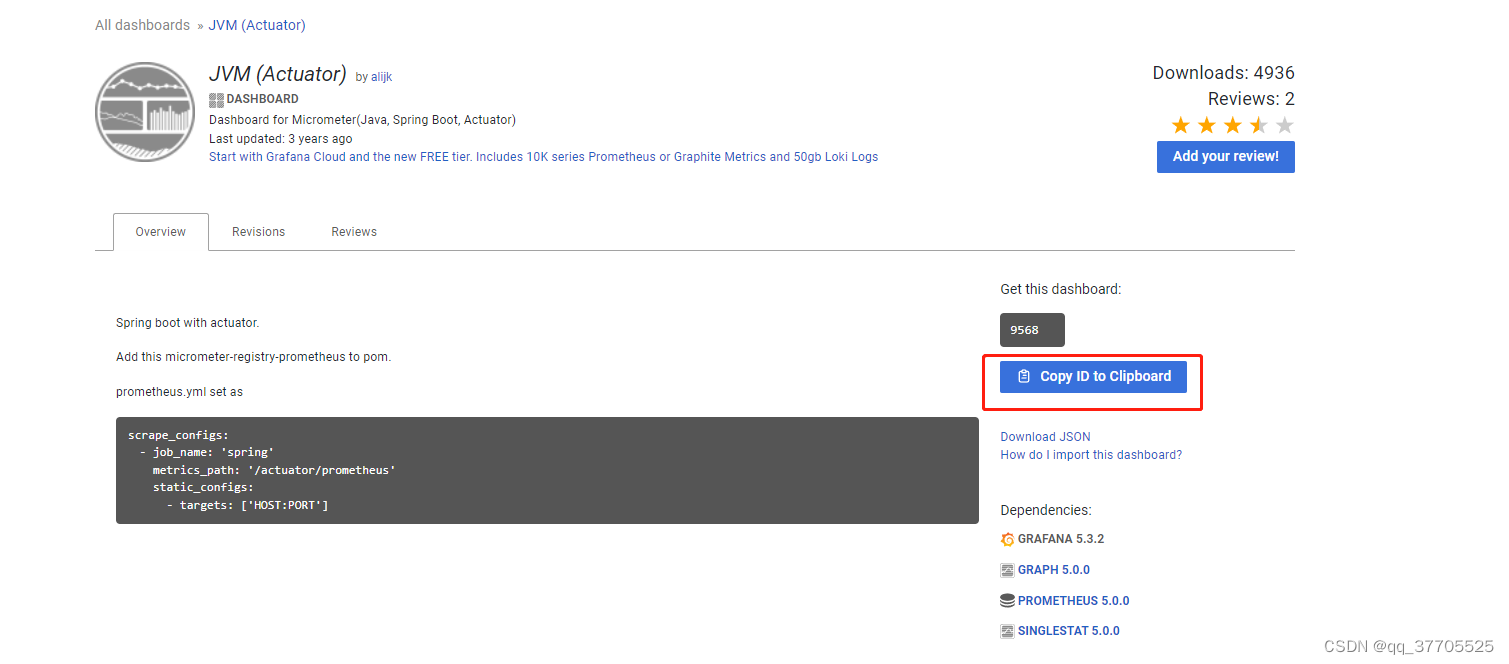
https://grafana.com/grafana/dashboards/9568
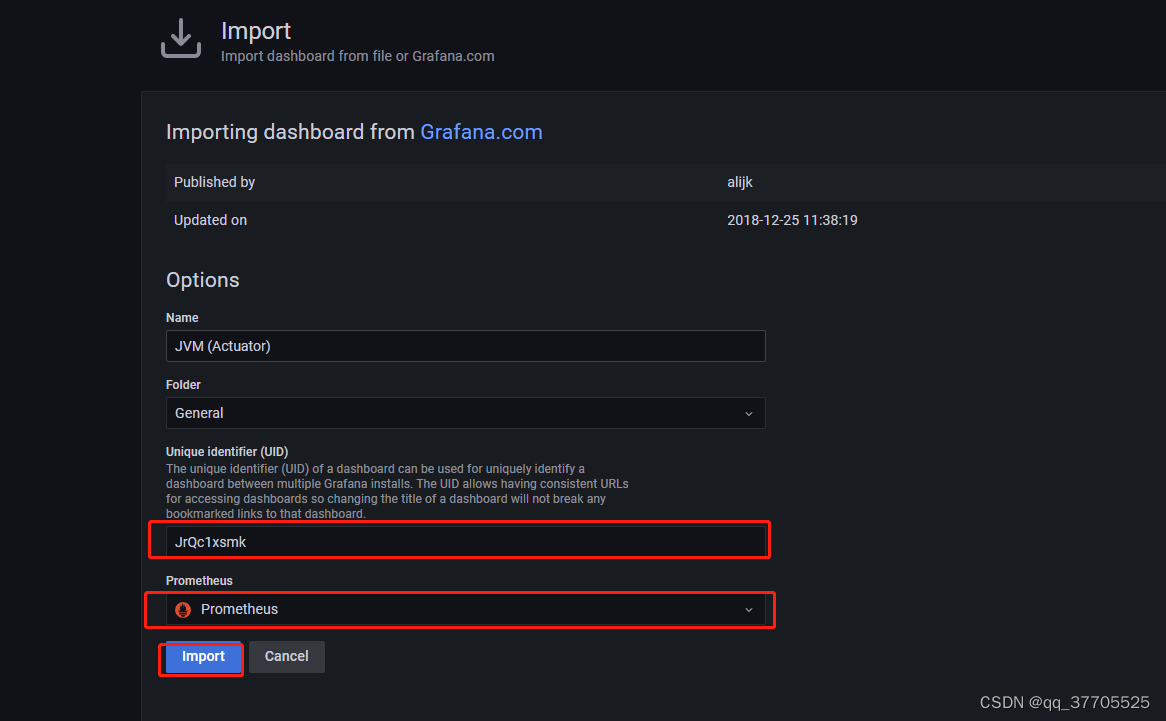
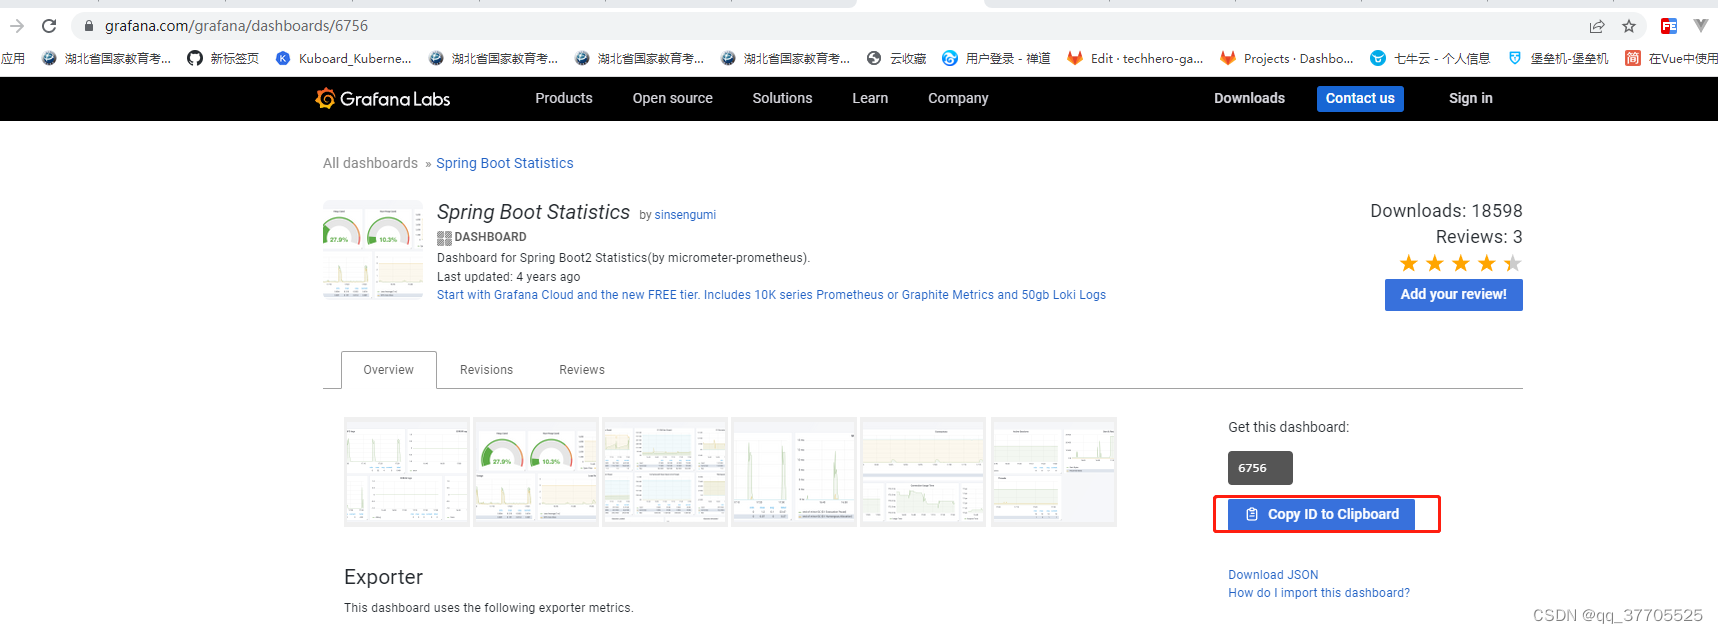
https://grafana.com/grafana/dashboards/6756
导入监控JVM的Dashboard模板,编号是 4701
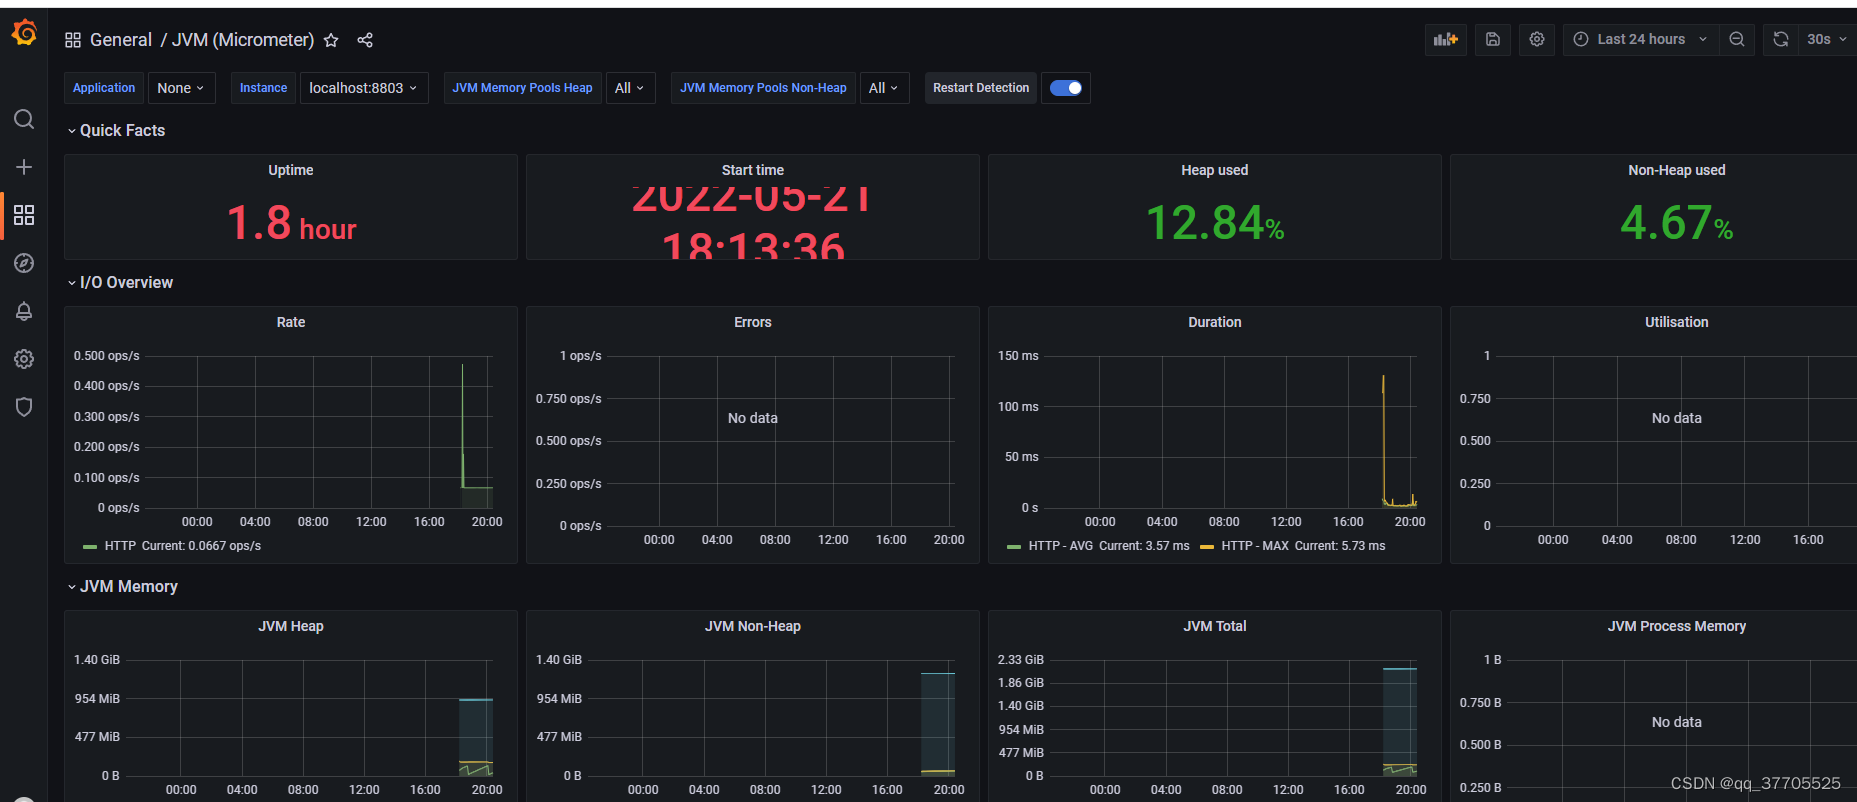
对于Springboot2,我选择了 https://grafana.com/grafana/dashboards/10280 作为配置,将10280填入第一个输入框,然后点击【load】。
比较好用的Dashboard
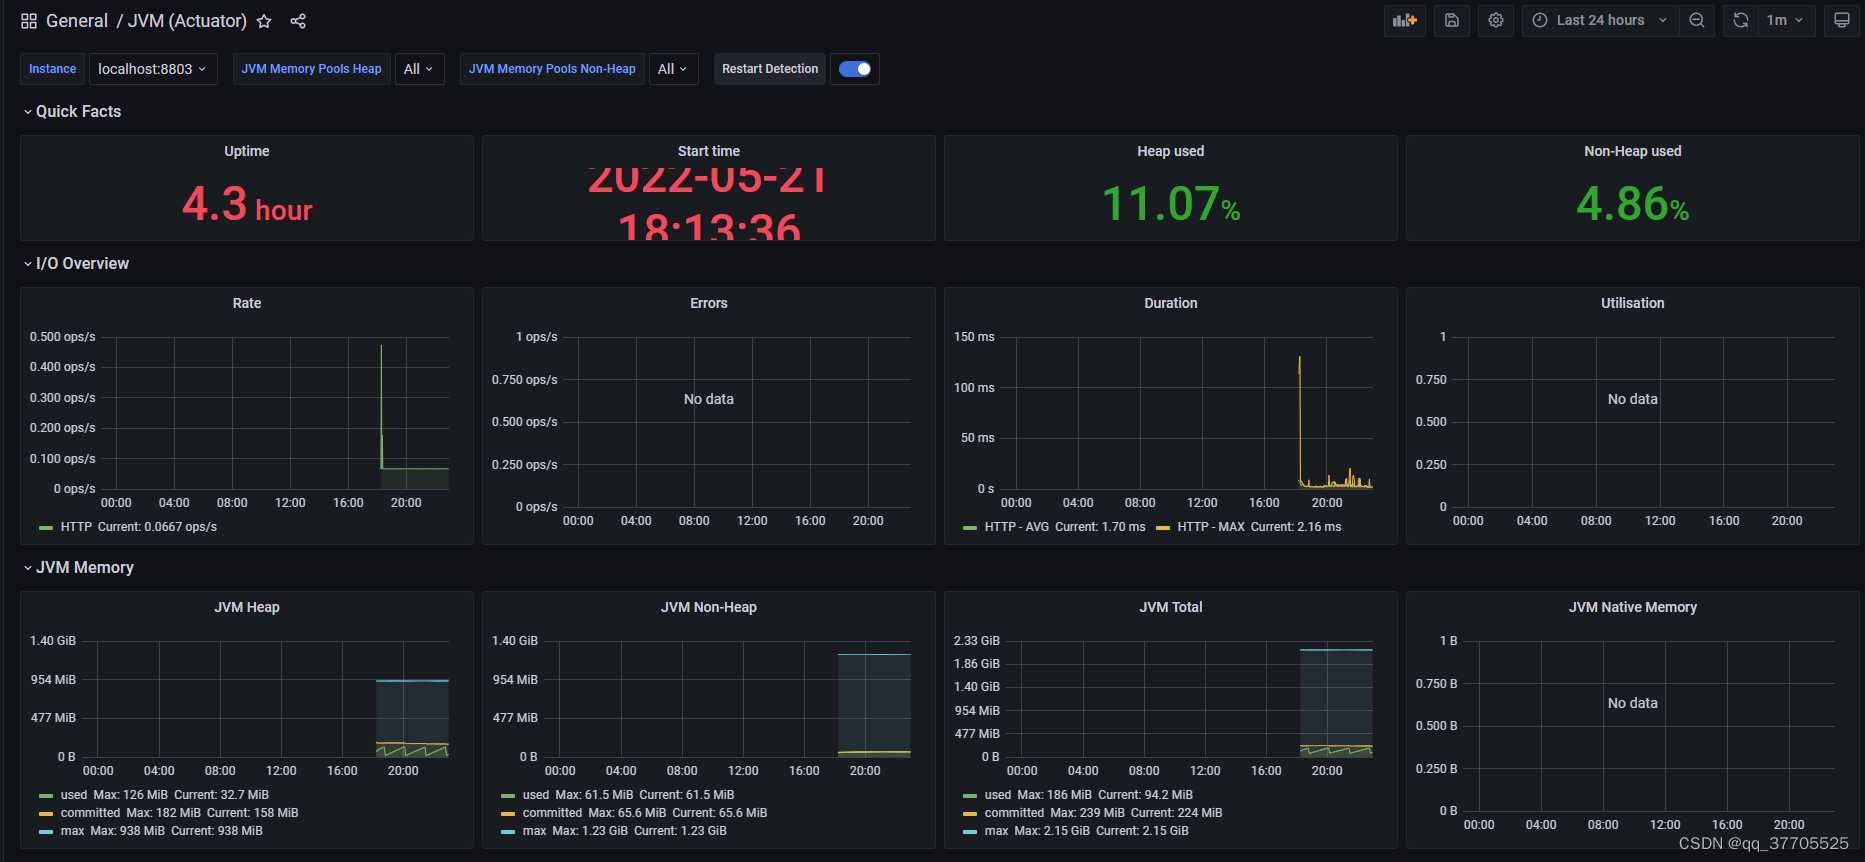
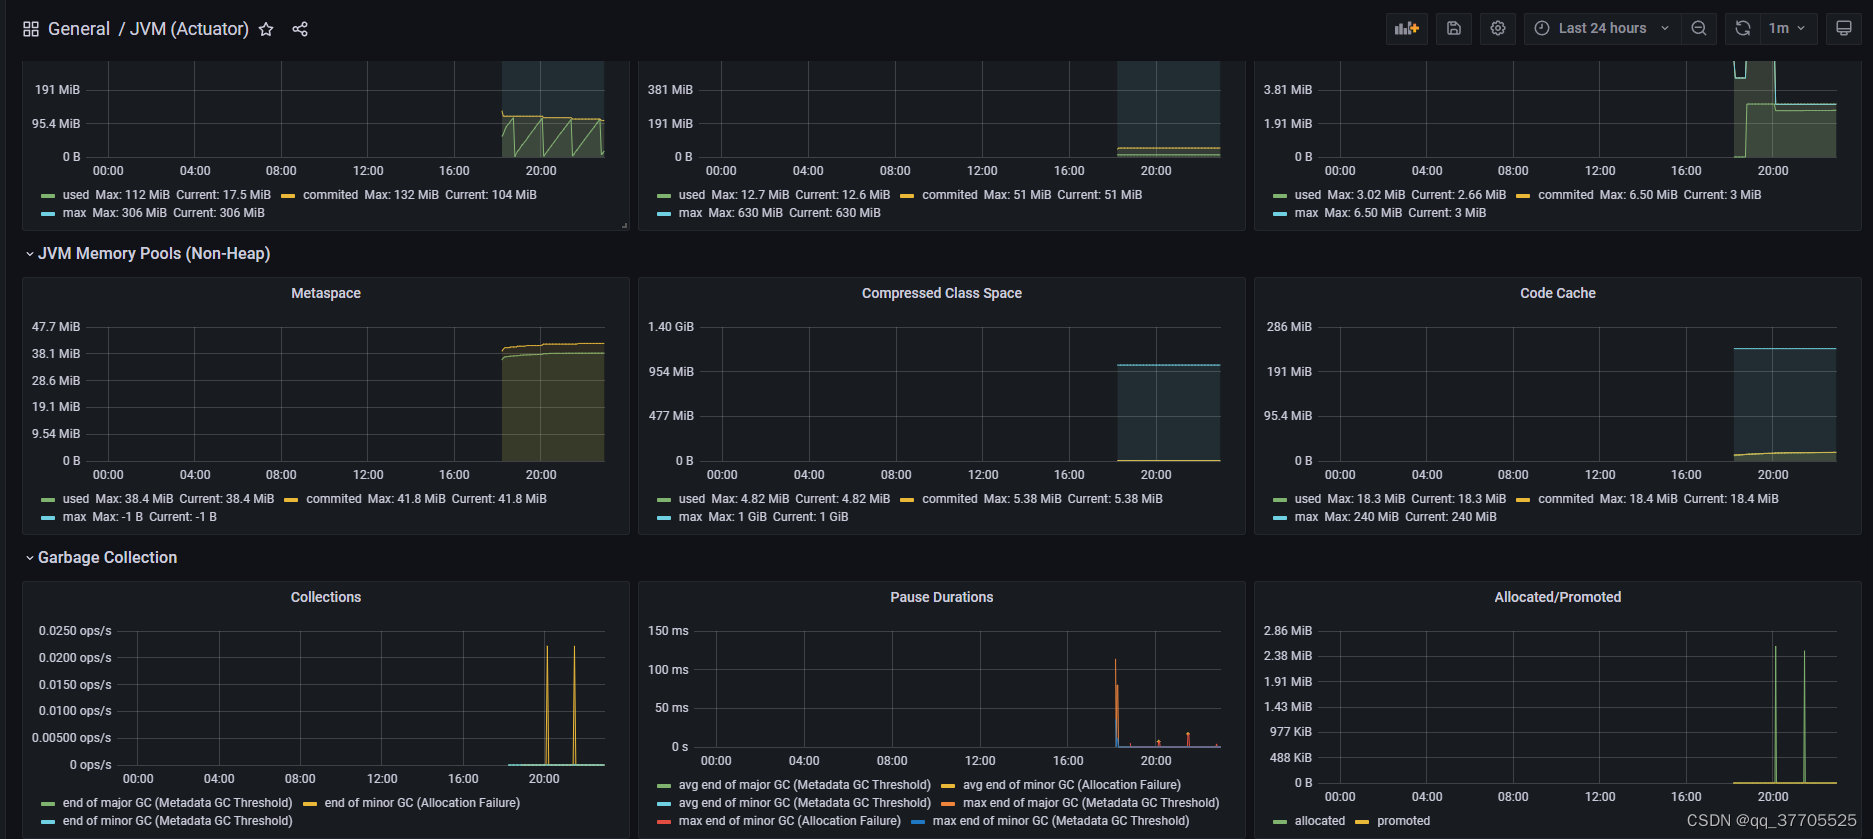
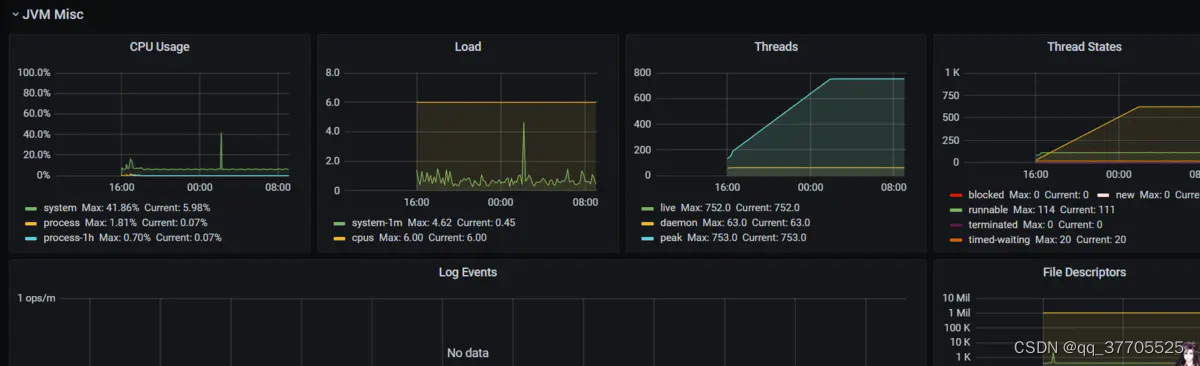
JVM (Micrometer)
JVM (Actuator)
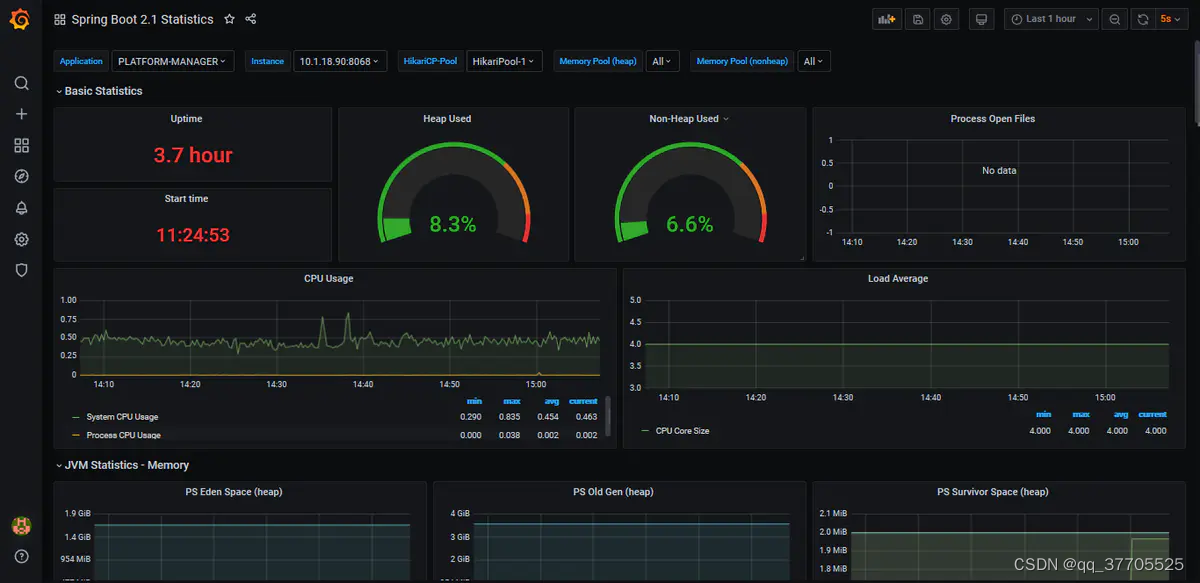
Spring Boot Statistics 注:该Dashboard可能有Bug,笔者未能直接测试成功,做了一些改动后才能正常显示。
以上三款是笔者亲测较为全面、好用的Dashboard,仅供参考。
告警
Grafana支持的告警渠道非常丰富,例如邮件、钉钉、Slack、Webhook等,非常实用!比较简单,各位看官自行研究下吧。
配套代码

为开发者提供学习成长、分享交流、生态实践、资源工具等服务,帮助开发者快速成长。
更多推荐


 7
7 0
0- 0


 已为社区贡献12条内容

所有评论(0)