python机器学习入门之matplotlib的使用(超详细,必看)
python机器学习入门之matplotlib的使用(超详细,必看) 包括散点图 直线图 条形图 三维图形等等的绘画
·
matplotlib是python的一个基本2D绘图库 功能强大
比较常用的是里面的pyplot子模块
常见函数有figure()创建一个空白画布 add_subplot()创建子图 title()设置标题
xlabel()设置x轴名称 ylabel()设置y轴名称 legend()指定图例 show()显示图形等等
实例一如下

代码如下
import pandas as pd
import numpy as np
from pandas import Series
from numpy import nan as NA
import matplotlib.pyplot as plt
from mpl_toolkits.mplot3d import Axes3D
fig=plt.figure()
ax1=fig.add_subplot(2,2,1)
ax2=fig.add_subplot(2,2,2)
ax3=fig.add_subplot(2,2,3)
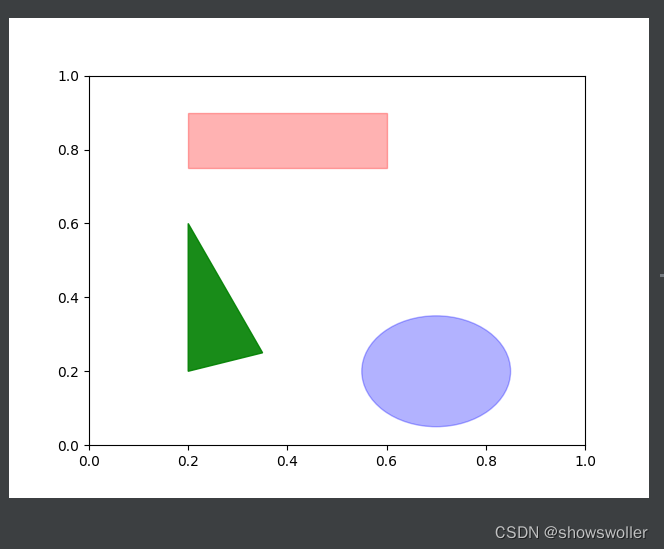
plt.show()2:在子图上绘制图形 如三角形 椭圆 矩形

代码如下
import pandas as pd
import numpy as np
from pandas import Series
from numpy import nan as NA
import matplotlib.pyplot as plt
from mpl_toolkits.mplot3d import Axes3D
ax=fig.add_subplot(1,1,1)
rect=plt.Rectangle((0.2,0.75),0.4,0.15,color='r',alpha=0.3)
cir=plt.Circle((0.7,0.2),0.15,color='b',alpha=0.3)
pgon=plt.Polygon([[0.2,0.2],[0.35,0.25],[0.2,0.6]],color='g',alpha=0.9)
ax.add_patch(rect)
ax.add_patch(cir)
ax.add_patch(pgon)
plt.show()
3:直线图的绘画

import pandas as pd
import numpy as np
from pandas import Series
from numpy import nan as NA
import matplotlib.pyplot as plt
from mpl_toolkits.mplot3d import Axes3D
a=np.arange(10)
plt.xlabel('x')
plt.ylabel('y')
plt.plot(a,a*1.5,a,a*2.5,a,a*3.5,a,a*4.5)
plt.legend(['1.5x','2.5x','3.5x','4.5x'])
plt.title('simple lines')
j=np.linspace(-10,10,100)
k=np.sin(j)
plt.plot(j,k,marker="o")
plt.show()
4:为series数据绘制图形

import numpy as np
from pandas import Series
from numpy import nan as NA
import matplotlib.pyplot as plt
from mpl_toolkits.mplot3d import Axes3D
s1=Series(np.random.randn(1000).cumsum())
s2=Series(np.random.randn(1000).cumsum())
plt.subplot(2,1,1)
ax1=s1.plot(kind='line',label='S1',title="figures of Series",style='--')
s2.plot(ax=ax1,kind='line',label='S2')
plt.ylabel('value')
plt.legend(loc=2)
plt.subplot(2,1,2)
s1[0:10].plot(kind='bar',grid=True,label='s1')
plt.xlabel('index')
plt.ylabel('value')
plt.show()
5:三维图形的绘画 虽说matplotlib主要用于二维图形绘制 但是三维的也可以画

import numpy as np
from pandas import Series
from numpy import nan as NA
import matplotlib.pyplot as plt
from mpl_toolkits.mplot3d import Axes3D
def randrange(n,randFloor,randceil):
    rnd=np.random.rand(n)
    return (randceil-randFloor)*rnd+randFloor
plt.rcParams['font.sans-serif']=['SimHei']
fig=plt.figure(figsize=(10,8))
ax=fig.add_subplot(111,projection="3d")
n=100
for zmin,zmax,c,m,l in[(4,15,'r','o','低值'),(13,40,'g','*','高值')]:
    x=randrange(n,0,20)
    y=randrange(n,0,20)
    z=randrange(n,zmin,zmax)
    ax.scatter(x,y,z,c=c,marker=m,label=l,s=z*6)
ax.set_xlabel("x-value")
ax.set_ylabel("y-value")
ax.set_zlabel("z-value")
ax.set_title("高低值 3D散点图",alpha=0.6,size=15,weight='bold')
ax.legend(loc="upper left")
plt.show()
觉得有帮助请点赞收藏喔

为开发者提供学习成长、分享交流、生态实践、资源工具等服务,帮助开发者快速成长。
更多推荐


 11
11 0
0- 0


 已为社区贡献9条内容

所有评论(0)