基于opencv的车道线识别(python)(极易实现)
简易车道线识别方法1.先上效果图1.1原图:1.2结果图2.源代码#1.canny边缘检测2.mask3.霍夫变换4.离群值过滤5.最小二乘拟合6.绘制直线import cv2import numpy as npimport matplotlib.pyplot as plt'''1.canny边缘检测'''img=cv2.imread('IMG_20210707_151326.jpg',cv2.I
·
简易车道线识别方法
1.先上效果图
1.1原图:

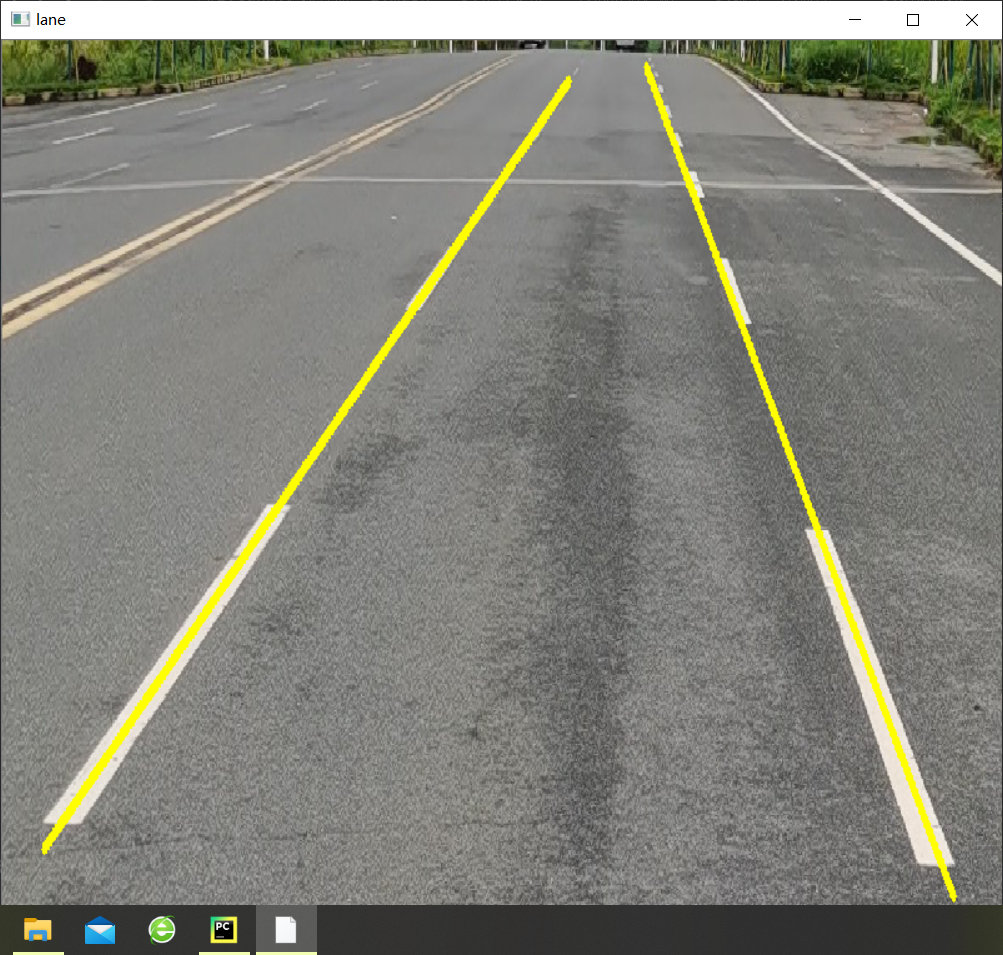
1.2结果图

2.源代码
#1.canny边缘检测  2.mask   3.霍夫变换   4.离群值过滤    5.最小二乘拟合     6.绘制直线

import cv2
import numpy as np
import matplotlib.pyplot as plt

'''1.canny边缘检测'''
img=cv2.imread('IMG_20210707_151326.jpg',cv2.IMREAD_GRAYSCALE)     #以灰度图形式读取图片,为canny边缘检测做准备
img0=cv2.imread("IMG_20210707_151326.jpg",cv2.IMREAD_COLOR)

edge_img=cv2.Canny(img,210,300)     #设定阈值,低于阈值被忽略,高于阈值被显示,
                                       # 阈值的设定与图片的色彩有关,需要手动调整到合适的值(使车道线清晰显示出来)

# plt.imshow(img)
# plt.show()
# #
# cv2.namedWindow('edge_img',0)
# cv2.resizeWindow('edge_img',500,800)
# cv2.imshow('edge_img',edge_img)
# cv2.waitKey(0)

'''2.roi_mask(提取感兴趣的区域)'''
mask=np.zeros_like(edge_img)   #变换为numpy格式的图片
mask=cv2.fillPoly(mask,np.array([[[0,460],[1150,470],[780,0],[650,0]]]),color=255)   #对感兴趣区域制作掩膜
#在此做出说明,实际上,车载相机固定于一个位置,所以对于感兴趣的区域的位置也相对固定,这个视相机位置而定。
cv2.namedWindow('mask',0)
cv2.resizeWindow('mask',800,1200)
cv2.imshow('mask',mask)
cv2.waitKey(0)
masked_edge_img=cv2.bitwise_and(edge_img,mask)   #与运算
# cv2.namedWindow('masked_edge_img',0)
# cv2.resizeWindow('masked_edge_img',800,1200)
# cv2.imshow('masked_edge_img',masked_edge_img)
# cv2.waitKey(0)


'''3.霍夫变换,找出直线'''
def calculate_slope(line):
    '''计算线段line的斜率
    :param Line:np.array([[x_1,y_1,x_2,y_2]])
    :return:
    '''
    x_1,y_1,x_2,y_2=line[0]
    return (y_2-y_1)/(x_2-x_1)


lines=cv2.HoughLinesP(masked_edge_img,1,np.pi/180,15,minLineLength=50,maxLineGap=20)    #获取所有线段

left_lines=[line for line in lines if calculate_slope(line)>0]
right_lines=[line for line in lines if calculate_slope(line)<0]


'''4.离群值过滤'''

def reject_abnormal_lines(lines,threshold):
    '''剔出斜率不一致的线段'''
    slopes=[calculate_slope(line) for line in lines]
    while len(lines)>0:
        mean=np.mean(slopes)
        diff=[abs(s-mean) for s in slopes]
        idx=np.argmax(diff)
        if diff[idx]>threshold:
            slopes.pop(idx)
            lines.pop(idx)
        else:
            break
    return lines
print(len(left_lines),len(right_lines))

reject_abnormal_lines(left_lines,threshold=0.1)
reject_abnormal_lines(right_lines,threshold=0.1)
print(len(left_lines),len(right_lines))


'''5.最小二乘拟合 把识别到的多条线段拟合成一条直线'''
  #np.ravel: 将高维数组拉成一维数组
# np.polyfit:多项式拟合
#np.polyval: 多项式求值

def least_squares_fit(lines):

    x_coords=np.ravel([[line[0][0],line[0][2]] for line in lines])
    y_coords = np.ravel([[line[0][1], line[0][3]] for line in lines])   #取出所有标点
    poly=np.polyfit(x_coords,y_coords,deg=1)                             #进行直线拟合,得到多项式系数
    point_min=(np.min(x_coords),np.polyval(poly,np.min(x_coords)))
    point_max = (np.max(x_coords), np.polyval(poly, np.max(x_coords)))     #根据多项式系数,计算两个直线上的点
    return np.array([point_min,point_max],dtype=np.int64)

left_lines=least_squares_fit(left_lines)
right_lines=least_squares_fit(right_lines)

'''6.直线绘制'''
cv2.line(img0,tuple(left_lines[0]),tuple(left_lines[1]),color=(0,255,255),thickness=5)
cv2.line(img0,tuple(right_lines[0]),tuple(right_lines[1]),color=(0,255,255),thickness=5)

cv2.namedWindow('lane',0)
cv2.resizeWindow('lane',800,1200)
cv2.imshow('lane',img0)
cv2.waitKey(0)
各个代码块都有对应的注释,有不明白的可以留言。
3.阈值脚本
为了方便找出合适的阈值,这里有一个脚本:
import cv2

cv2.namedWindow('edge_detection',0)
cv2.resizeWindow('edge_detection',500,800)
cv2.createTrackbar('minThreshold','edge_detection',50,1000,lambda x: x)
cv2.createTrackbar('maxThreshold','edge_detection',100,1000,lambda x: x)

img=cv2.imread('IMG_20210707_151326.jpg',cv2.IMREAD_GRAYSCALE)
while True:
    minThreshold=cv2.getTrackbarPos('minThreshold','edge_detection')
    maxThreshold=cv2.getTrackbarPos('maxThreshold','edge_detection')
    edges=cv2.Canny(img,minThreshold,maxThreshold)
    cv2.imshow('edge_detection',edges)
    cv2.waitKey(10)
可以拖动上面的阈值,看到对应的边缘检测的结果
不清晰的图如下

清晰的图如下:

4.谈谈优缺点
优点:
代码极其简单,易于实现,对于初学者来说具有可操作性,且可以起到鼓舞初学者的作用。
缺点:
这个车道线检测的方法缺点很明显,或者说还需要改进的地方
1.无法自动对合适的阈值进行选择,即无法自动给出最合适的边缘检测;
2.对于mask的选取有待优化
3.对弯道处的车道线检测效果不佳

华为开发者空间,是为全球开发者打造的专属开发空间,汇聚了华为优质开发资源及工具,致力于让每一位开发者拥有一台云主机,基于华为根生态开发、创新。
更多推荐


 8
8 1
1- 0


 已为社区贡献2条内容

所有评论(0)