Python matplotlib 作图(一、线条颜色、类型设置)
目录1、线条颜色、类型设置matplotlib颜色表线段类型大全参考1、线条颜色、类型设置#颜色设置:color='g'#线的类型:linestyle='-'#线的粗细:linewidth=5plt.scatter(df_2012[vnlCol], df_2012[srNLCol], color='g')plt.plot(xlst, xlst, color='r', linestyle=':')
·
目录
1、线条颜色、类型设置
#颜色设置:color='g'
#线的类型:linestyle='-'
#线的粗细:linewidth=5
plt.scatter(df_2012[vnlCol], df_2012[srNLCol], color='g')
plt.plot(xlst, xlst, color='r', linestyle=':')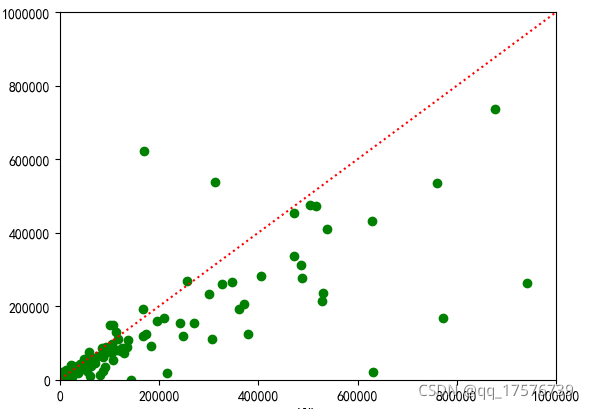
matplotlib颜色表
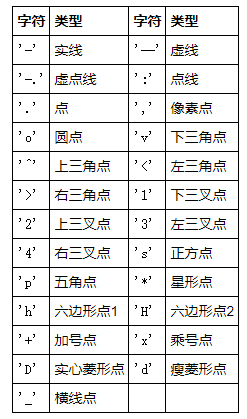
 线段类型大全
参考
1、线条设置(颜色、粗细、类型)

为开发者提供学习成长、分享交流、生态实践、资源工具等服务,帮助开发者快速成长。
更多推荐


 8
8 1
1- 0


 已为社区贡献2条内容

所有评论(0)