
基于 python 的银行信贷风险评估预测
信贷业务又称为信贷资产或贷款业务,是商业银行最重要的资产业务,通过放款收回本金和利息,扣除成本后获得利润,所以信贷是商业银行的主要赢利手段。信用风险是金融监管机构重点关注的风险,关乎金融系统运行的稳定,银行会根据客户的资质来评定,比如征信,贷款额度,贷款的用途,贷款的时间,还款的能力,收入的稳定性等多方面去分析。...
温馨提示:文末有 CSDN 平台官方提供的学长 QQ 名片 :)
1. 项目背景
信贷业务又称为信贷资产或贷款业务,是商业银行最重要的资产业务,通过放款收回本金和利息,扣除成本后获得利润,所以信贷是商业银行的主要赢利手段。
信用风险是金融监管机构重点关注的风险,关乎金融系统运行的稳定,银行会根据客户的资质来评定,比如征信,贷款额度,贷款的用途,贷款的时间,还款的能力,收入的稳定性等多方面去分析。
B站详情与代码下载:基于Python的银行信贷风险评估预测_哔哩哔哩_bilibili
基于Python的银行信贷风险评估预测
2. 任务描述
利用用户基础信息、行为数据,预测用户违约的可能性。
数据集:
- 训练集:102030 条
- 测试集:30000 条
(1) 用户基本属性信息
- id: 用户唯一标识
- certId:证件号
- gender:性别
- age:年龄
- dist:所在地区
- edu:学历
- job:工作单位类型
- ethnic:民族
- highestEdu:最高学历
- certValidBegin:证件号起始日
- certValidStop:证件号失效日
(2)借贷相关信息
- loanProduct:借贷产品类型
- lmt:预授信金额
- basicLevel:基础评级
- bankCard:放款卡号
- residentAddr:居住地
- linkRela:联系人关系
- setupHour:申请时段
- weekday:申请日
(3) 用户征信相关信息
- ncloseCreditCard:失效信用卡数
- unpayIndvLoan:未支付个人贷款金额
- unpayOtherLoan:未支付其他贷款金额
- unpayNormalLoan:未支付贷款平均金额
- 5yearBadloan:五年内未支付贷款金额
- x_0至x_78:该部分数据涉及较为第三方敏感信用数据,匿名化处理,不影响建模和数据分析
3. 数据探索式分析
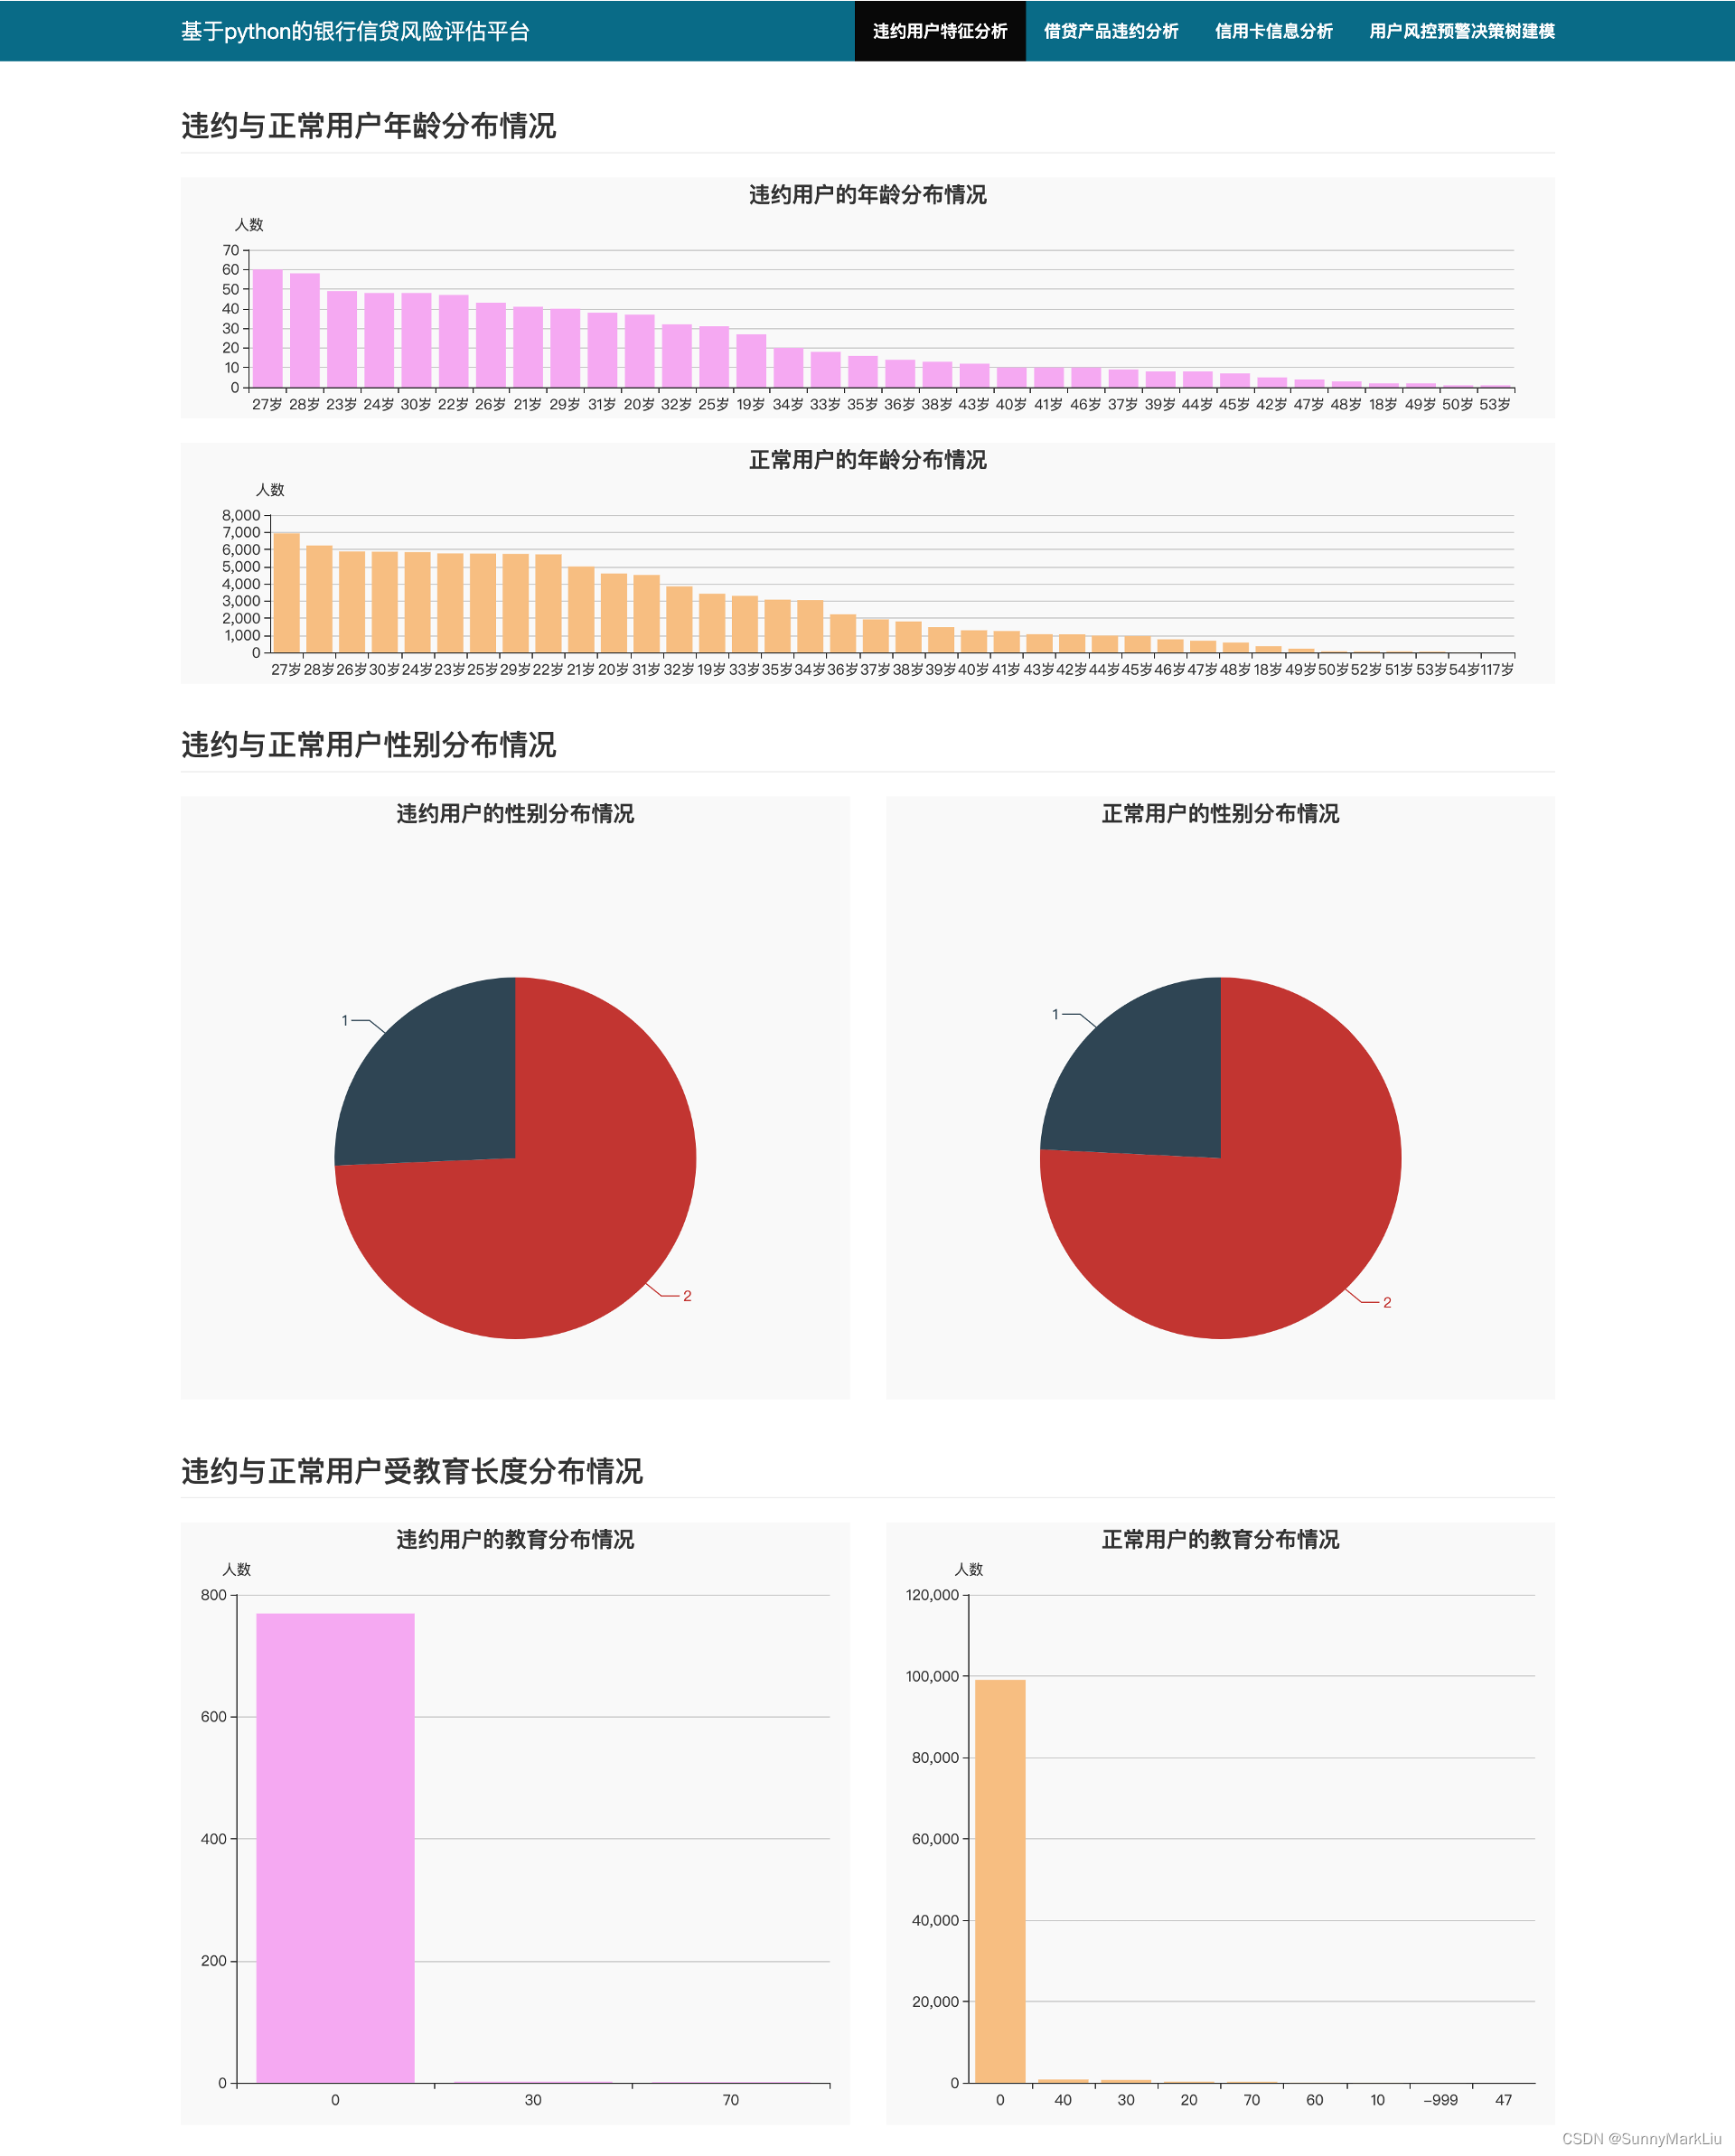
(1)违约用户数量分布
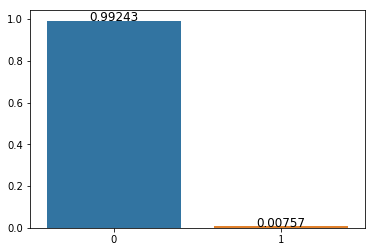
可以看出,违约的用户较少,只占0.7%,样本不均衡,评测指标需要采用 AUC 或 F1 指标,本实验中采用 AUC 指标。
(2)违约用户性别分布
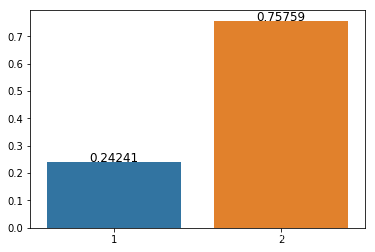
可以看出,违约用户的年龄差别较大,大部分为男性 gender=1
(3)违约用户年龄分布
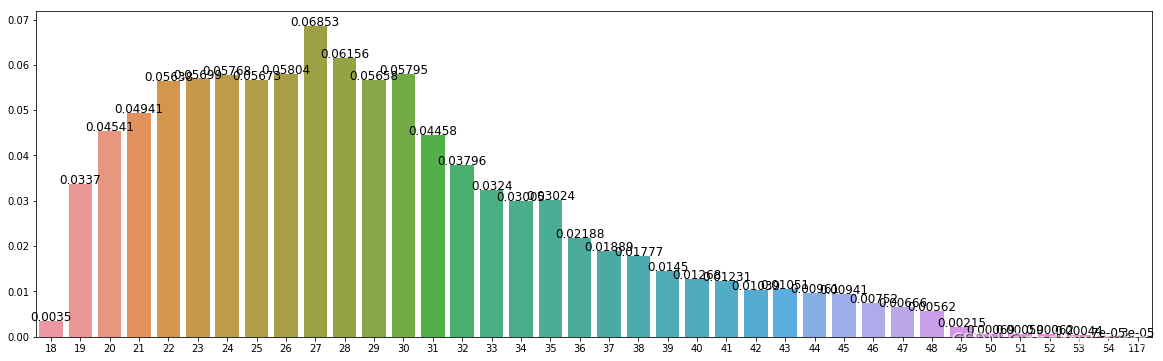
可以看出,违约用户年龄集中在 19-35 岁之间。
(4)违约用户教育程度分布
(5)违约用户工作单位类型分布
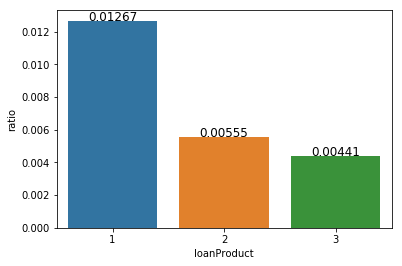
(6)不同借贷产品类型的违约比例分布
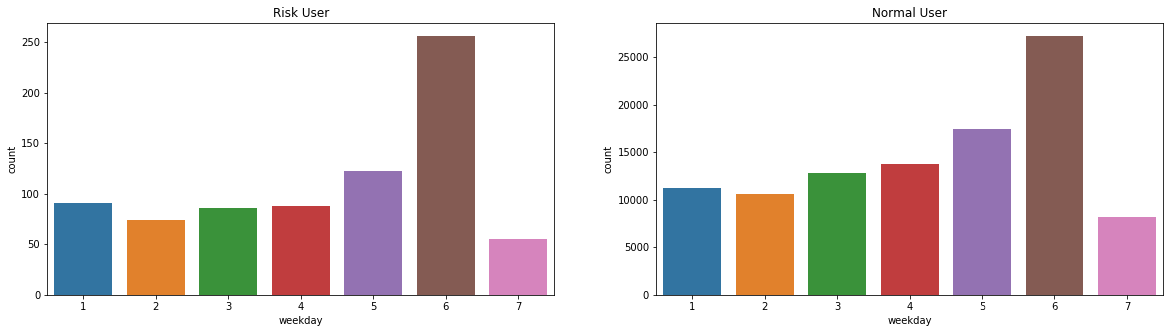
(7) 不同借贷产品类型的违约随时间变化趋势
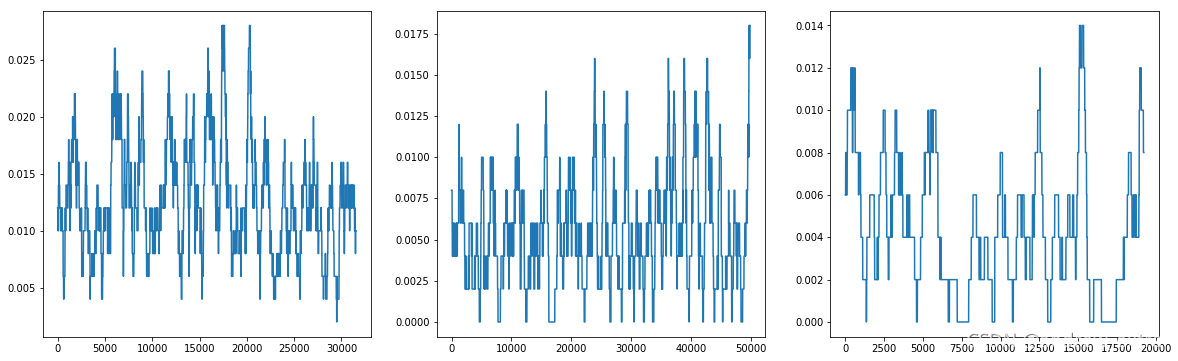
不同借贷产品类型的违约随时间变化存在一定的周期性。
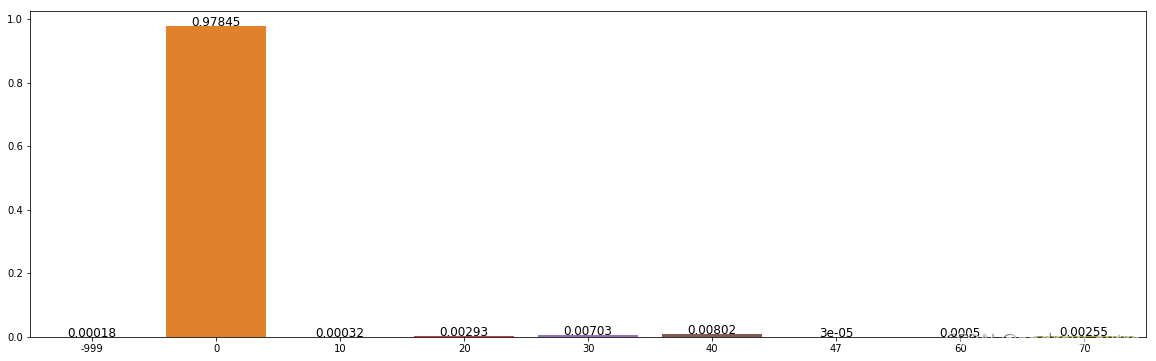
(8)预授信金额分布 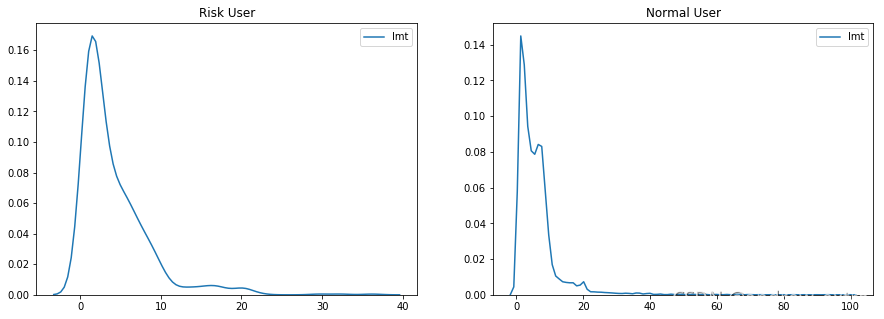
可以看出,预授信金额大于40的,都为风险用户。
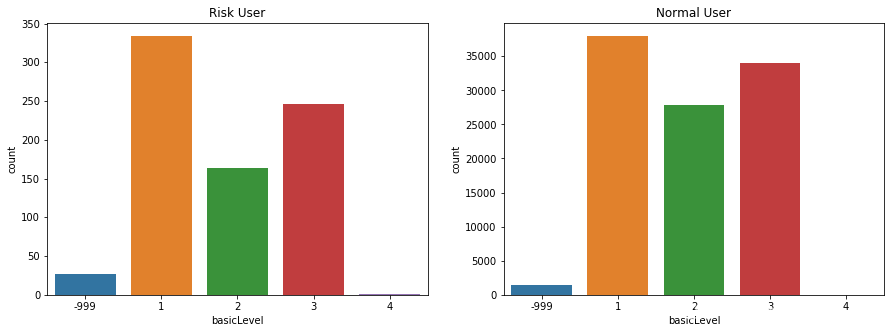
(9)基础评级分布
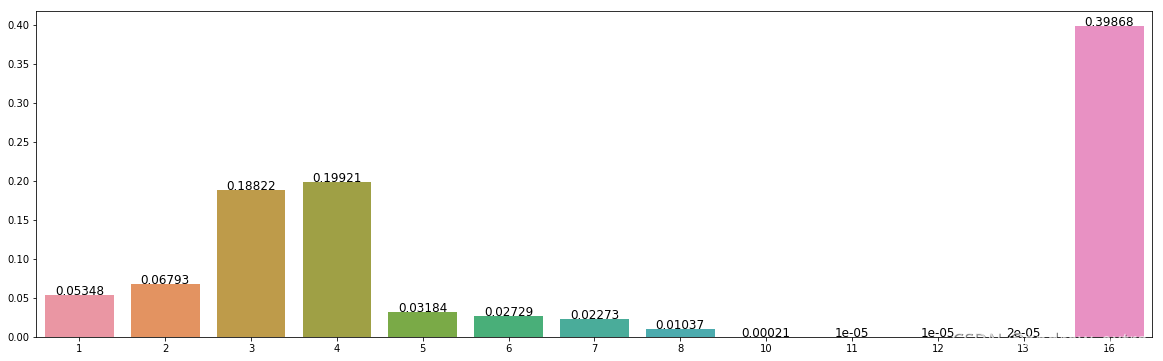
(10)用户的民族分布情况
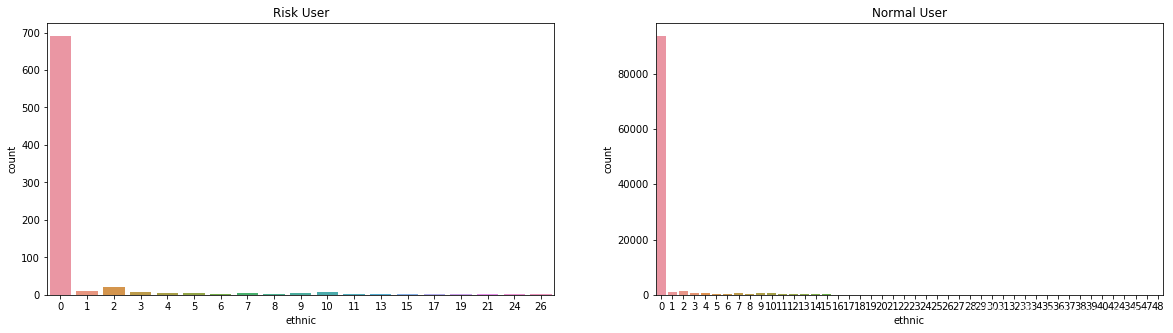
民族类别大于26编号的,大都为有风险用户
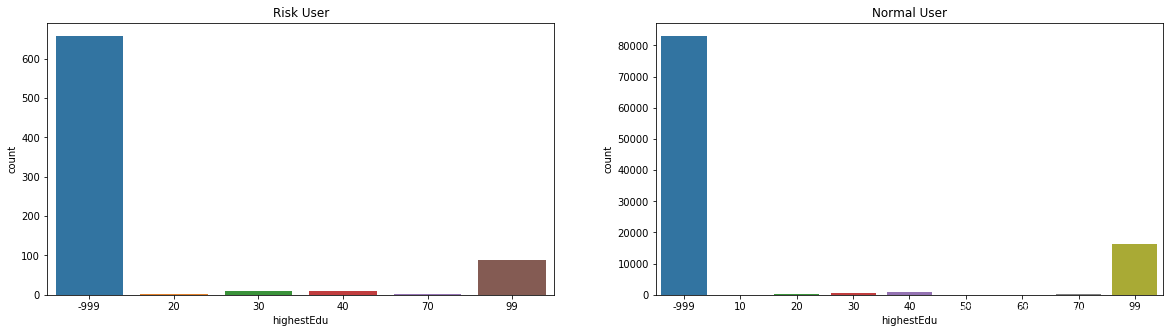
(11)用户最高学历分布情况
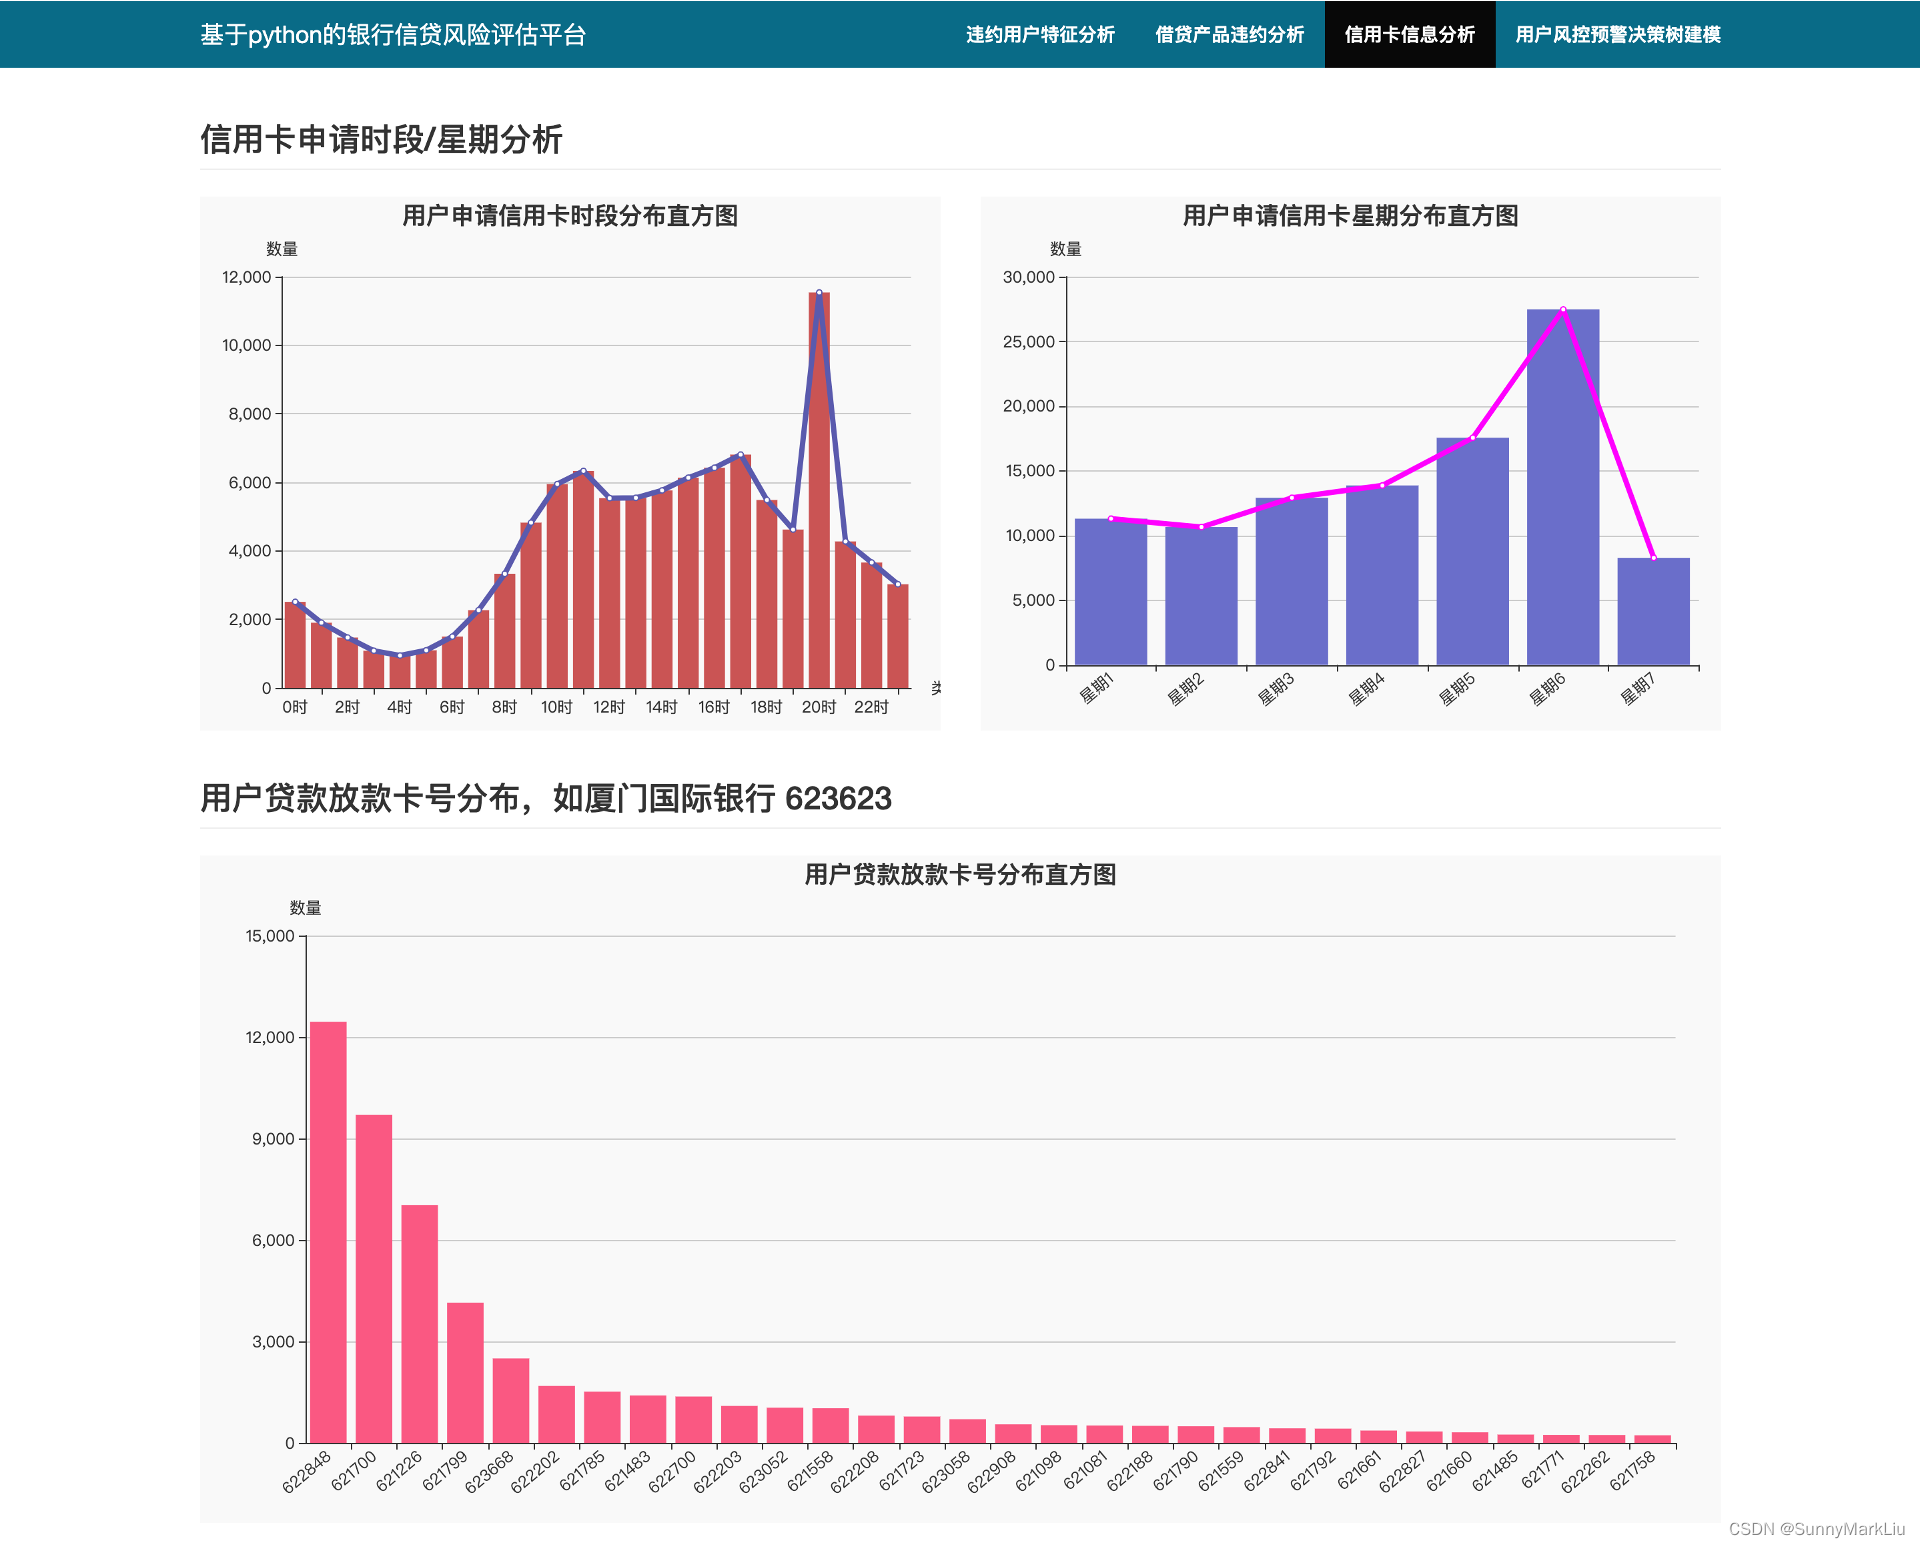
(12)用户申请信用卡时段分布
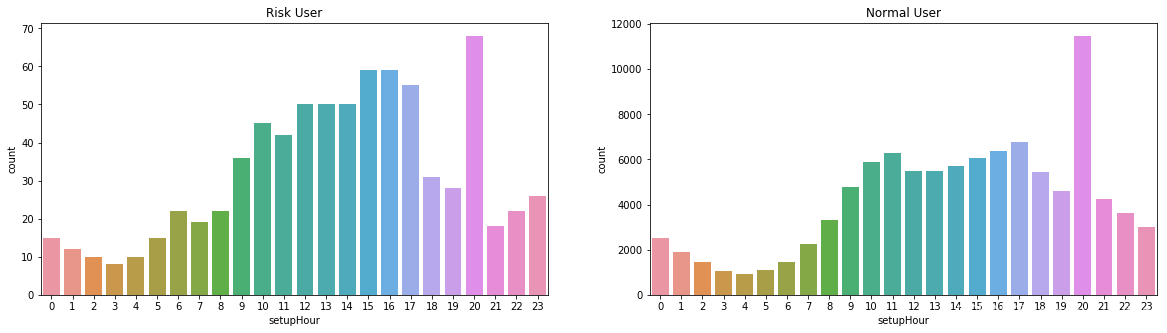
申请信用卡的时段大都集中在白天,晚上20时存在峰值。
(13)用户申请信用卡时段分布
(14)用户第三方敏感信用数据相关性分析

4. 利用决策树模型构建用户风控预警
XGBoost是一套提升树可扩展的机器学习系统。目标是设计和构建高度可扩展的端到端提升树系统。提出了一个理论上合理的加权分位数略图来计算候选集。引入了一种新颖的稀疏感知算法用于并行树学习。提出了一个有效的用于核外树形学习的缓存感知块结构。用缓存加速寻找排序后被打乱的索引的列数据的过程。XGBoost是一个树集成模型,他将K(树的个数)个树的结果进行求和,作为最终的预测值。
import xgboost as xgb
from sklearn.model_selection import train_test_split
from sklearn.metrics import auc, roc_curve
from sklearn.metrics import accuracy_score, precision_score, recall_score
def evaluate_score(predict, y_true):
"""定义评估函数"""
false_positive_rate, true_positive_rate, thresholds = roc_curve(y_true, predict, pos_label=1)
auc_score = auc(false_positive_rate, true_positive_rate)
return auc_score划分训练集、验证集:
df_columns = train_df.columns.values
print('===> feature count: {}'.format(len(df_columns)))

scale_pos_weight = 1
print('scale_pos_weight = ', scale_pos_weight)

xgb_params = {
    'eta': 0.01,
    'min_child_weight': 20,
    'colsample_bytree': 0.5,
    'max_depth': 15,
    'subsample': 0.9,
    'lambda': 2.0,
    'scale_pos_weight': scale_pos_weight,
    'eval_metric': 'auc',
    'objective': 'binary:logistic',
    'nthread': -1,
    'silent': 1,
    'booster': 'gbtree'
}

X_train, X_valid, y_train, y_valid = train_test_split(train_df, y_train_all, test_size=0.1, random_state=42)
print('train: {}, valid: {}, test: {}'.format(X_train.shape[0], X_valid.shape[0], test_df.shape[0]))

dtrain = xgb.DMatrix(X_train, y_train, feature_names=df_columns)
dvalid = xgb.DMatrix(X_valid, y_valid, feature_names=df_columns)

watchlist = [(dtrain, 'train'), (dvalid, 'valid')]
===> feature count: 103
scale_pos_weight = 1
train: 91826, valid: 10203, test: 30000模型训练:
model = xgb.train(dict(xgb_params),
                      dtrain,
                      evals=watchlist,
                      verbose_eval=50,
                      early_stopping_rounds=100,
                      num_boost_round=4000)
[0] train-auc:0.5 valid-auc:0.5
Multiple eval metrics have been passed: 'valid-auc' will be used for early stopping.
Will train until valid-auc hasn't improved in 100 rounds.
[50] train-auc:0.639548 valid-auc:0.651928
[100] train-auc:0.652366 valid-auc:0.657508
[150] train-auc:0.669879 valid-auc:0.723684
[200] train-auc:0.69299 valid-auc:0.735565
[250] train-auc:0.722687 valid-auc:0.736952
[300] train-auc:0.747475 valid-auc:0.744529
[350] train-auc:0.774007 valid-auc:0.739398
[400] train-auc:0.793543 valid-auc:0.743075
Stopping. Best iteration:
[300] train-auc:0.747475 valid-auc:0.744529特征重要程度情况:
ax = xgb.plot_importance(model)
fig = ax.figure
fig.set_size_inches(15,10)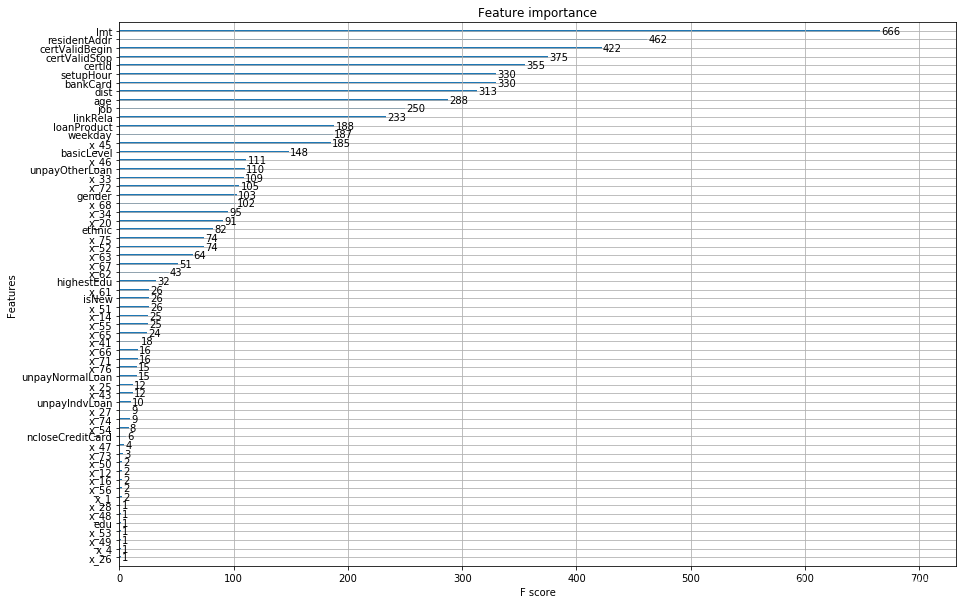
ROC 曲线:
fpr, tpr, _ = roc_curve(y_valid, predict_valid)
roc_auc = auc(fpr, tpr)
plt.figure(figsize=(10,10))
plt.plot(fpr, tpr, color='darkorange',
         lw=2, label='ROC curve (area = %0.2f)' % roc_auc)
plt.plot([0, 1], [0, 1], color='navy', lw=2, linestyle='--')
plt.xlim([-0.02, 1.0])
plt.ylim([0.0, 1.05])
plt.xlabel('False Positive Rate')
plt.ylabel('True Positive Rate')
plt.title('ROC curve')
plt.legend(loc="lower right")
plt.show()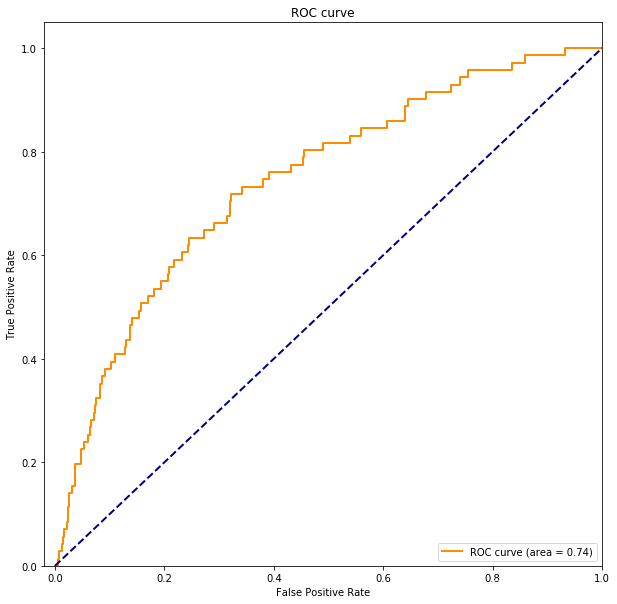
通过交叉训练选取最佳迭代次数,利用最佳迭代次数,再次利用全量数据训练模型。
print('---> cv train to choose best_num_boost_round')
dtrain_all = xgb.DMatrix(train_df.values, y_train_all, feature_names=df_columns)

cv_result = xgb.cv(dict(xgb_params),
                   dtrain_all,
                   num_boost_round=4000,
                   early_stopping_rounds=100,
                   verbose_eval=100,
                   show_stdv=False,
                   )
best_num_boost_rounds = len(cv_result)
mean_train_logloss = cv_result.loc[best_num_boost_rounds-11 : best_num_boost_rounds-1, 'train-auc-mean'].mean()
mean_test_logloss = cv_result.loc[best_num_boost_rounds-11 : best_num_boost_rounds-1, 'test-auc-mean'].mean()
print('best_num_boost_rounds = {}'.format(best_num_boost_rounds))

print('mean_train_auc = {:.7f} , mean_test_auc = {:.7f}\n'.format(mean_train_logloss, mean_test_logloss))

print('---> training on total dataset to predict test and submit')
model = xgb.train(dict(xgb_params),
                  dtrain_all,
                  num_boost_round=best_num_boost_rounds)

# predict validate
predict_valid = model.predict(dvalid)
valid_auc = evaluate_score(predict_valid, y_valid)
print('预测的验证集 AUC 指标:', valid_auc)
输出:
---> cv train to choose best_num_boost_round
[0]	train-auc:0.5	test-auc:0.5
[100]	train-auc:0.659016	test-auc:0.652021
[200]	train-auc:0.697244	test-auc:0.668177
[300]	train-auc:0.748579	test-auc:0.681215
[400]	train-auc:0.793036	test-auc:0.692158
[500]	train-auc:0.817169	test-auc:0.695392
[600]	train-auc:0.833562	test-auc:0.696997
[700]	train-auc:0.849179	test-auc:0.698894
[800]	train-auc:0.862994	test-auc:0.700422
[900]	train-auc:0.876222	test-auc:0.700347
best_num_boost_rounds = 806
mean_train_auc = 0.8630149 , mean_test_auc = 0.7004321

---> training on total dataset to predict test and submit

预测的验证集 AUC 指标: 0.8955227615197701
5. 模型性能评估
根据用户基本信息和借款,信用卡消费记录等数据构建模型去判断这个用户是否会发生逾期的风险。
dtest = xgb.DMatrix(test_df, feature_names=df_columns)
# 模型预测
predict_test = model.predict(dtest)

predict_test_label = predict_test > 0.01
acc = accuracy_score(predict_test_label, test_ground_truth)
print('新用户测试集预测准确率:', acc)
test_auc = evaluate_score(predict_test, test_ground_truth)
print('新用户测试集 AUC 指标:', test_auc)
输出:
新用户测试集预测准确率: 0.9937666666666667
新用户测试集 AUC 指标: 0.7237239577681273
6. 基于python的银行信贷风险评估平台
在完成数据的探索式分析和机器学习算法建模之后,我们利用 flask + bootstrap + echarts 搭建银行信贷风险评估平台,其可视化效果如下:
6.1 系统注册登录

6.2 违约用户特征分析
 6.3 借贷产品违约分析

6.4 信用卡信息分析
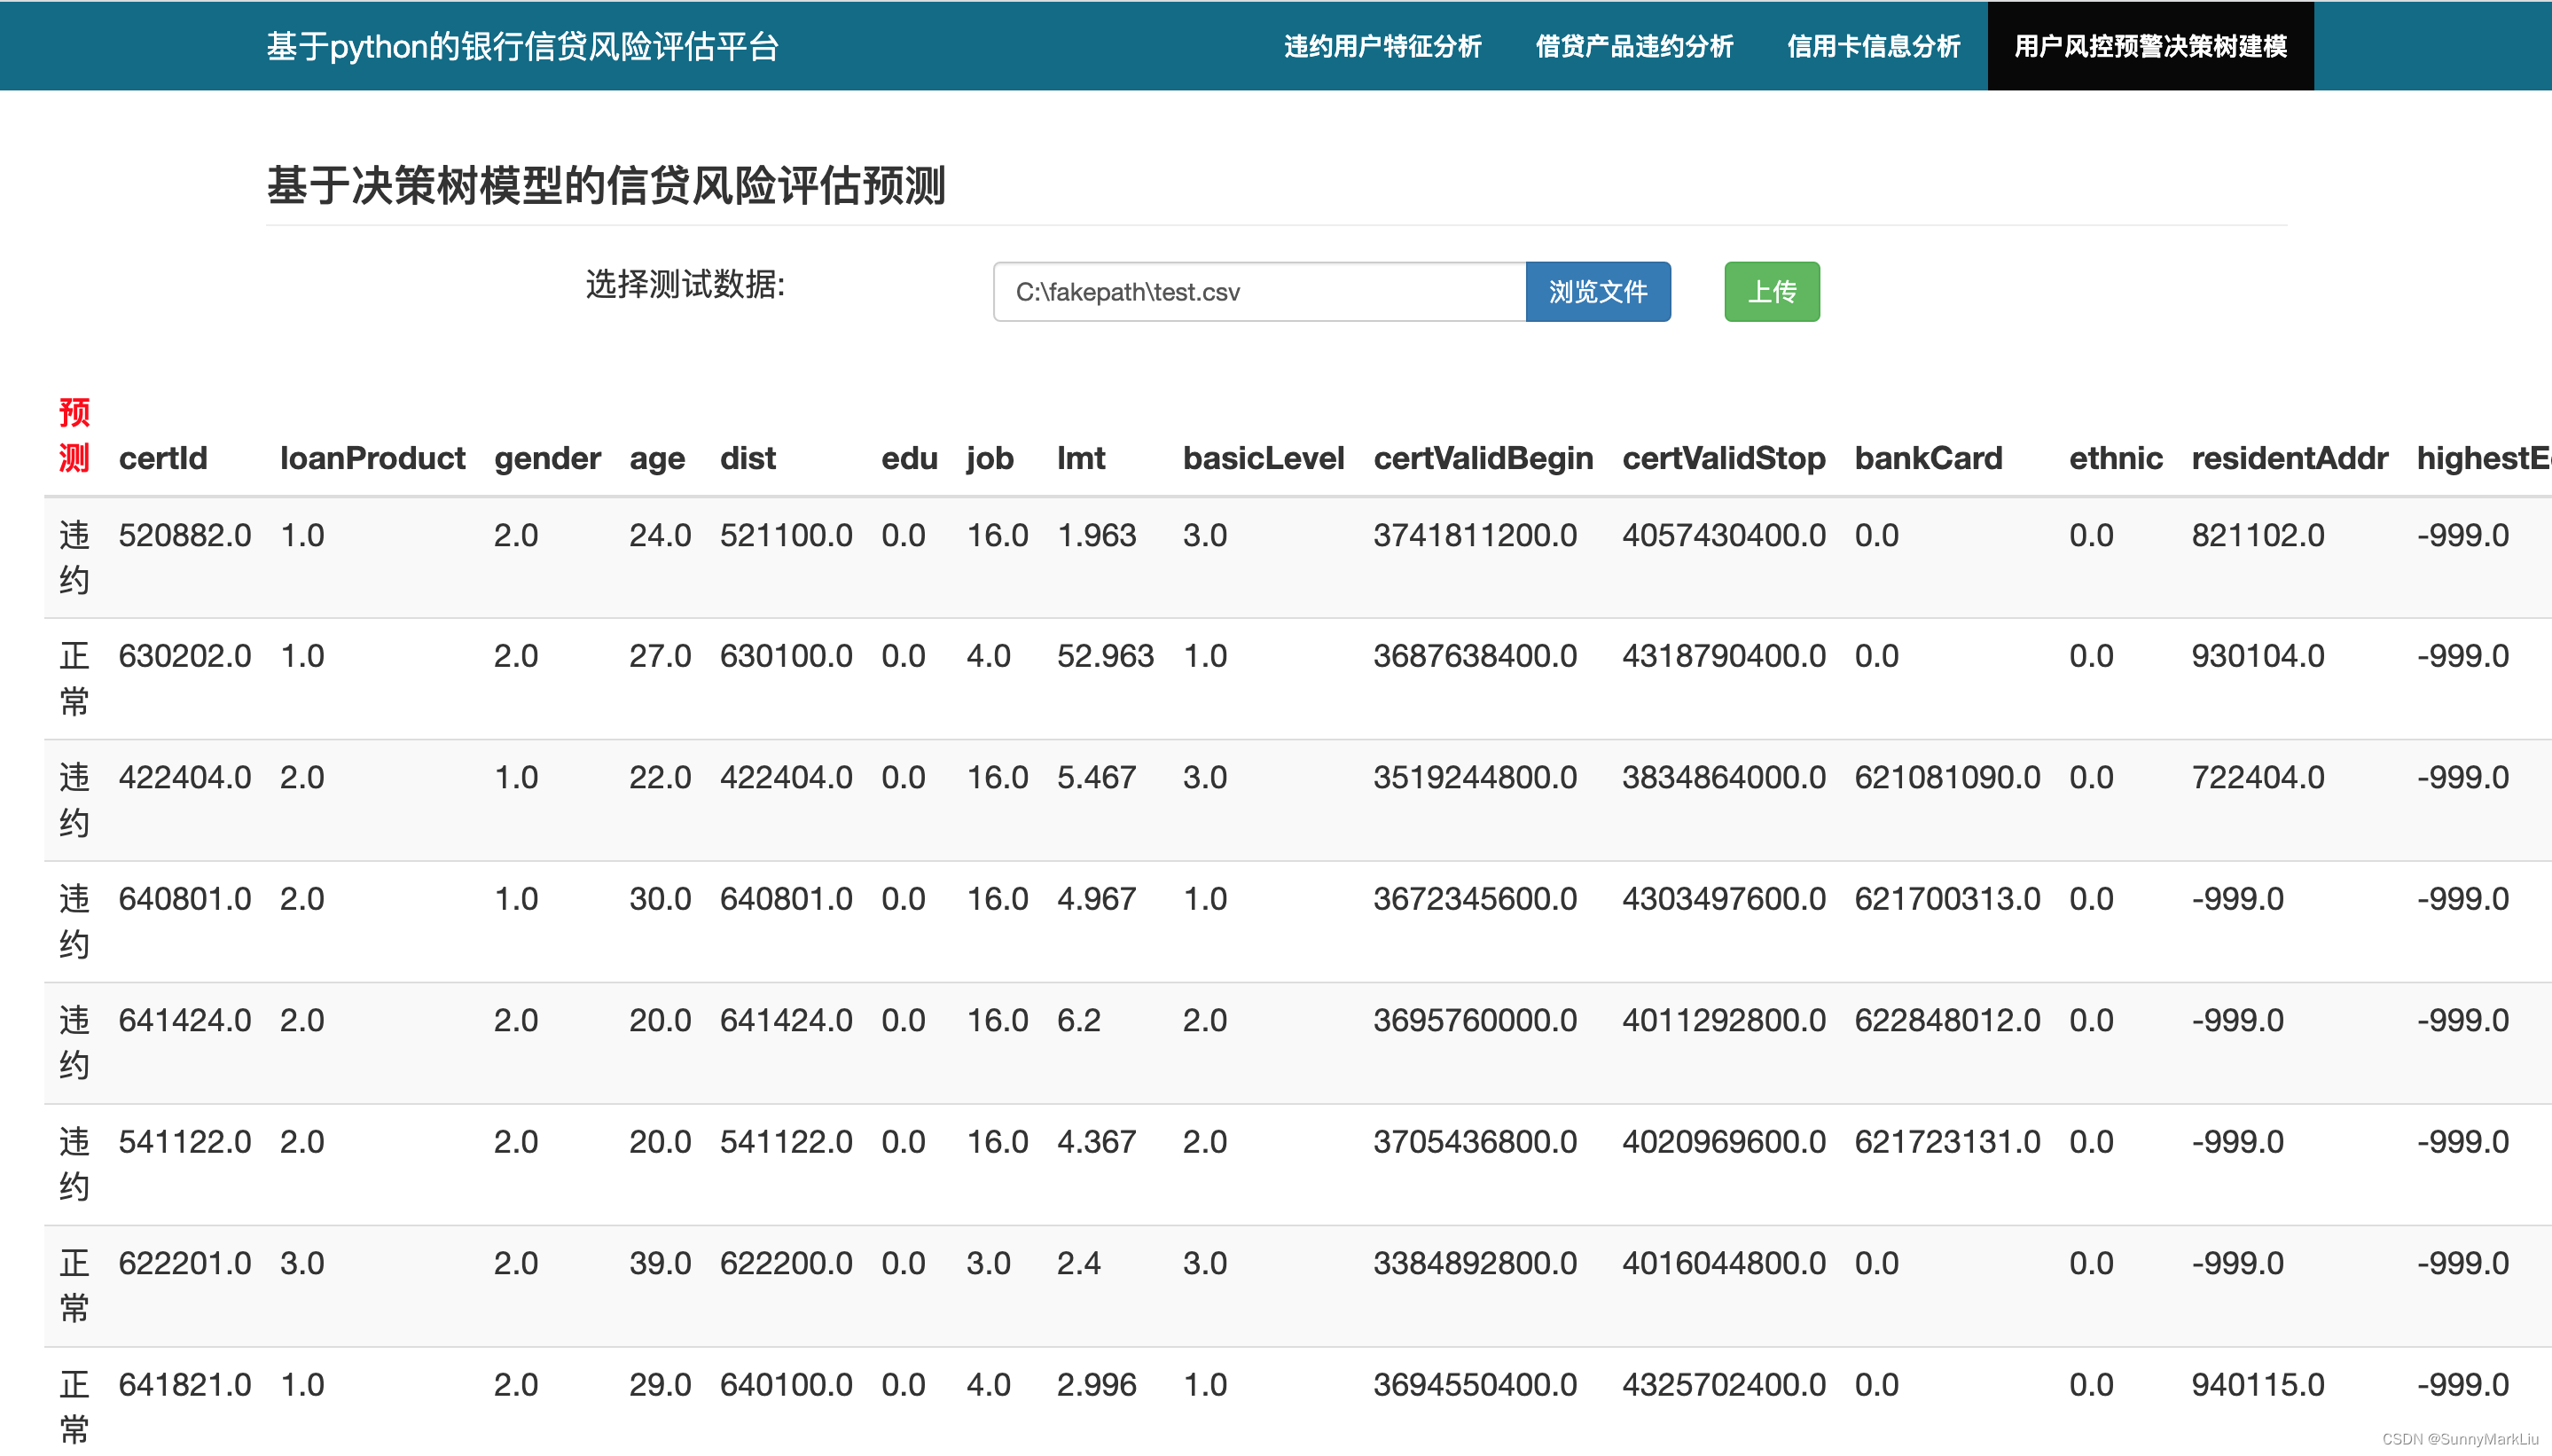
6.5 用户风控预警决策树建模
7. 总结
本文利用 python 的 pandas、numpy,Matplotlib、seaborn等数据分析工具包,完成对银行信贷数据的可视化分析,对不同特征维度进行可视化,并利用 xgboost 决策树模型对数据进行建模,划分训练集、验证集和测试集,通过参数调优,最终测试集的 AUC 指标达到 0.72,取得了良好的评测效果。
欢迎大家点赞、收藏、关注、评论啦 ,由于篇幅有限,只展示了部分核心代码。
技术交流认准下方 CSDN 官方提供的学长 Wechat / QQ 名片 :)
精彩专栏推荐订阅:
1. Python 毕设精品实战案例
2. 自然语言处理 NLP 精品实战案例
3. 计算机视觉 CV 精品实战案例


为开发者提供学习成长、分享交流、生态实践、资源工具等服务,帮助开发者快速成长。
更多推荐


 19
19 2
2- 0


 已为社区贡献21条内容

所有评论(0)