简单的学生成绩数据分析案例
文章目录题目要求1. 建一个数据测试表2. 编写程序3. 效果展示题目要求学生成绩存储在Excel文件(如表9-1)中,本程序从Excel文件读取学生成绩,统计各个分数段(90分以上,8089分,7079分,60~69分,60分以下)学生人数,并用柱状图(如图9-1)展示学生成绩分布,同时计算出最高分、最低分、平均成绩、各分数段人数等分析指标。1. 建一个数据测试表随便建,最好各个分数区间都有,展
·
文章目录
题目要求
学生成绩存储在Excel文件(如表9-1)中,本程序从Excel文件读取学生成绩,统计各个分数段(90分以上,8089分,7079分,60~69分,60分以下)学生人数,并用柱状图(如图9-1)展示学生成绩分布,同时计算出最高分、最低分、平均成绩、各分数段人数等分析指标。
1. 建一个数据测试表
随便建,最好各个分数区间都有,展示出来更直观,示例建表如下: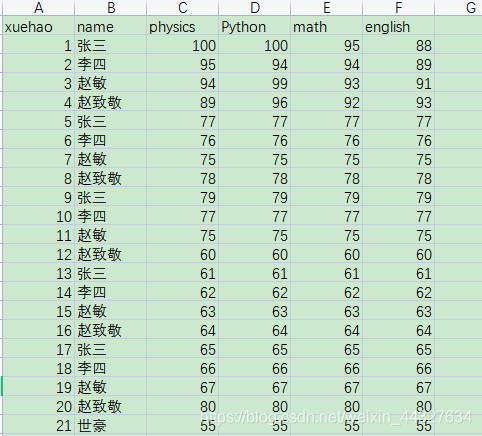
2. 编写程序
程序可分为两部分编写,一部分用于读取表格数据,拿到分数数据再求其他相关量就好做了,第二部分就是拿到第一部分的成绩列表,再进行具体的数据分析需求。
示例代码:
#!/usr/bin/env python3
# -*- coding: utf-8 -*-
import xlrd
import matplotlib.pyplot as plt
wb = xlrd.open_workbook('mark.xlsx')
sheet = wb.sheet_names()
sh = wb.sheet_by_name('Sheet1')
course_list = sh.row_values(0)
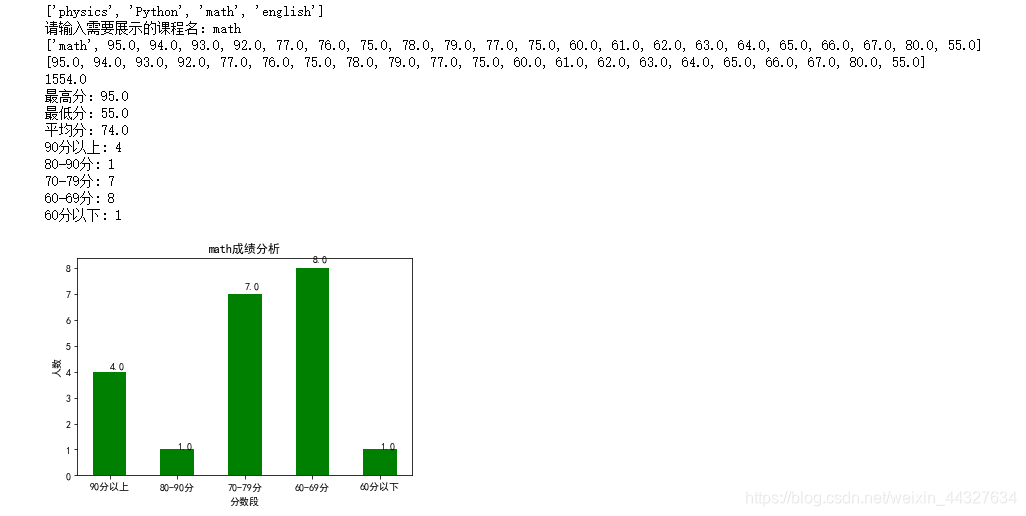
print(course_list[2:]) # ['physics', 'Python', 'math', 'english']
course = input('请输入需要展示的课程名:')
m = course_list.index(course)
col_list = sh.col_values(m)
print(col_list) # ['math', 95.0, 94.0, 93.0, 92.0]
score_list = col_list[1:]
print(score_list)
print(sum(score_list))
print('最高分:%s ' % max(score_list))
print('最低分:%s' % min(score_list))
print('平均分:%s' % (int(sum(score_list)) / len(score_list)))
y = [0, 0, 0, 0, 0]
for score in score_list:
if score >= 90:
y[0] += 1
elif score >= 80:
y[1] += 1
elif score >= 70:
y[2] += 1
elif score >= 60:
y[3] += 1
else:
y[4] += 1
print('90分以上:',y[0])
print('80-90分:',y[1])
print('70-79分:',y[2])
print('60-69分:',y[3])
print('60分以下:',y[4])
xl = ['90分以上', '80-90分', '70-79分', '60-69分', '60分以下']
x = [1, 2, 3, 4, 5]
plt.xlabel('分数段')
plt.ylabel('人数')
plt.rcParams['font.sans-serif'] = ['SimHei']
plt.xticks(x, xl)
recs = plt.bar(x=x, height=y, color='green', width=0.5)
plt.title(course + '成绩分析')
for rec in recs:
height = rec.get_height()
plt.text(rec.get_x() + rec.get_width() / 2.0, 1.03 * height, '%s' % float(height))
plt.show()
3. 效果展示

华为开发者空间,是为全球开发者打造的专属开发空间,汇聚了华为优质开发资源及工具,致力于让每一位开发者拥有一台云主机,基于华为根生态开发、创新。
更多推荐


 3
3 0
0- 0


 已为社区贡献8条内容

所有评论(0)