西瓜书第四章习题及答案
西瓜书第四章习题
解答:
每个标记不同的数据特征向量都不相同,即树的每一条枝干(从根节点到叶子结点)就代表一种向量,这样的话决策树与训练集就是一致的了。

解答:
题目4.1中介绍了如果数据不含有冲突数据,那么就会产生绝对的过拟合现象,这也符合最小训练误差的准则,因此使用‘最小训练误差‘作为决策树划分选择准则的会产生在训练集上效果很好,而测试集上效果差的情况,即出现了过拟合现象。
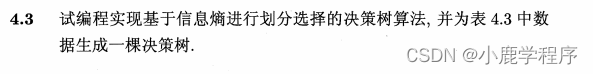
分析:
表4.3属性数据值,有离散的有连续的,而基于信息熵进行属性划分只能是离散属性值,如果使用表4.3的数据集则需要对连续属性进行离散化-对应知识点-机器学习4.4连续与缺失值。
本实验采用去除表4.3中连续值的数据集西瓜数据集2.0。
解答:
第一部分-说在前面:
将数据集进行预处理(手动的 呜呜~ 要哭了!)
将离散的属性值进行数字化,将属性用英文代替
	青绿-0   乌黑-1   浅白-2;
    蜷缩 -0  稍蜷-1   硬挺-2
    浊响-0 沉闷-1 清脆-2
    清晰-0 稍糊-1 模糊-2
    凹陷-0 稍凹-1 平坦-2
    硬滑-0  软粘-1
    是-1 否 -0
    #texture 纹理 umbilical region---脐部
     labels = ['color', 'root', 'Knock sound', 'texture','umbilical region','touch']
第二部分-计算机数据集的信息熵:
def calcShannonEnt(dataSet):
    numEntries = len(dataSet)
    labelCounts = {}
    for featVec in dataSet: #the the number of unique elements and their occurance
        currentLabel = featVec[-1]
        if currentLabel not in labelCounts.keys(): labelCounts[currentLabel] = 0
        labelCounts[currentLabel] += 1
    shannonEnt = 0.0
    for key in labelCounts:
        prob = float(labelCounts[key])/numEntries
        shannonEnt -= prob * log(prob,2) #log base 2
    return shannonEnt
第三部分-划分数据集
创建数据集函数:
from math import log
import operator
def createDataSet():
    dataSet = [
        [0, 0, 0, 0, 0, 0, 'yes'],
        [1, 0, 1, 0, 0, 0, 'yes'],
        [1, 0, 0, 0, 0, 0, 'yes'],
        [0, 0, 1, 0, 0, 0, 'yes'],
        [2, 0, 0, 0, 0, 0, 'yes'],
        [0, 1, 0, 0, 1, 1, 'yes'],
        [1, 1, 0, 1, 1, 1, 'yes'],
        [1, 1, 0, 0, 1, 0, 'yes'],
        [1, 1, 1, 1, 1, 0, 'no'],
        [0, 2, 2, 0, 2, 1, 'no'],
        [2, 2, 2, 2, 2, 0, 'no'],
        [2, 0, 0, 2, 2, 1, 'no'],
        [0, 1, 0, 1, 0, 0, 'no'],
        [2, 1, 1, 1, 0, 0, 'no'],
        [1, 1, 0, 0, 1, 1, 'no'],
        [2, 0, 0, 2, 2, 0, 'no'],
        [0, 0, 1, 1, 1, 0, 'no']
    ]
    labels = ['color', 'root', 'Knock sound', 'texture','umbilical region','touch']
    #change to discrete values
    return dataSet, labels
按照给定特征划分数据集:
def splitDataSet(dataSet, axis, value):
    retDataSet = []
    for featVec in dataSet:
        if featVec[axis] == value:
            reducedFeatVec = featVec[:axis]     #chop out axis used for splitting
            reducedFeatVec.extend(featVec[axis+1:])
            retDataSet.append(reducedFeatVec)
    return retDataSet
选择最好的数据集划分方式:
def chooseBestFeatureToSplit(dataSet):
    numFeatures = len(dataSet[0]) - 1      #the last column is used for the labels
    baseEntropy = calcShannonEnt(dataSet)
    bestInfoGain = 0.0; bestFeature = -1
    for i in range(numFeatures):        #iterate over all the features
        featList = [example[i] for example in dataSet]#create a list of all the examples of this feature
        uniqueVals = set(featList)       #get a set of unique values
        newEntropy = 0.0
        for value in uniqueVals:
            subDataSet = splitDataSet(dataSet, i, value)
            prob = len(subDataSet)/float(len(dataSet))
            newEntropy += prob * calcShannonEnt(subDataSet)
        infoGain = baseEntropy - newEntropy     #calculate the info gain; ie reduction in entropy
        if (infoGain > bestInfoGain):       #compare this to the best gain so far
            bestInfoGain = infoGain         #if better than current best, set to best
            bestFeature = i
    return bestFeature
第四部分-递归构建决策树
创建树的函数代码:
def createTree(dataSet,labels):
    classList = [example[-1] for example in dataSet]
    if classList.count(classList[0]) == len(classList):
        return classList[0]#stop splitting when all of the classes are equal
    if len(dataSet[0]) == 1: #stop splitting when there are no more features in dataSet
        return majorityCnt(classList)
    bestFeat = chooseBestFeatureToSplit(dataSet)
    bestFeatLabel = labels[bestFeat]
    myTree = {bestFeatLabel:{}}
    del(labels[bestFeat])
    featValues = [example[bestFeat] for example in dataSet]
    uniqueVals = set(featValues)
    for value in uniqueVals:
        subLabels = labels[:]       #copy all of labels, so trees don't mess up existing labels
        myTree[bestFeatLabel][value] = createTree(splitDataSet(dataSet, bestFeat, value),subLabels)
    return myTree
将结果输出展示:
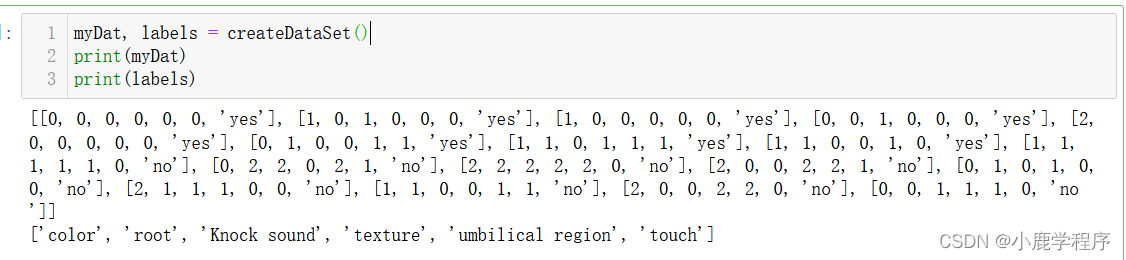
myDat, labels = createDataSet()
print(myDat)
print(labels)
运行结果如下所示:
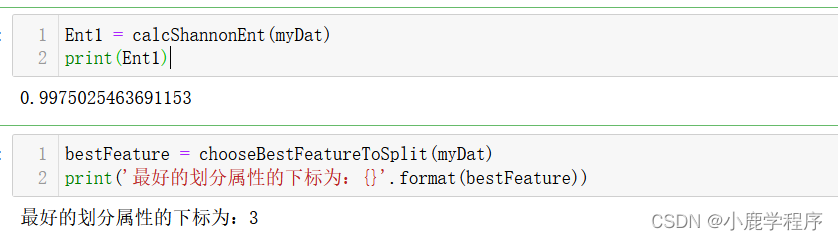
Ent1 = calcShannonEnt(myDat)
print(Ent1)

bestFeature = chooseBestFeatureToSplit(myDat)
print('最好的划分属性的下标为:{}'.format(bestFeature))
运行结果如下所示:
myTree = createTree(myDat, labels)
myTree
运行结果如下所示:

第五部分-使用matplotlib注解绘制树形图
使用文本注解绘制节点:
import matplotlib.pyplot as plt
#定义文本框和箭头的形式
decisionNode = dict(boxstyle = 'sawtooth', fc = '0.8')
leafNode = dict(boxstyle = 'round4', fc = '0.8')
arrow_args = dict(arrowstyle = '<-')
def plotNode(nodeTxt, centerPt, parentPt, nodeType):
createPlot.ax1.annotate(nodeTxt, xy = parentPt, xycoords = 'axes fraction',\
xytext = centerPt, textcoords = 'axes fraction',\
va = 'center', ha ='center', bbox = nodeType, arrowprops = arrow_args)
def createPlot():
fig = plt.figure(1, facecolor='white')
fig.clf()
createPlot.ax1 = plt.subplot(111, frameon=False) #ticks for demo puropses
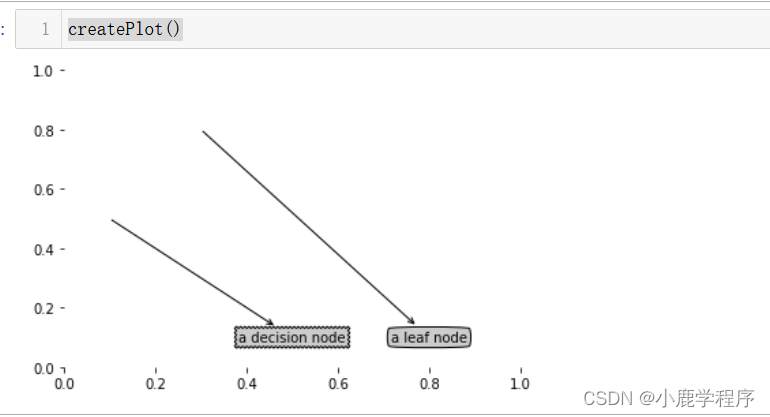
plotNode('a decision node', (0.5, 0.1), (0.1, 0.5), decisionNode)
plotNode('a leaf node', (0.8, 0.1), (0.3, 0.8), leafNode)
plt.show()
createPlot()#运行结果如下所示
获取叶节点的数目:
def getNumLeafs(myTree):
    numLeafs = 0
    firstStr = list(myTree.keys())[0]
    secondDict = myTree[firstStr]
    for key in secondDict.keys():
        if type(secondDict[key]).__name__=='dict':#test to see if the nodes are dictonaires, if not they are leaf nodes
            numLeafs += getNumLeafs(secondDict[key])
        else:   numLeafs +=1
    return numLeafs
获取树的层数:
#获取树的层数
def getTreeDepth(myTree):
    maxDepth = 0
    firstStr = list(myTree.keys())[0]
    secondDict = myTree[firstStr]
    for key in secondDict.keys():
        if type(secondDict[key]).__name__=='dict':#test to see if the nodes are dictonaires, if not they are leaf nodes
            thisDepth = 1 + getTreeDepth(secondDict[key])
        else:   thisDepth = 1
        if thisDepth > maxDepth: maxDepth = thisDepth
    return maxDepth
创建retrieveTree函数输出预先存储的树信息,避免每次测试代码时都要从数据中创建树的麻烦。(就是保结果复制过来保存一下)
def retrieveTree(i):
    listOfTrees =[{'texture': {0: {'root': {0: 'yes',
    1: {'color': {0: 'yes', 1: {'touch': {0: 'yes', 1: 'no'}}}},
    2: 'no'}},
  1: {'touch': {0: 'no', 1: 'yes'}},
  2: 'no'}},
                  {'texture': {0: {'root': {0: 'yes',
    1: {'color': {0: 'yes', 1: {'touch': {0: 'yes', 1: 'no'}}}},
    2: 'no'}},
  1: {'touch': {0: 'no', 1: 'yes'}},
  2: 'no'}}
                 ]
    return listOfTrees[i]
运行上述代码并查看结果:
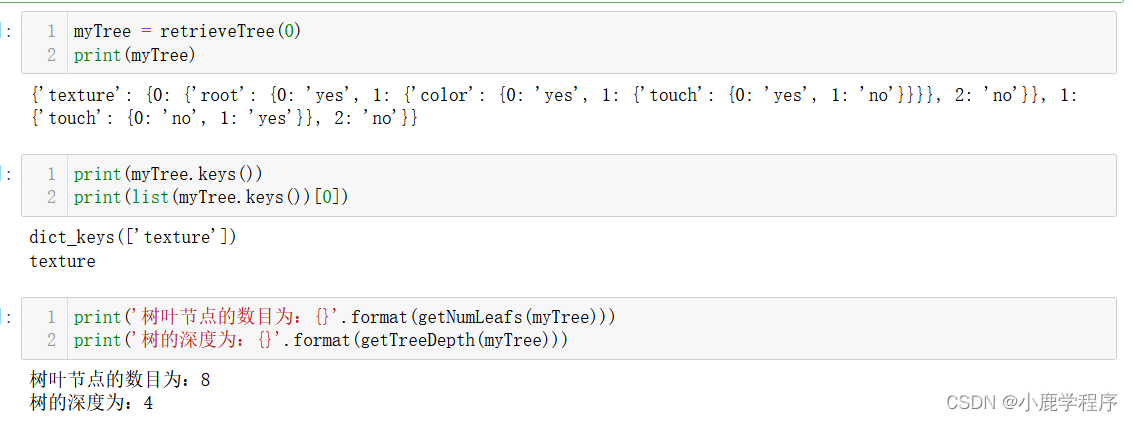
myTree = retrieveTree(0)
print(myTree)

print(myTree.keys())
print(list(myTree.keys())[0])

print('树叶节点的数目为:{}'.format(getNumLeafs(myTree)))
print('树的深度为:{}'.format(getTreeDepth(myTree)))
结果如下:
 plotTree函数-由三个函数构成,从下往上调用函数。
def plotMidText(cntrPt, parentPt, txtString):
    xMid = (parentPt[0]-cntrPt[0])/2.0 + cntrPt[0]
    yMid = (parentPt[1]-cntrPt[1])/2.0 + cntrPt[1]
    createPlot.ax1.text(xMid, yMid, txtString, va="center", ha="center", rotation=30)

def plotTree(myTree, parentPt, nodeTxt):#if the first key tells you what feat was split on
    numLeafs = getNumLeafs(myTree)  #this determines the x width of this tree
    depth = getTreeDepth(myTree)
    firstStr = list(myTree.keys())[0]     #the text label for this node should be this
    cntrPt = (plotTree.xOff + (1.0 + float(numLeafs))/2.0/plotTree.totalW, plotTree.yOff)
    plotMidText(cntrPt, parentPt, nodeTxt)
    plotNode(firstStr, cntrPt, parentPt, decisionNode)
    secondDict = myTree[firstStr]
    plotTree.yOff = plotTree.yOff - 1.0/plotTree.totalD
    for key in secondDict.keys():
        if type(secondDict[key]).__name__=='dict':#test to see if the nodes are dictonaires, if not they are leaf nodes
            plotTree(secondDict[key],cntrPt,str(key))        #recursion
        else:   #it's a leaf node print the leaf node
            plotTree.xOff = plotTree.xOff + 1.0/plotTree.totalW
            plotNode(secondDict[key], (plotTree.xOff, plotTree.yOff), cntrPt, leafNode)
            plotMidText((plotTree.xOff, plotTree.yOff), cntrPt, str(key))
    plotTree.yOff = plotTree.yOff + 1.0/plotTree.totalD
#if you do get a dictonary you know it's a tree, and the first element will be another dict

def createPlot(inTree):
    fig = plt.figure(1, facecolor='white')
    fig.clf()
    axprops = dict(xticks=[], yticks=[])
    createPlot.ax1 = plt.subplot(111, frameon=False, **axprops)    #no ticks
    plotTree.totalW = float(getNumLeafs(inTree))
    plotTree.totalD = float(getTreeDepth(inTree))
    plotTree.xOff = -0.5/plotTree.totalW; plotTree.yOff = 1.0;
    plotTree(inTree, (0.5,1.0), '')###11111111
    plt.show()
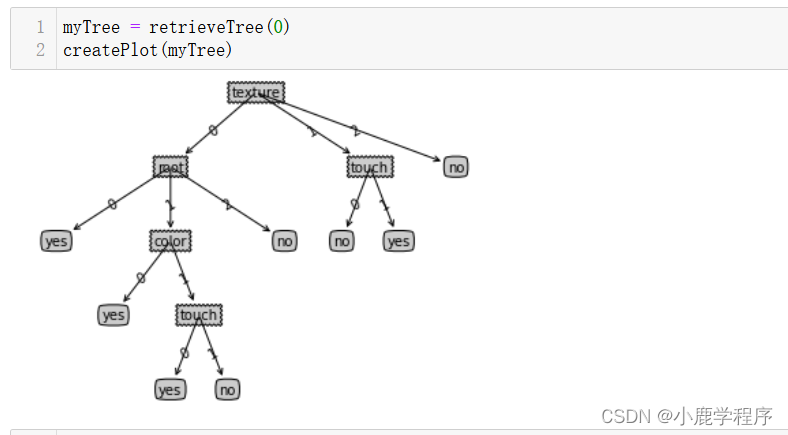
myTree = retrieveTree(0)
createPlot(myTree)
最终运行的结果图:
第六部分-说明
虽然输出的结果丑了点,也确实花费了不少时间(谁让我那么菜呐),所以有写的不好的地方还请各位大佬支出,大家共同进步哈。
今后如果有能力的话,会将最终的决策树美化一下,处理数据的文本样式而不是现在的0 1,再将连续型的属性值也加上去。
第七部分-参考书籍及文章
机器学习-西瓜书
机器学习实战-Peter Harrington

为开发者提供学习成长、分享交流、生态实践、资源工具等服务,帮助开发者快速成长。
更多推荐


 6
6 0
0- 0


 已为社区贡献2条内容

所有评论(0)