通过Python绘制九种二次曲面
二次曲面python中绘制三维图需要将坐标系声明为3d。球面方程为x2+y2+z2=R2x^2+y^2+z^2=R^2x2+y2+z2=R2写为极坐标形式为x=Rsinθcosφy=Rsinθsinφz=Rcosθ\begin{aligned}x&=R\sin\theta\cos\varphi\\y&=R\sin\theta\sin\varphi\\z&=R\co
二次曲面
python中绘制三维图需要将坐标系声明为3d。
球面方程为
x 2 + y 2 + z 2 = R 2 x^2+y^2+z^2=R^2 x2+y2+z2=R2
写为极坐标形式为
x = R sin θ cos φ y = R sin θ sin φ z = R cos θ \begin{aligned} x&=R\sin\theta\cos\varphi\\ y&=R\sin\theta\sin\varphi\\ z&=R\cos\theta\end{aligned} xyz=Rsinθcosφ=Rsinθsinφ=Rcosθ
令 R = 1 R=1 R=1,则画图为

代码如下
>>> import matplotlib.pyplot as plt
>>> import numpy as np
>>> theta = np.arange(0,6.4,0.1).reshape(64,1)
>>> phi = np.arange(0,3.2,0.1).reshape(1,32)
>>> x = np.sin(theta)*np.cos(phi)
>>> y = np.sin(theta)*np.sin(phi)
>>> z = np.cos(theta)
>>> ax = plt.gca(projection='3d')
>>> ax.plot_surface(x,y,z)
<mpl_toolkits.mplot3d.art3d.Poly3DCollection object at 0x000001CECF13A730>
>>> plt.show()
二次曲面共有九种,代码均与椭球曲面类似,为了加强立体感,可在画图的时候设置颜色映射,下列各图部分用到
from matplotlib import cm
#...
ax.plot_surface(x,y,z,cmap=cm.coolwarm)
| a,b,c均为1时的曲面 | |
|---|---|
| 椭圆锥面 x 2 a 2 + y 2 b 2 − z 2 c 2 = 0 \frac{x^2}{a^2}+\frac{y^2}{b^2}-\frac{z^2}{c^2}=0 a2x2+b2y2−c2z2=0 |  |
| 椭球面 x 2 a 2 + y 2 b 2 + z 2 c 2 = 1 \frac{x^2}{a^2}+\frac{y^2}{b^2}+\frac{z^2}{c^2}=1 a2x2+b2y2+c2z2=1 |  |
| 单叶双曲面 x 2 a 2 + y 2 b 2 − z 2 c 2 = 1 \frac{x^2}{a^2}+\frac{y^2}{b^2}-\frac{z^2}{c^2}=1 a2x2+b2y2−c2z2=1 |  |
| 双叶双曲面 x 2 a 2 + y 2 b 2 − z 2 c 2 = − 1 \frac{x^2}{a^2}+\frac{y^2}{b^2}-\frac{z^2}{c^2}=-1 a2x2+b2y2−c2z2=−1 |  |
| 椭圆抛物面 z = x 2 a 2 + y 2 b 2 z=\frac{x^2}{a^2}+\frac{y^2}{b^2} z=a2x2+b2y2 |  |
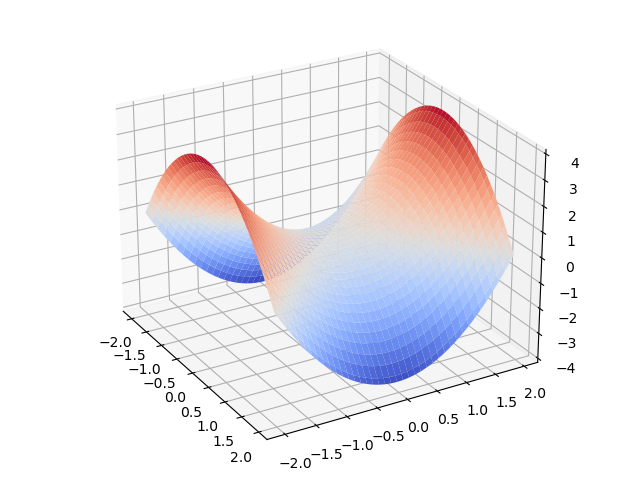
| 双曲抛物面 z = x 2 a 2 − y 2 b 2 z=\frac{x^2}{a^2}-\frac{y^2}{b^2} z=a2x2−b2y2 |  |
| 椭圆柱面 x 2 a 2 + y 2 b 2 = 1 \frac{x^2}{a^2}+\frac{y^2}{b^2}=1 a2x2+b2y2=1 |  |
| 双曲柱面 x 2 a 2 − y 2 b 2 = 1 \frac{x^2}{a^2}-\frac{y^2}{b^2}=1 a2x2−b2y2=1 |  |
| 抛物柱面 y 2 = 2 p x y^2=2px y2=2px |  |
在上面各式中,椭圆锥面、单叶双曲面、双叶双曲面具有极为相似的表达式
x 2 a 2 + y 2 b 2 − z 2 c 2 = { < 0 双 叶 双 曲 面 = 0 椭 圆 锥 面 > 0 单 叶 双 曲 面 \frac{x^2}{a^2}+\frac{y^2}{b^2}-\frac{z^2}{c^2}=\left\{\begin{aligned} &<0&双叶双曲面\\ &=0&椭圆锥面\\ &>0&单叶双曲面\\ \end{aligned}\right. a2x2+b2y2−c2z2=⎩⎪⎨⎪⎧<0=0>0双叶双曲面椭圆锥面单叶双曲面
故可绘制动态图来表示这一过程,由于animation中无法绘制plot_surface,所以采用将单张图片生成gif的方式。
import numpy as np
import matplotlib.pyplot as plt
from matplotlib import cm
import imageio

theta = np.arange(0,6.4,0.1)
z = np.arange(-2,2,0.02).reshape(200,1)
gifImgs = []
fig = plt.figure()
for i in np.arange(-1,1,0.02):
    theta = np.arange(0,6.4,0.1).reshape(1,64)
    Z = np.repeat(z,64).reshape(200,64)
    x = np.sqrt(z**2+i)*np.cos(theta)
    y = np.sqrt(z**2+i)*np.sin(theta)
    ax = plt.gca(projection='3d')
    ax.plot_surface(x,y,Z,cmap=cm.coolwarm)
    plt.savefig("%.2f.jpg" % i)
    gifImgs.append(imageio.imread("%.2f.jpg" % i))

imageio.mimsave("test.gif",gifImgs,fps=5)


华为开发者空间,是为全球开发者打造的专属开发空间,汇聚了华为优质开发资源及工具,致力于让每一位开发者拥有一台云主机,基于华为根生态开发、创新。
更多推荐


 38
38 0
0- 0


 已为社区贡献8条内容

所有评论(0)