python绘图之折线图
python 中matplotlib库入门(1)——绘制折线图绘制折线图python 中matplotlib库入门(1)——绘制折线图导入库设置线条添加标签设置刻度标记的大小导入库import matplotlib.pyplot as plt为了方便使用,将pyplot命名为plt##引入数组squares = [1, 4, 9, 16, 25]values = [1, 2, 3, 4, 5]这个
·
python 中matplotlib库入门(1)——绘制折线图
导入库
import matplotlib.pyplot as plt
为了方便使用,将pyplot命名为plt
引入数组
squares = [1, 4, 9, 16, 25]
values = [1, 2, 3, 4, 5]
这个squares数组元素代表的是点的y值,values数组代表的是点的x值
如果列表的x值是从0开始,每次加一,则可以不引入x值的数组
设置线条
plt.plot(values, squares, linewidth=4)
第一个元素为x轴,第二个为y轴,第三个为线条的宽度
添加标签
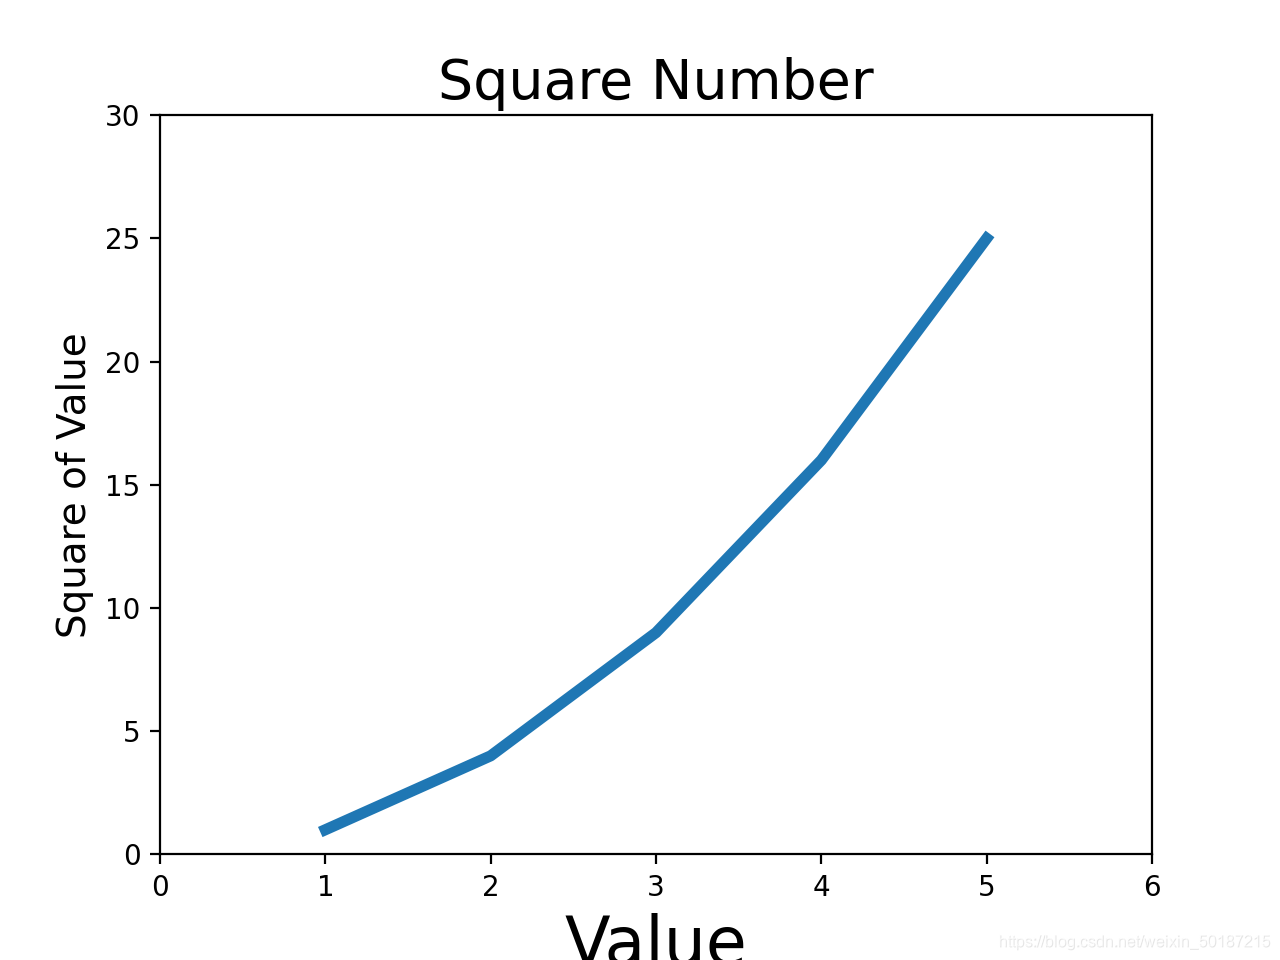
plt.title("Square Number",fontsize=14)
plt.xlabel("Value", fontsize=14)
plt.ylabel("Square of Value", fontsize=14)
" "内的文字为标题,fontsize的值则为文字的大小,若不设置,系统会给出一个默认值
设置刻度标记
plt.tick_params(axis='x', labelsize=10)
plt.axis([0, 6, 0, 30])
里面的值设置为x,则为x轴,both则为x和y,labelsize的值为刻度数字的大小
第一次写博客,以后会继续更新我在学习中的一些总结
希望大家三连关注,这对我很重要,哈哈。
运行程序
plt.show()
运行结果如下
附上代码
import matplotlib.pyplot as plt
import numpy as np
values = [1, 2, 3, 4, 5]
squares = [1, 4, 9, 16, 25]
plt.plot(values, squares, linewidth=4)
plt.title("Square Number", fontsize=20)
plt.xlabel("Value", fontsize=24)
plt.ylabel("Square of Value", fontsize=14)
plt.tick_params(axis='both',
labelsize=10)
plt.axis([0, 6, 0, 30])
plt.show()

为开发者提供学习成长、分享交流、生态实践、资源工具等服务,帮助开发者快速成长。
更多推荐


 34
34 0
0- 0


 已为社区贡献2条内容

所有评论(0)