
【OpenCV 例程300篇】40. 图像分段线性灰度变换
分段线性变换函数可以增强图像各部分的反差,增强感兴趣的灰度区间、抑制不感兴趣的灰度级。分段线性函数的优点是可以根据需要拉伸特征物的灰度细节,一些重要的变换只能用分段函数来描述和实现,缺点则是参数较多不容易确定。.........
『youcans 的 OpenCV 例程300篇 - 总目录』
【youcans 的 OpenCV 例程300篇】40. 图像分段线性灰度变换
分段线性变换函数可以增强图像各部分的反差,增强感兴趣的灰度区间、抑制不感兴趣的灰度级。
分段线性函数的优点是可以根据需要拉伸特征物的灰度细节,一些重要的变换只能用分段函数来描述和实现,缺点则是参数较多不容易确定。
分段线性函数通用公式如下:
D
t
=
{
c
a
D
,
0
≤
D
<
a
d
−
c
b
−
a
[
D
−
a
]
+
c
,
a
≤
D
≤
b
f
−
d
e
−
b
[
D
−
b
]
+
d
,
b
<
D
≤
e
Dt = \begin{cases} \dfrac{c}{a} D &, 0 \leq D < a\\ \dfrac{d-c}{b-a}[D-a]+c &, a \leq D \leq b\\ \dfrac{f-d}{e-b}[D-b]+d &, b < D \leq e\\ \end{cases}
Dt=⎩
⎨
⎧acDb−ad−c[D−a]+ce−bf−d[D−b]+d,0≤D<a,a≤D≤b,b<D≤e
式中,D 为原始图像的灰度值,Dt 为线性灰度变换后的图像灰度值。
例程:1.50 分段线性灰度变换(对比度拉伸)
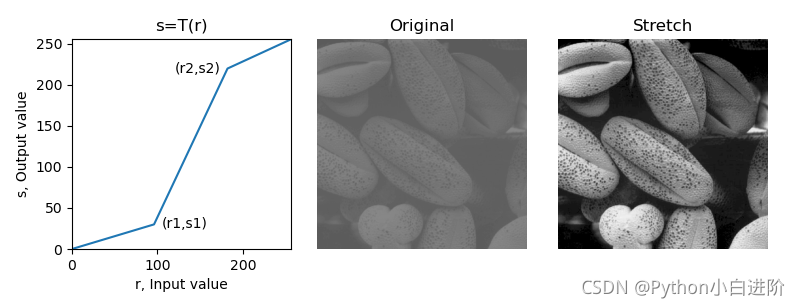
对比度拉伸可以扩展图像中的灰度级范围,从而覆盖设备的理想灰度范围。
对比度拉伸变换函数可以有不同的实现方案,如将原始灰度范围拉伸到较宽的灰度范围;或将原始灰度范围拉伸到全域灰度范围(0,255);或将原始灰度范围拉伸到较宽的灰度范围,同时对下限或上限进行截断处理。
本例程令 (r1, s1) = (rMin, 0)、(r2, s2) = (rmax, L-1),其中 rMin、rMax 表示图像中最小灰度值和最大灰度值,将原始图像的灰度级分段线性拉伸到整个范围 [0, L-1]。运行结果的左图显示本例程的拉伸变换曲线。
    # 1.50 分段线性灰度变换 (对比度拉伸)
    imgGray = cv2.imread("../images/Fig0310b.tif", flags=0)  # flags=0 读取为灰度图像
    height, width = imgGray.shape[:2]  # 图片的高度和宽度

    # constrast stretch, (r1,s1)=(rMin,0), (r2,s2)=(rMax,255)
    rMin = imgGray.min()  # 原始图像灰度的最小值
    rMax = imgGray.max()  # 原始图像灰度的最大值
    r1, s1 = rMin, 0  # (x1,y1)
    r2, s2 = rMax, 255  # (x2,y2)

    imgStretch = np.empty((height, width), np.uint8)  # 创建空白数组
    k1 = s1 / r1  # imgGray[h,w] < r1:
    k2 = (s2-s1) / (r2-r1)  # r1 <= imgGray[h,w] <= r2
    k3 = (255-s2) / (255-r2)  # imgGray[h,w] > r2
    for h in range(height):
        for w in range(width):
            if imgGray[h,w] < r1:
                imgStretch[h,w] = k1 * imgGray[h,w]
            elif r1 <= imgGray[h,w] <= r2:
                imgStretch[h,w] = k2 * (imgGray[h,w] - r1) + s1
            elif imgGray[h,w] > r2:
                imgStretch[h,w] = k3 * (imgGray[h,w] - r2) + s2

    plt.figure(figsize=(10,3.5))
    plt.subplots_adjust(left=0.2, bottom=0.2, right=0.9, top=0.8, wspace=0.1, hspace=0.1)
    plt.subplot(131), plt.title("s=T(r)")
    x = [0, 96, 182, 255]
    y = [0, 30, 220, 255]
    plt.plot(x, y)
    plt.axis([0,256,0,256])
    plt.text(105, 25, "(r1,s1)", fontsize=10)
    plt.text(120, 215, "(r2,s2)", fontsize=10)
    plt.xlabel("r, Input value")
    plt.ylabel("s, Output value")
    plt.subplot(132), plt.imshow(imgGray, cmap='gray', vmin=0, vmax=255), plt.title("Original"), plt.axis('off')
    plt.subplot(133), plt.imshow(imgStretch, cmap='gray', vmin=0, vmax=255), plt.title("Stretch"), plt.axis('off')
    plt.show()
(本节完)
附注:
根据博友 zhashung001 的意见,将 LUT 实现方法贴出,供读者参考:
def MMST(img):  # Max-min strength transformation
    rMin = img.min()  # 原始图像灰度的最小值
    rMax = img.max()  # 原始图像灰度的最大值

    imgStretch = 255. * (img-rMin) / (rMax-rMin)  # 注意 255.0 而不是255
    imgStretch = np.uint8(imgStretch + 0.5)
    return imgStretch

def DLST(img, x1, y1, x2, y2):  # divided linear strength transformation
    # 分段线性拉伸变换, divided linear strength transformation
    lut = np.zeros(256)
    for i in range(256):
        if i < x1:
            lut[i] = (y1/x1) * i  # k1=y1/x1
        elif i < x2:
            lut[i] = (y2-y1)/(x2-x1) * (i-x1) + y1  # k2=(y2-y1)/(x2-x1)
        else:
            lut[i] = (255.-y2)/(255.-x2) * (i-x2.) + y2  # k3=(255-y2)/(255-x2)
    imgStretch = cv2.LUT(img, lut)
    imgStretch = np.uint8(imgStretch + 0.5)
    return imgStretch

    # 1.51 对比度拉伸 (DLST 和 Max-Min Stretch)
    imgGray = cv2.imread("../images/Fig0310b.tif", flags=0)  # flags=0 读取为灰度图像
    height, width = imgGray.shape[:2]  # 图片的高度和宽度

    # constrast stretch, (r1,s1)=(rMin,0), (r2,s2)=(rMax,255)
    rMin = imgGray.min()  # 原始图像灰度的最小值
    rMax = imgGray.max()  # 原始图像灰度的最大值
    r1, s1 = rMin, 0  # (x1,y1)
    r2, s2 = rMax, 255  # (x2,y2)
    imgStretch1 = DLST(imgGray, r1, s1, r2, s2)  # 调用子程序 DLST(Divided linear strength)
    imgStretch2 = MMST(imgGray)  # 调用子程序 MMST(Max-Min strength)

    plt.figure(figsize=(10, 6))
    plt.subplot(131), plt.imshow(imgGray, cmap='gray', vmin=0, vmax=255), plt.title("Original"), plt.axis('off')
    plt.subplot(132), plt.imshow(imgStretch1, cmap='gray', vmin=0, vmax=255), plt.title("DLST Stretch"), plt.axis('off')
    plt.subplot(133), plt.imshow(imgStretch2, cmap='gray', vmin=0, vmax=255), plt.title("Max-Min Stretch"), plt.axis('off')
    plt.show()
版权声明:
youcans@xupt 原创作品,转载必须标注原文链接:(https://blog.csdn.net/youcans/article/details/125112487)
Copyright 2022 youcans, XUPT
Crated:2021-11-18
【第4章:灰度变换与直方图】

为开发者提供学习成长、分享交流、生态实践、资源工具等服务,帮助开发者快速成长。
更多推荐


 17
17 0
0- 0


 已为社区贡献28条内容

所有评论(0)