对sklearn中的糖尿病数据集进行线性回归,岭回归,套索回归模型分析和对比其模型性能
def z3():# 导入糖尿病数据集from sklearn.datasets import load_diabetes#打印数据集里面的Keysprint(load_diabetes().keys())#dict_keys(['data', 'target', 'frame', 'DESCR', 'feature_names', 'data_filename', 'target_filenam
·
def z3():
    # 导入糖尿病数据集
    from sklearn.datasets import load_diabetes
    #打印数据集里面的Keys
    print(load_diabetes().keys())#dict_keys(['data', 'target', 'frame', 'DESCR', 'feature_names', 'data_filename', 'target_filename', 'data_module'])
    x,y=load_diabetes().data,load_diabetes().target
    #导入数据集分割函数
    from sklearn.model_selection import train_test_split
    #数据集拆分成训练集和测试集
    x_train,x_test,y_train,y_test=train_test_split(x,y,random_state=8)
    '''因为同一算法模型在不同的训练集和测试集的会得到不同的准确率,无法调参。所以在sklearn 中可以通过添加random_state,通过固定random_state的值,每次可以分割得到同样训练集和测试集。因此random_state参数主要是为了保证每次都分割一样的训练集和测试机,大小可以是任意一个整数,在调参缓解,只要保证其值一致即可。'''
    from sklearn.linear_model import LinearRegression#导入线性回归模型
    #对象化
    lr=LinearRegression()
    #拟合
    lr.fit(x_train,y_train)
    print('线性回归训练数据集得分:', '%.2f' % lr.score(x_train, y_train))#我们让其保留两位小数,使用字符串格式化
    print('线性回归测试数据集得分:', '%.2f' % lr.score(x_test, y_test))
    #出现过拟合的情况:训练数据集得分大于测试数据集得分
    '''我们使用岭回归对上面的过拟合的情况进行改进'''
    from sklearn.linear_model import Ridge
    ridge=Ridge()
    ridge.fit(x_train,y_train)
    print('岭回归训练数据集得分:', '%.2f' % ridge.score(x_train, y_train))  # 我们让其保留两位小数,使用字符串格式化
    print('岭回归测试数据集得分:', '%.2f' % ridge.score(x_test, y_test))
    '''6,在岭回归中,是通过改变alpha的参数来控制减少特征变量系数,增加alpha值会降低特征变量的系数,从而降低训练集的性能,有助于泛化。'''
    #下面alpha改变
    ridge01 = Ridge(alpha=0.1)
    ridge01.fit(x_train, y_train)
    print('岭回归2训练数据集得分:', '%.2f' % ridge01.score(x_train, y_train))  # 我们让其保留两位小数,使用字符串格式化
    print('岭回归2测试数据集得分:', '%.2f' % ridge01.score(x_test, y_test))
    ridge20 = Ridge(alpha=20)
    ridge20.fit(x_train, y_train)
    print('岭回归3训练数据集得分:', '%.2f' % ridge20.score(x_train, y_train))  # 我们让其保留两位小数,使用字符串格式化
    print('岭回归3测试数据集得分:', '%.2f' % ridge20.score(x_test, y_test))
    #通过可视化来进行分析--岭回归和线性回归的系数对比
    import matplotlib.pyplot as plt
    plt.plot(ridge.coef_,'^',label='ridge alpha=1')
    plt.plot(ridge20.coef_, 'v', label='ridge alpha=20')
    plt.plot(ridge01.coef_, 's', label='ridge alpha=0.1')
    plt.plot(lr.coef_, 'o', label='linear regression')
    plt.xlabel('cofficient index')
    plt.ylabel('coefficient magnitude')
    plt.hlines(0,0,len(lr.coef_))
    plt.legend()
    plt.show()
    #从图中可以看到当alpha特别小时,就可以跟线性回归的点重合
    '''我们通过学习曲线来直观的看这个模型的评价得分'''
    #导入学习曲线模块
    from sklearn.model_selection import learning_curve,KFold
    #定义函数
    def plot_learning_curve(est,x,y):
        training_set_size,train_scores,test_scores=learning_curve(est,x,y,train_sizes=np.linspace(.1, 1, 20),cv=KFold(20,shuffle=True,random_state=1))
        est_name = est.__class__.__name__
        line=plt.plot(training_set_size,train_scores.mean(axis=1), '--',label='training'+est_name)
        plt.plot(training_set_size, test_scores.mean(axis=1), '-',label='test' + est_name,c=line[0].get_color())
        plt.xlabel('Training set size')
        plt.ylabel('score')
        plt.ylim(0,1.1)
    plot_learning_curve(Ridge(alpha=1),x,y)
    plot_learning_curve(LinearRegression(), x, y)
    plt.legend(loc=(0,1.05),ncol=2,fontsize=11)
    plt.show()
    '''我们使用套索回归对上面的过拟合的情况进行改进'''
    from sklearn.linear_model import Lasso
    lasso=Lasso()#默认alpha=1
    lasso.fit(x_train,y_train)
    print('套索回归训练数据集得分:', '%.2f' % lasso.score(x_train, y_train))  # 我们让其保留两位小数,使用字符串格式化
    print('套索归测试数据集得分:', '%.2f' % lasso.score(x_test, y_test))
    print('套索回归中选取的特征数:',np.sum(lasso.coef_!=0))
    #改变其参数调节
    lasso1 = Lasso(alpha=0.1,max_iter=10000)
    lasso1.fit(x_train, y_train)
    print('套索回归1训练数据集得分:', '%.2f' % lasso1.score(x_train, y_train))  # 我们让其保留两位小数,使用字符串格式化
    print('套索回归1测试数据集得分:', '%.2f' % lasso1.score(x_test, y_test))
    print('套索回归1中选取的特征数:', np.sum(lasso1.coef_ != 0))
    #再次改变其参数调节
    lasso2 = Lasso(alpha=0.00001, max_iter=10000)
    lasso2.fit(x_train, y_train)
    print('套索回归2训练数据集得分:', '%.2f' % lasso2.score(x_train, y_train))  # 我们让其保留两位小数,使用字符串格式化
    print('套索回归2测试数据集得分:', '%.2f' % lasso2.score(x_test, y_test))
    print('套索回归2中选取的特征数:', np.sum(lasso2.coef_ != 0))
    # 通过可视化来进行分析--岭回归和线性回归的系数对比
    import matplotlib.pyplot as plt
    plt.plot(lasso.coef_, '^', label='lasso alpha=1')
    plt.plot(lasso2.coef_, 'v', label='lasso alpha=0.00001')
    plt.plot(lasso1.coef_, 's', label='lasso alpha=0.1')
    plt.plot(ridge.coef_, '>', label='ridge alpha=1')
    plt.plot(ridge01.coef_, 'o', label='ridge alpha=0.1')
    plt.legend(ncol=2,loc=(0,1.05))
    plt.xlabel('cofficient index')
    plt.ylabel('coefficient magnitude')
    plt.show()
z3()
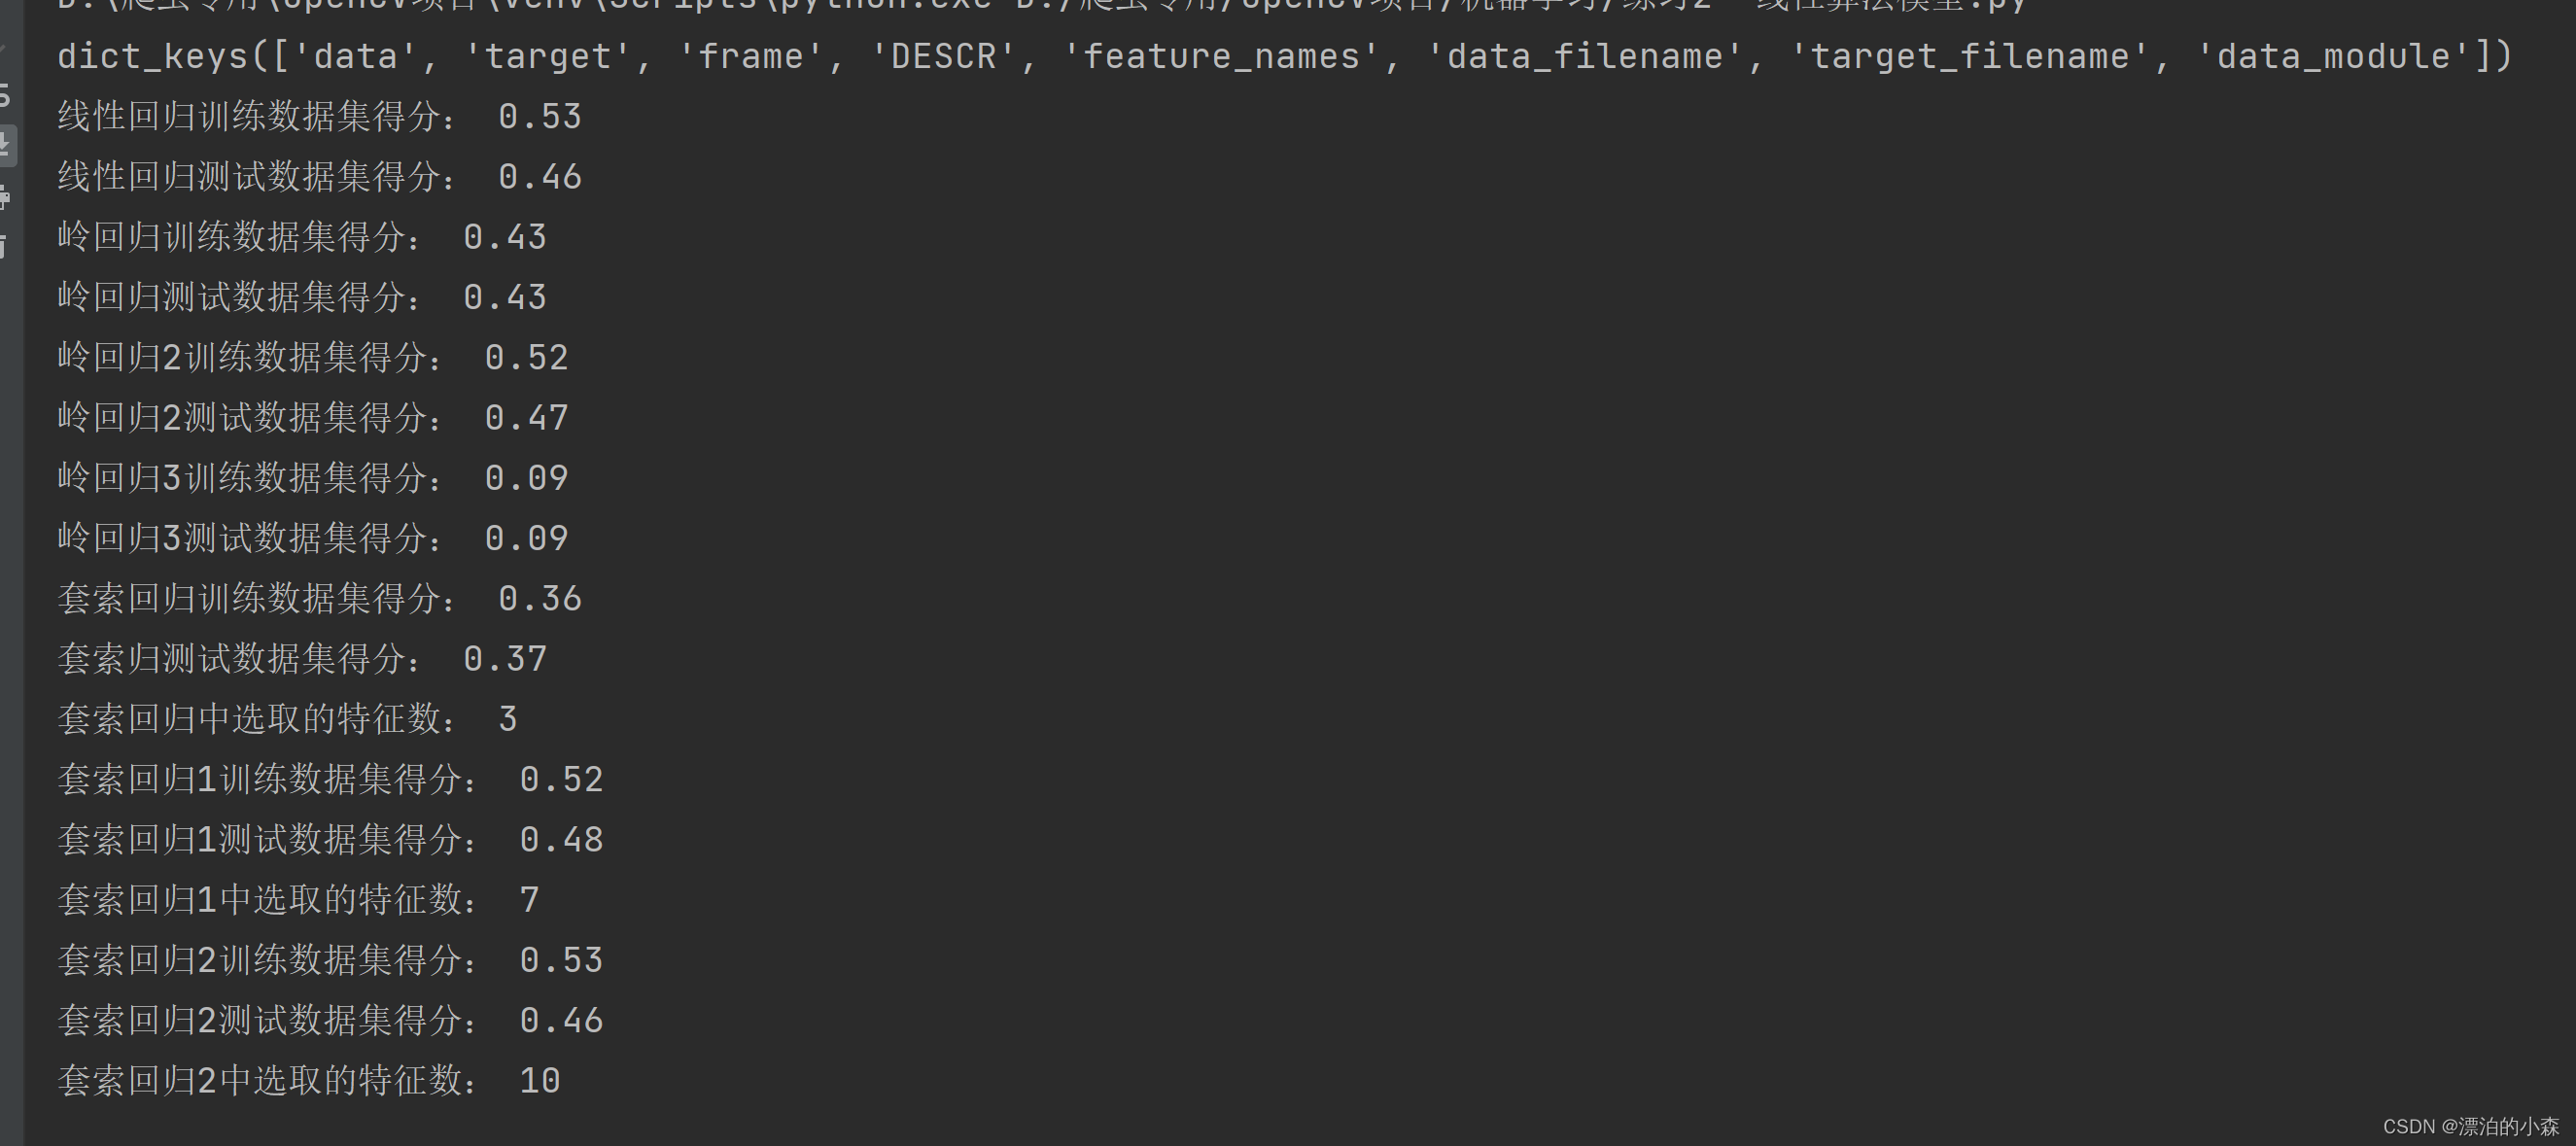
下面是运行结果:


更多推荐
 已为社区贡献2条内容


所有评论(0)