
Python可视化交互库——dash
Dash是一款构建web应用的Python框架,建立在 Plotly.js, React 和 Flask 之上,将现代UI元素(如下拉框、滑块和图形)直接与Python代码绑定
| 有问题可联系 |

文章目录
简介
Dash 是一款构建 Web 应用的 Python 低代码框架,建立在 Plotly.js、React 和 Flask 之上,将现代 UI 元素如下拉框、滑块和图形直接与 Python 代码绑定,快速打造出演示程序。
| App | Description |
|---|---|
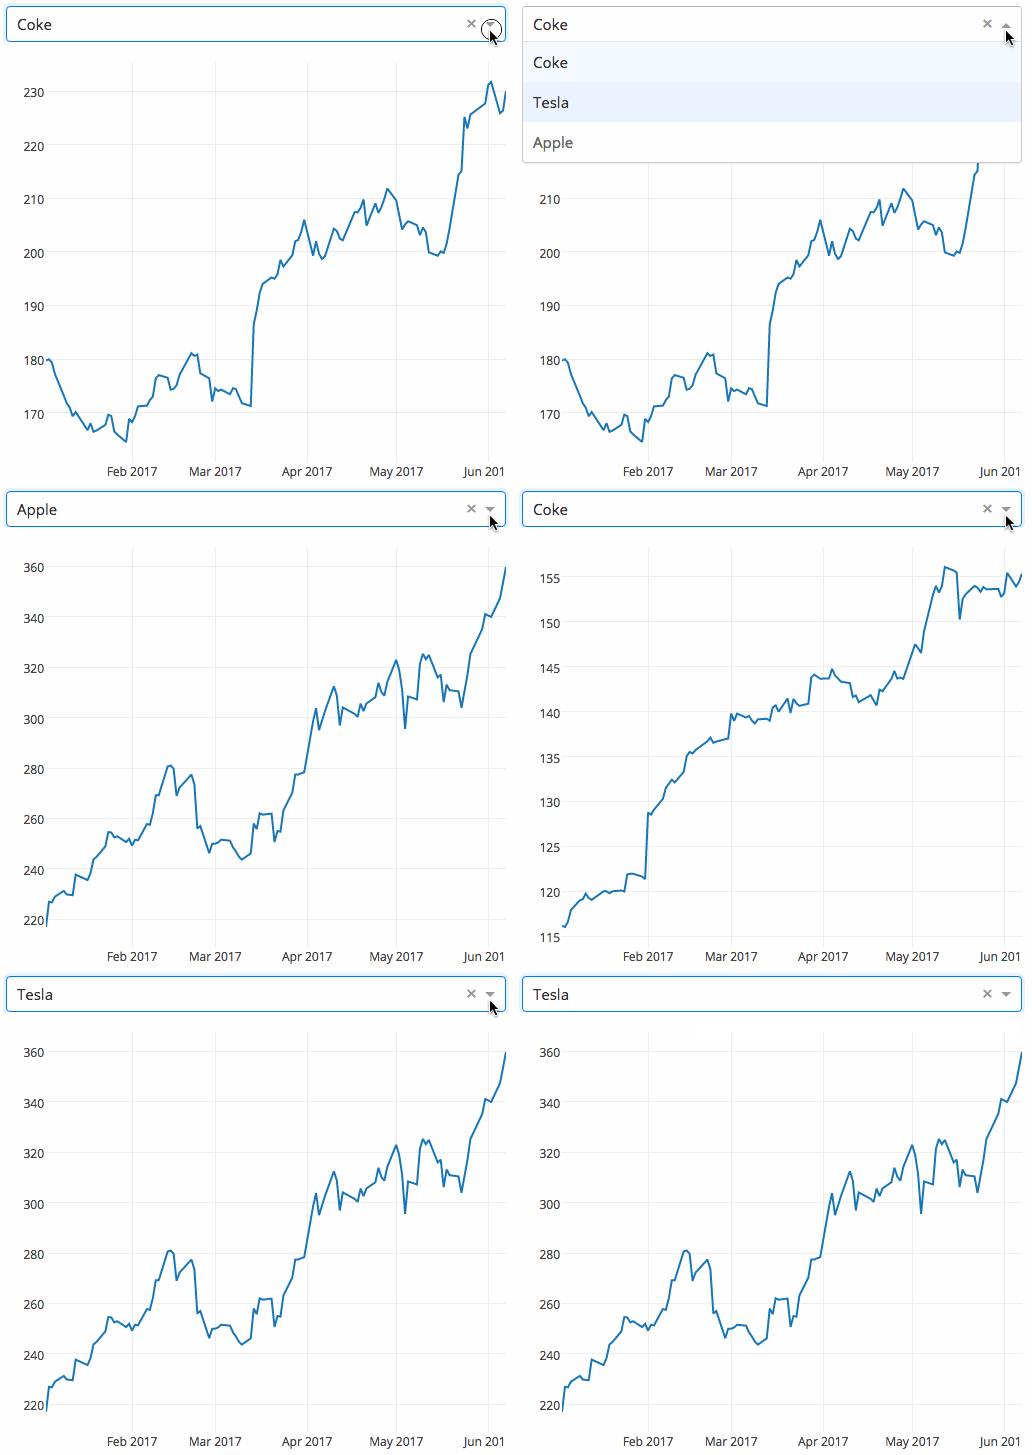 | 将下拉菜单绑定到 D3.js 的绘图 |
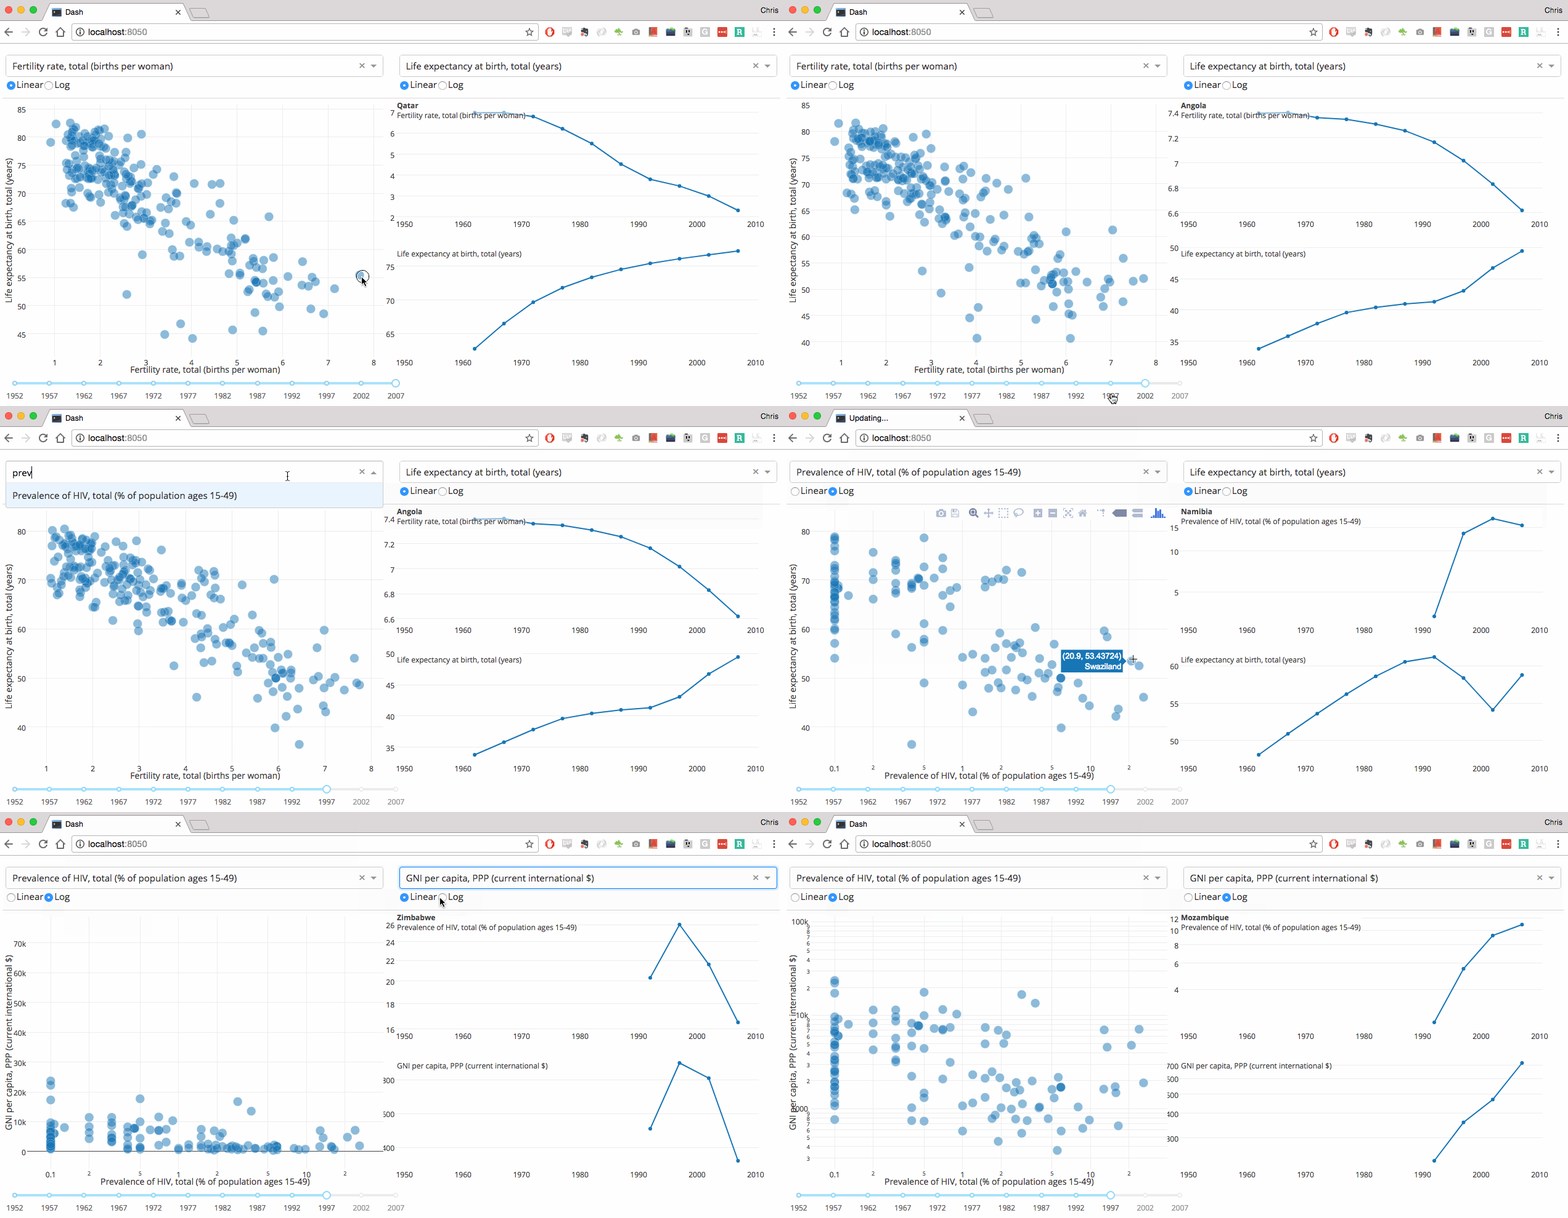 | Dash 代码是声明式和响应式的,更容易构建复杂交互程序 |
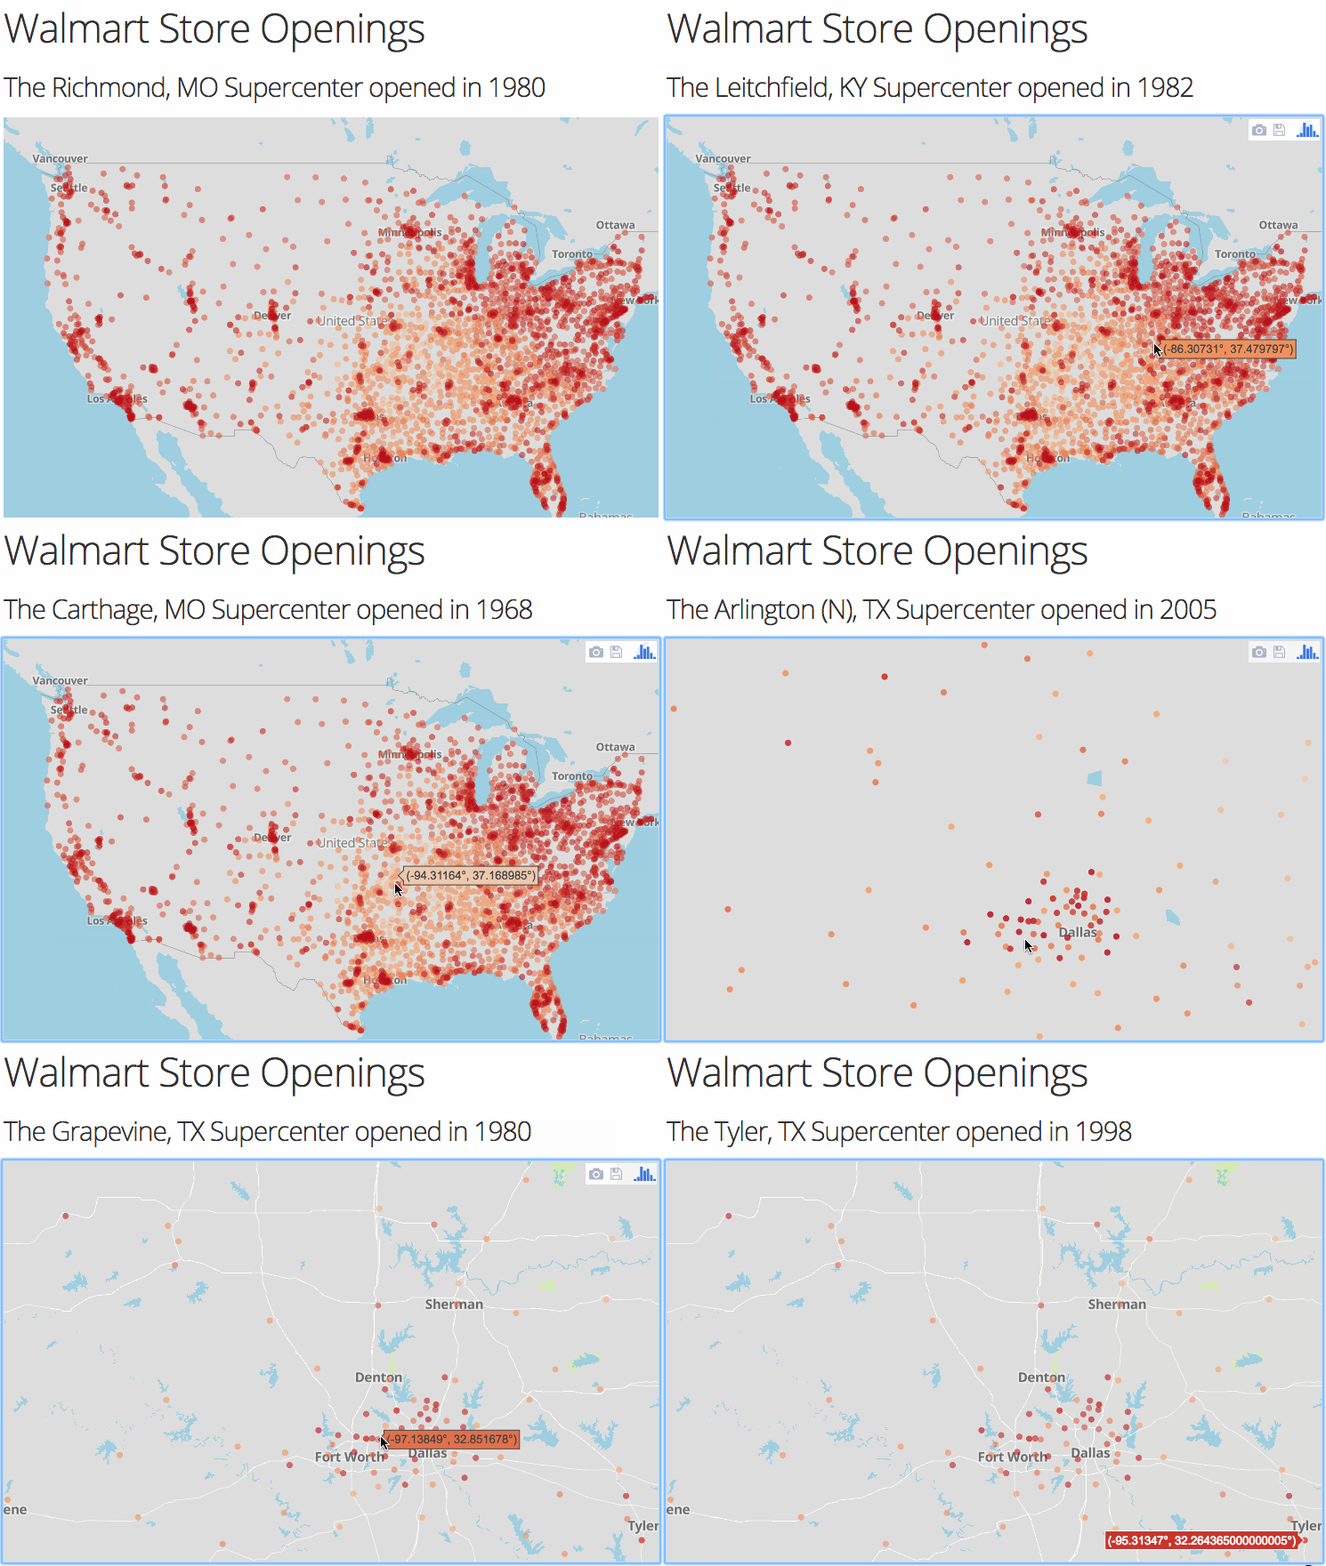 | Dash使用 Plotly.js 绘图,支持超过 35 种类型,包括地图 |
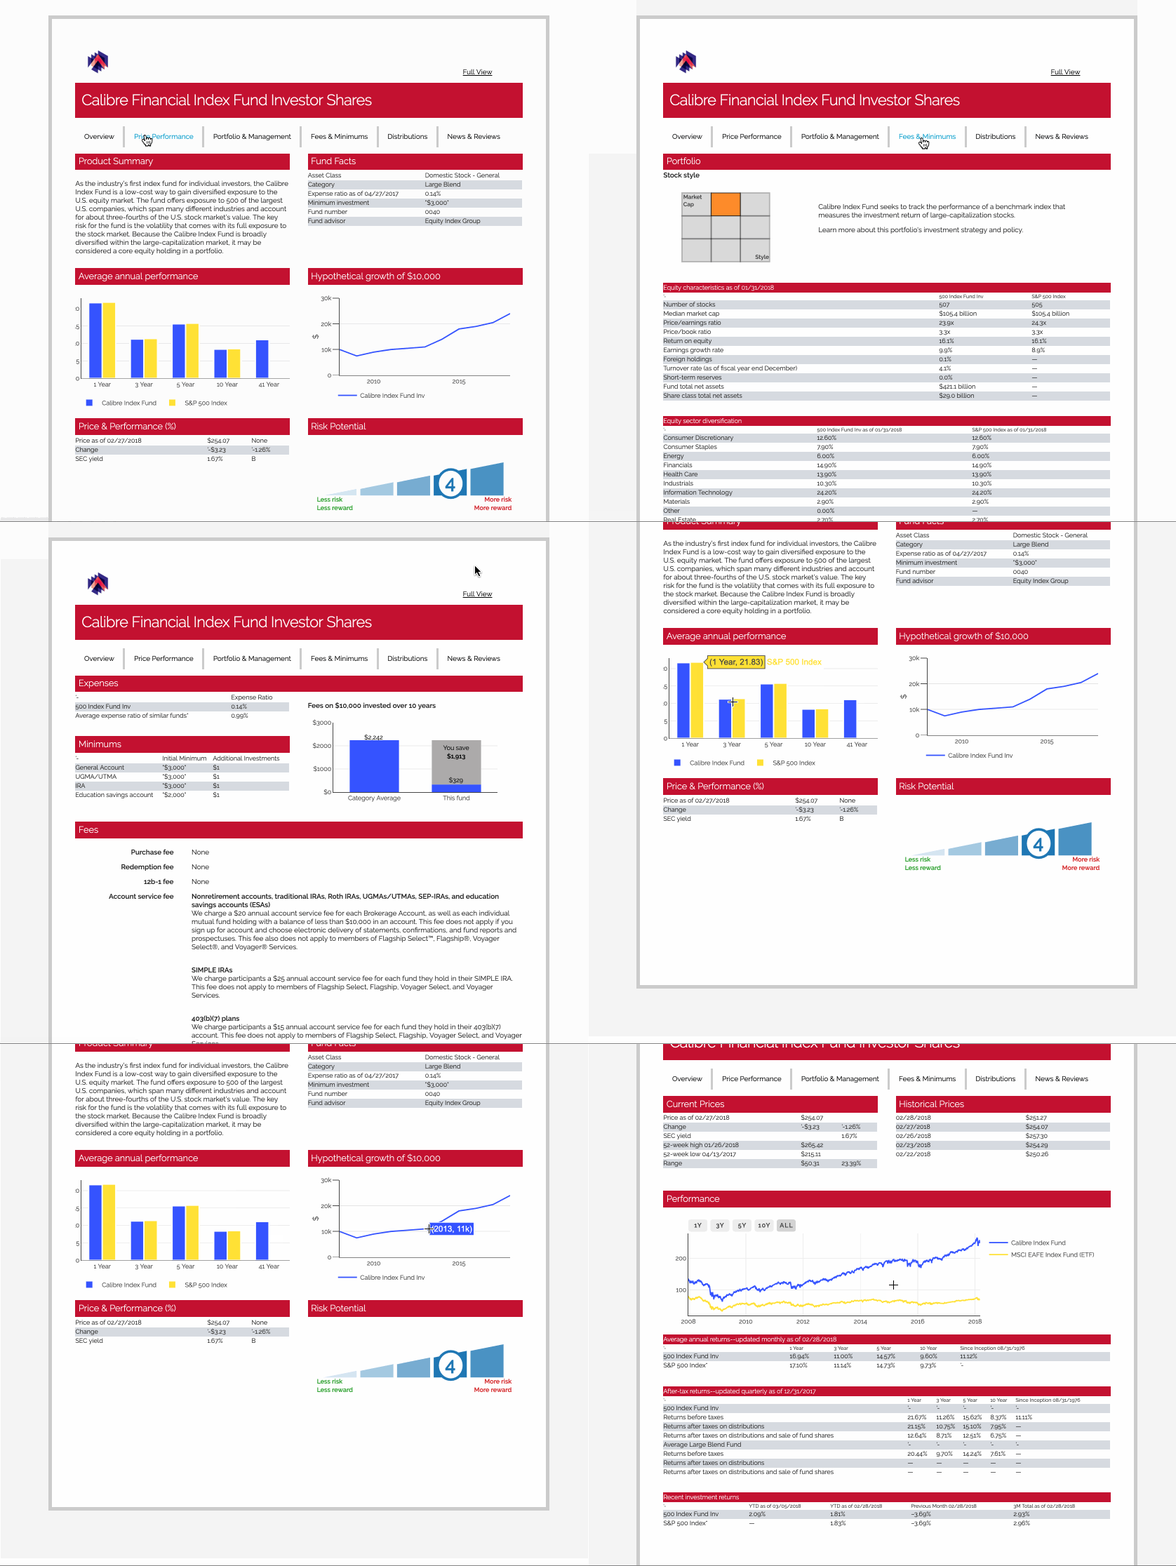 | Dash 不只是仪表盘,可以完全控制应用的外观。如图是一种 PDF 风格的 Dash 应用 |
安装
pip install dash
pip install pandas
本文版本为:dash==2.3.1
初试
import pandas as pd
import plotly.express as px
from dash import Dash, html, dcc

app = Dash()
df = pd.DataFrame({'x': [1, 2, 3], 'SF': [4, 1, 2], 'Montreal': [2, 4, 5]})  # 原始数据
fig = px.bar(df, x='x', y=['SF', 'Montreal'], barmode='group')  # 柱状图

app.layout = html.Div(children=[
    html.H1(children='Hello Dash'),
    html.Div(children='Dash: 一款Python web应用框架'),
    dcc.Graph(id='example-graph', figure=fig)
])

if __name__ == '__main__':
    app.run_server(debug=True)
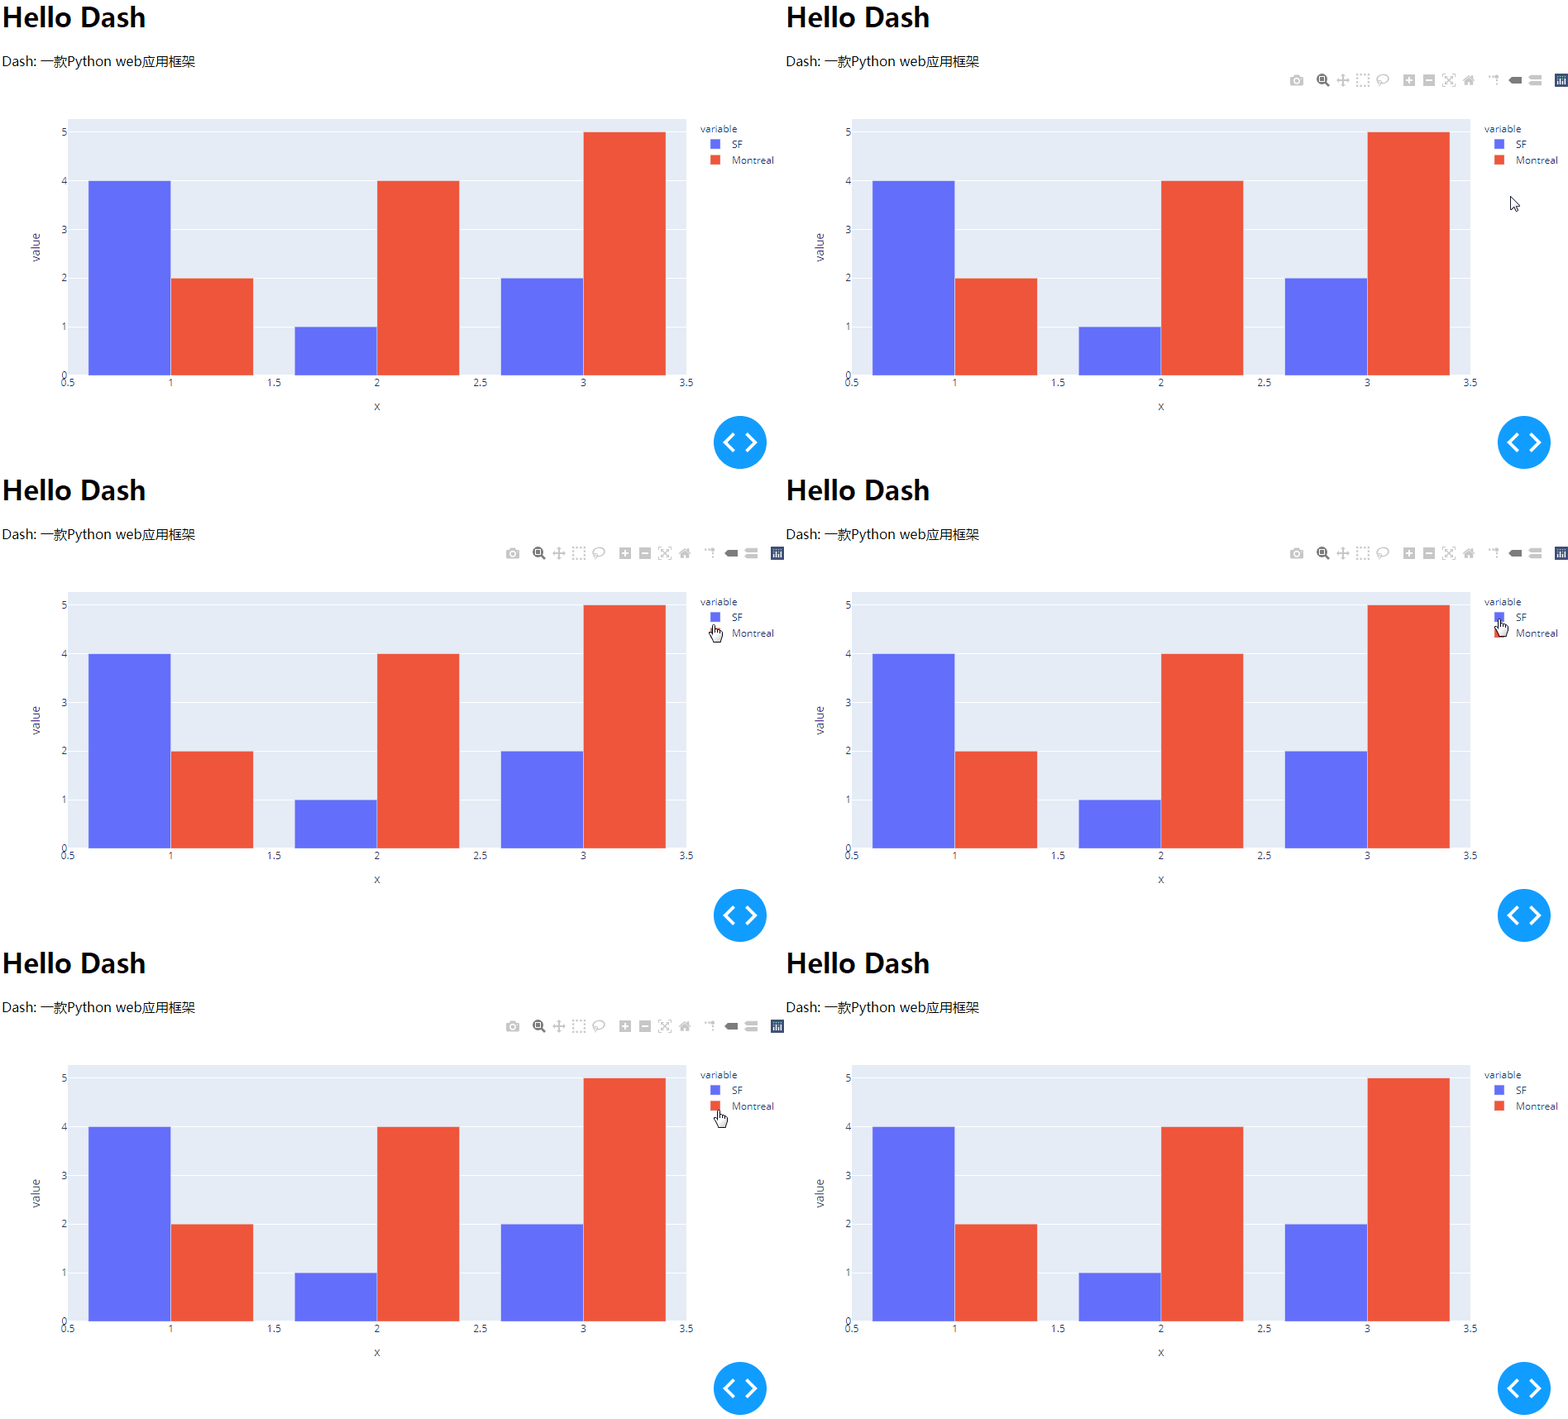
- 布局
layout就像 HTML 一样,由一棵组件树构成。如代码中的html.H1、html.Div、dcc.Graph。 - 模块
dash.html包含所有 HTML 标签,如html.H1(children='Hello Dash')实际上生成的 HTML 代码为<h1>Hello Dash</h1>。 - 不是所有组件都是纯 HTML,模块
dash.dcc包含交互的高级组件,底层通过 React.js、JavaScript、HTML、CSS实现。 - 每个组件通过关键字参数进行描述。
- 属性
children比较特殊,为了方便,它总是第一个属性,因此不用关键字参数来描述。 app.run_server(debug=True)可实现热加载,即修改代码后会自动刷新浏览器,不喜欢的话可以设为False。
热更新
热更新默认不开启
app.run_server(debug=True) 激活 Dash 的热更新,一旦修改代码,Dash 会自动刷新浏览器
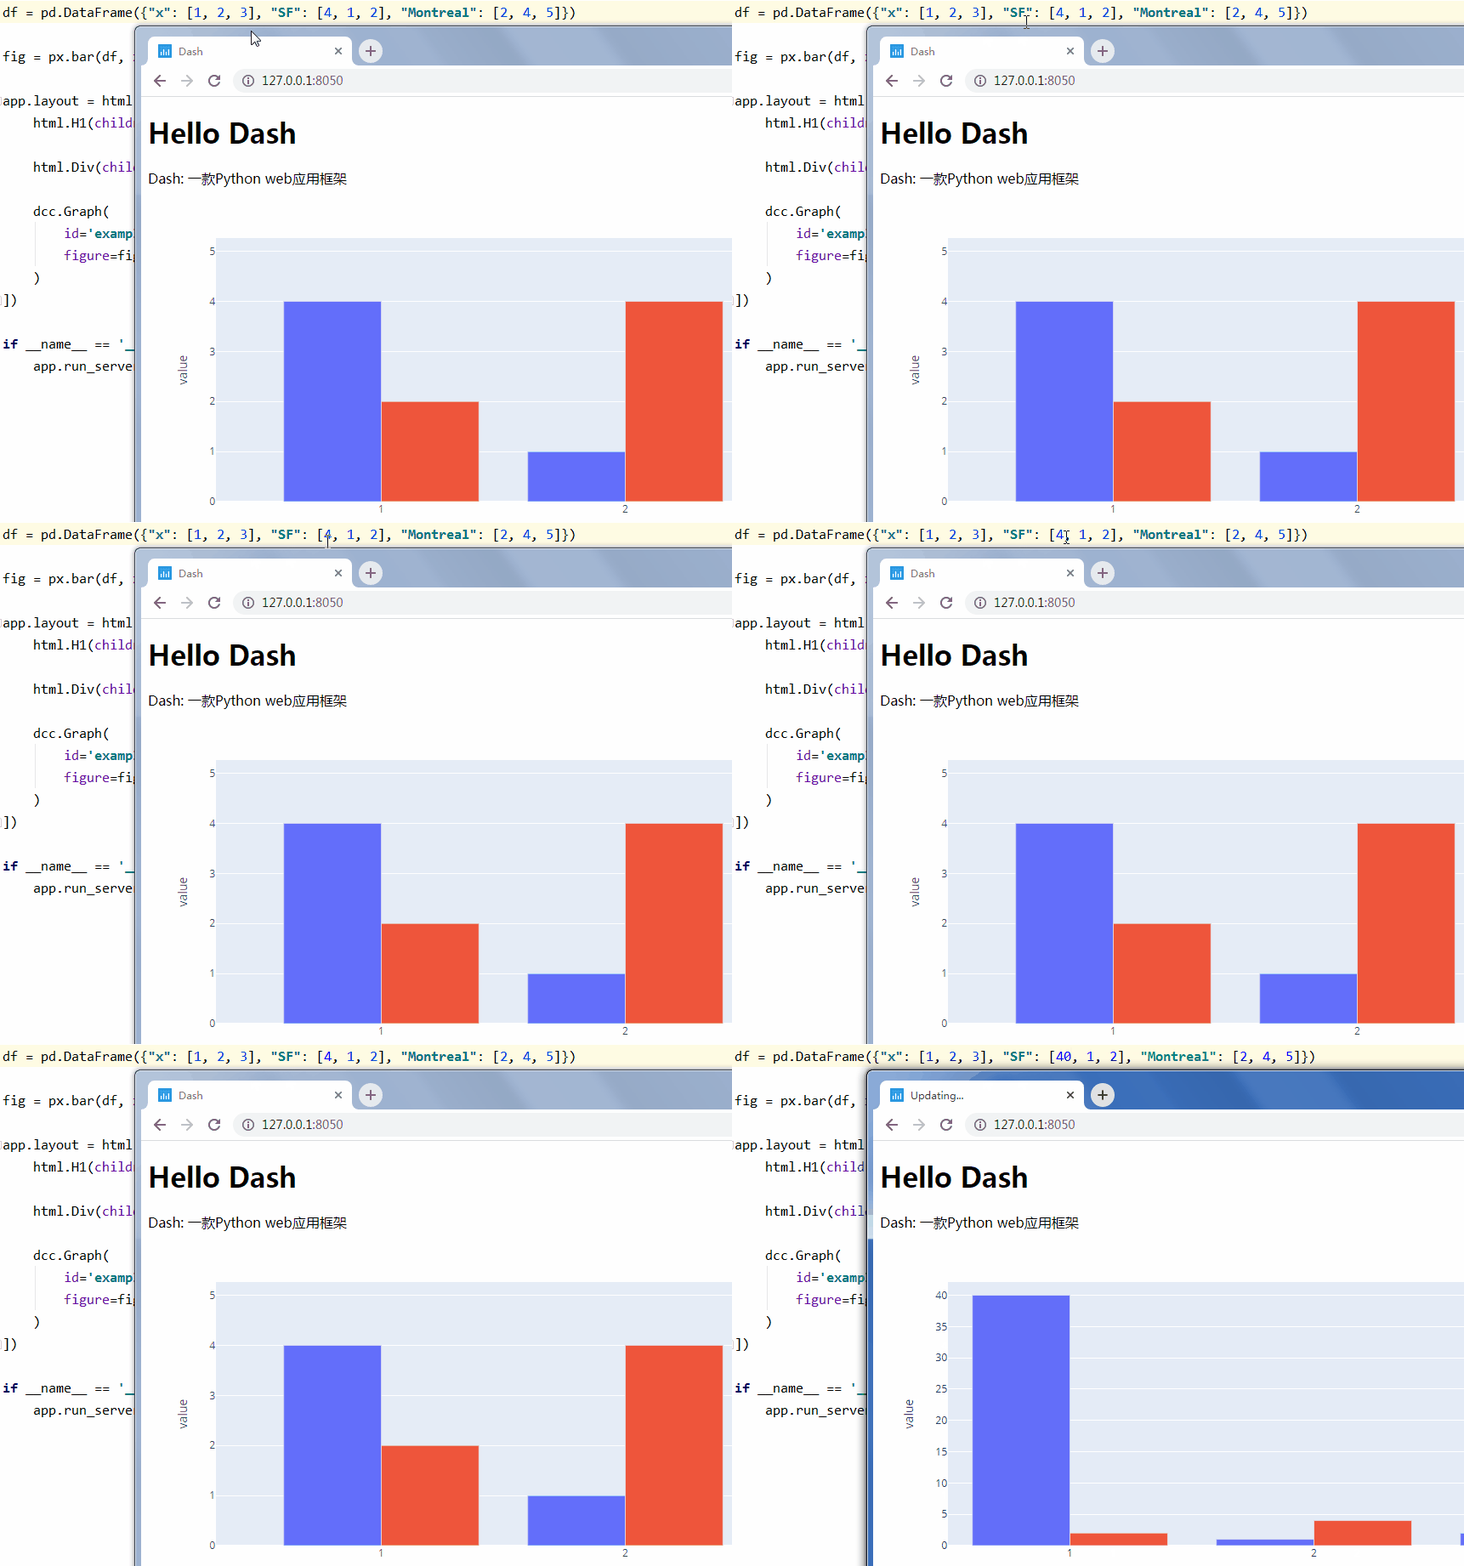
设置 CSS
CSS,Cascading Style Sheets,层叠样式表,用于静态修饰网页,让页面更漂亮。
初始化 Dash 时声明参数 external_stylesheets 可预设 CSS。
external_stylesheets = ['https://codepen.io/chriddyp/pen/bWLwgP.css']

app = Dash(__name__, external_stylesheets=external_stylesheets)
HTML
- 模块
dash.html包含所有 HTML 标签 - 模块
dash.dcc包含交互的高级组件
import pandas as pd
import plotly.express as px
from dash import Dash, html, dcc

app = Dash()

colors = {
    'background': '#111111',
    'text': '#7FDBFF'
}  # 预设样式

df = pd.DataFrame({'x': [1, 2, 3], 'SF': [4, 1, 2], 'Montreal': [2, 4, 5]})  # 原始数据

fig = px.bar(df, x='x', y=['SF', 'Montreal'], barmode='group')  # 柱状图

fig.update_layout(
    plot_bgcolor=colors['background'],
    paper_bgcolor=colors['background'],
    font_color=colors['text']
)  # 更新柱状图样式

app.layout = html.Div(
    style={'backgroundColor': colors['background']},  # 全局样式
    children=[
        html.H1(
            children='Hello Dash',
            style={
                'textAlign': 'center',
                'color': colors['text']
            }
        ),

        html.Div(
            children='Dash: 一款Python web应用框架',
            style={
                'textAlign': 'center',
                'color': colors['text']
            }
        ),

        dcc.Graph(
            id='example-graph-2',
            figure=fig
        )
    ])

if __name__ == '__main__':
    app.run_server(debug=True)
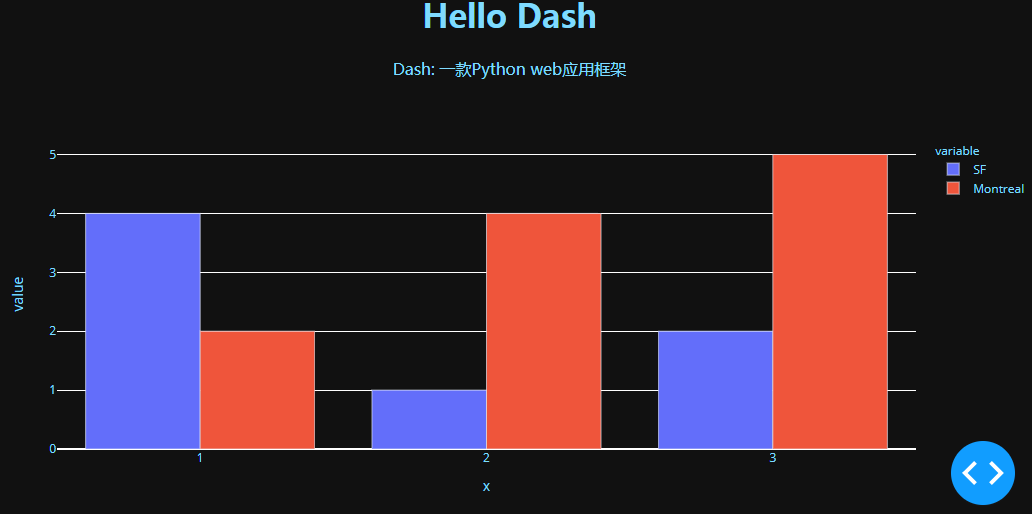
表格
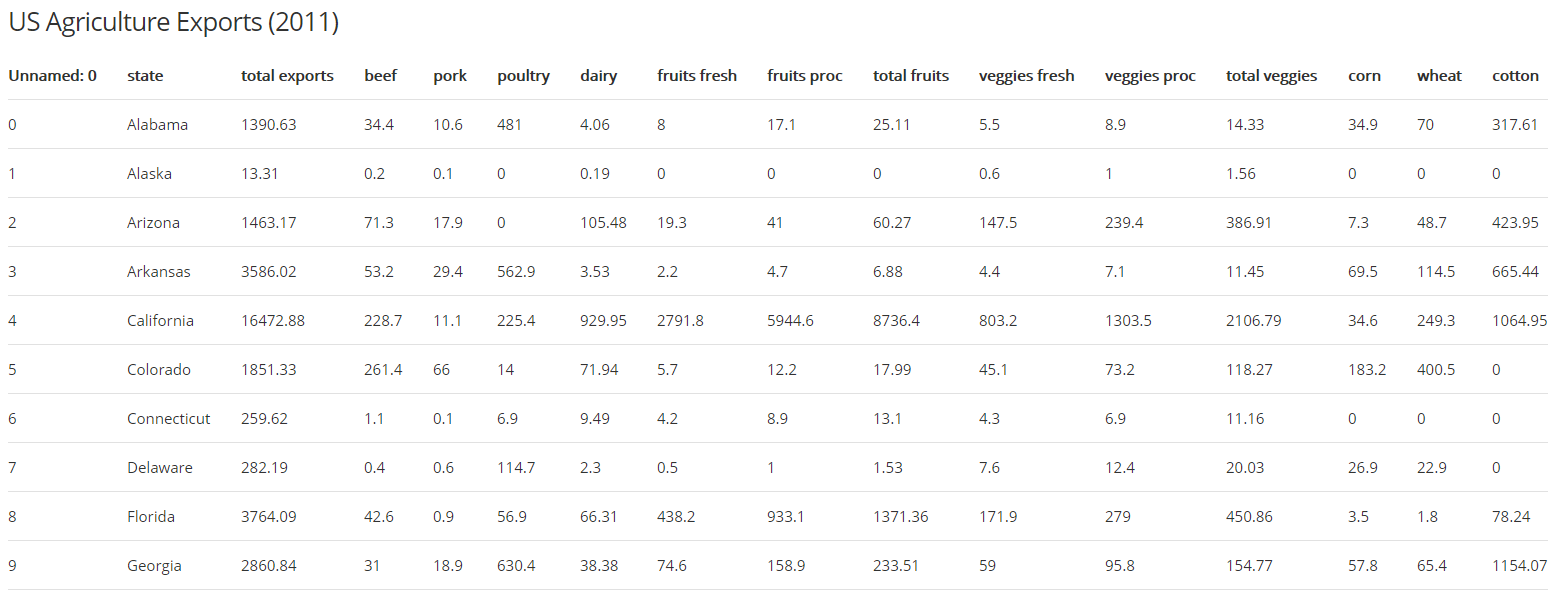
,state,total exports,beef,pork,poultry,dairy,fruits fresh,fruits proc,total fruits,veggies fresh,veggies proc,total veggies,corn,wheat,cotton
0,Alabama,1390.63,34.4,10.6,481.0,4.06,8.0,17.1,25.11,5.5,8.9,14.33,34.9,70.0,317.61
1,Alaska,13.31,0.2,0.1,0.0,0.19,0.0,0.0,0.0,0.6,1.0,1.56,0.0,0.0,0.0
2,Arizona,1463.17,71.3,17.9,0.0,105.48,19.3,41.0,60.27,147.5,239.4,386.91,7.3,48.7,423.95
3,Arkansas,3586.02,53.2,29.4,562.9,3.53,2.2,4.7,6.88,4.4,7.1,11.45,69.5,114.5,665.44
4, California,16472.88,228.7,11.1,225.4,929.95,2791.8,5944.6,8736.4,803.2,1303.5,2106.79,34.6,249.3,1064.95
5,Colorado,1851.33,261.4,66.0,14.0,71.94,5.7,12.2,17.99,45.1,73.2,118.27,183.2,400.5,0.0
6,Connecticut,259.62,1.1,0.1,6.9,9.49,4.2,8.9,13.1,4.3,6.9,11.16,0.0,0.0,0.0
7,Delaware,282.19,0.4,0.6,114.7,2.3,0.5,1.0,1.53,7.6,12.4,20.03,26.9,22.9,0.0
8,Florida,3764.09,42.6,0.9,56.9,66.31,438.2,933.1,1371.36,171.9,279.0,450.86,3.5,1.8,78.24
9,Georgia,2860.84,31.0,18.9,630.4,38.38,74.6,158.9,233.51,59.0,95.8,154.77,57.8,65.4,1154.07
用 Python 编写 HTML 创建复杂的可重用组件
import pandas as pd
from dash import Dash, html


def generate_table(dataframe, max_rows=10):
    """生成表格"""
    return html.Table([
        html.Thead(
            html.Tr([html.Th(col) for col in dataframe.columns])
        ),
        html.Tbody([
            html.Tr([
                html.Td(dataframe.iloc[i][col]) for col in dataframe.columns
            ]) for i in range(min(len(dataframe), max_rows))
        ])
    ])


external_stylesheets = ['https://codepen.io/chriddyp/pen/bWLwgP.css']
app = Dash(__name__, external_stylesheets=external_stylesheets)
df = pd.read_csv('美国农业出口数据.csv')
app.layout = html.Div(
    children=[
        html.H4(children='US Agriculture Exports (2011)'),
        generate_table(df)
    ])

if __name__ == '__main__':
    app.run_server(debug=True)
import pandas as pd
from dash import Dash, dash_table

df = pd.read_csv('美国农业出口数据.csv')
app = Dash()
app.layout = dash_table.DataTable(
    id='table',
    columns=[{'name': i, 'id': i} for i in df.columns],
    data=df.to_dict('rows'),
    style_cell={'fontSize': 20, 'font-family': 'sans-serif'}
)

if __name__ == '__main__':
    app.run_server(debug=True)

可视化组件
模块 dash.dcc 的 Graph 使用开源 JavaScript 库 plotly.js,支持超过 35 种图表类型,并以矢量 SVG 和高性能 WebGL 呈现。
更多组件查阅 plotly.py
import pandas as pd
import plotly.express as px
from dash import Dash, html, dcc

app = Dash()
df = pd.read_csv('GDP与人均寿命.csv')
fig = px.scatter(df, x='gdp per capita', y='life expectancy',
                 size='population', color='continent', hover_name='country',
                 log_x=True, size_max=60)  # 散点图
app.layout = html.Div([
    dcc.Graph(id='life-exp-vs-gdp', figure=fig)
])

if __name__ == '__main__':
    app.run_server(debug=True)
X 轴为人均国民生产总值,Y 轴为平均寿命
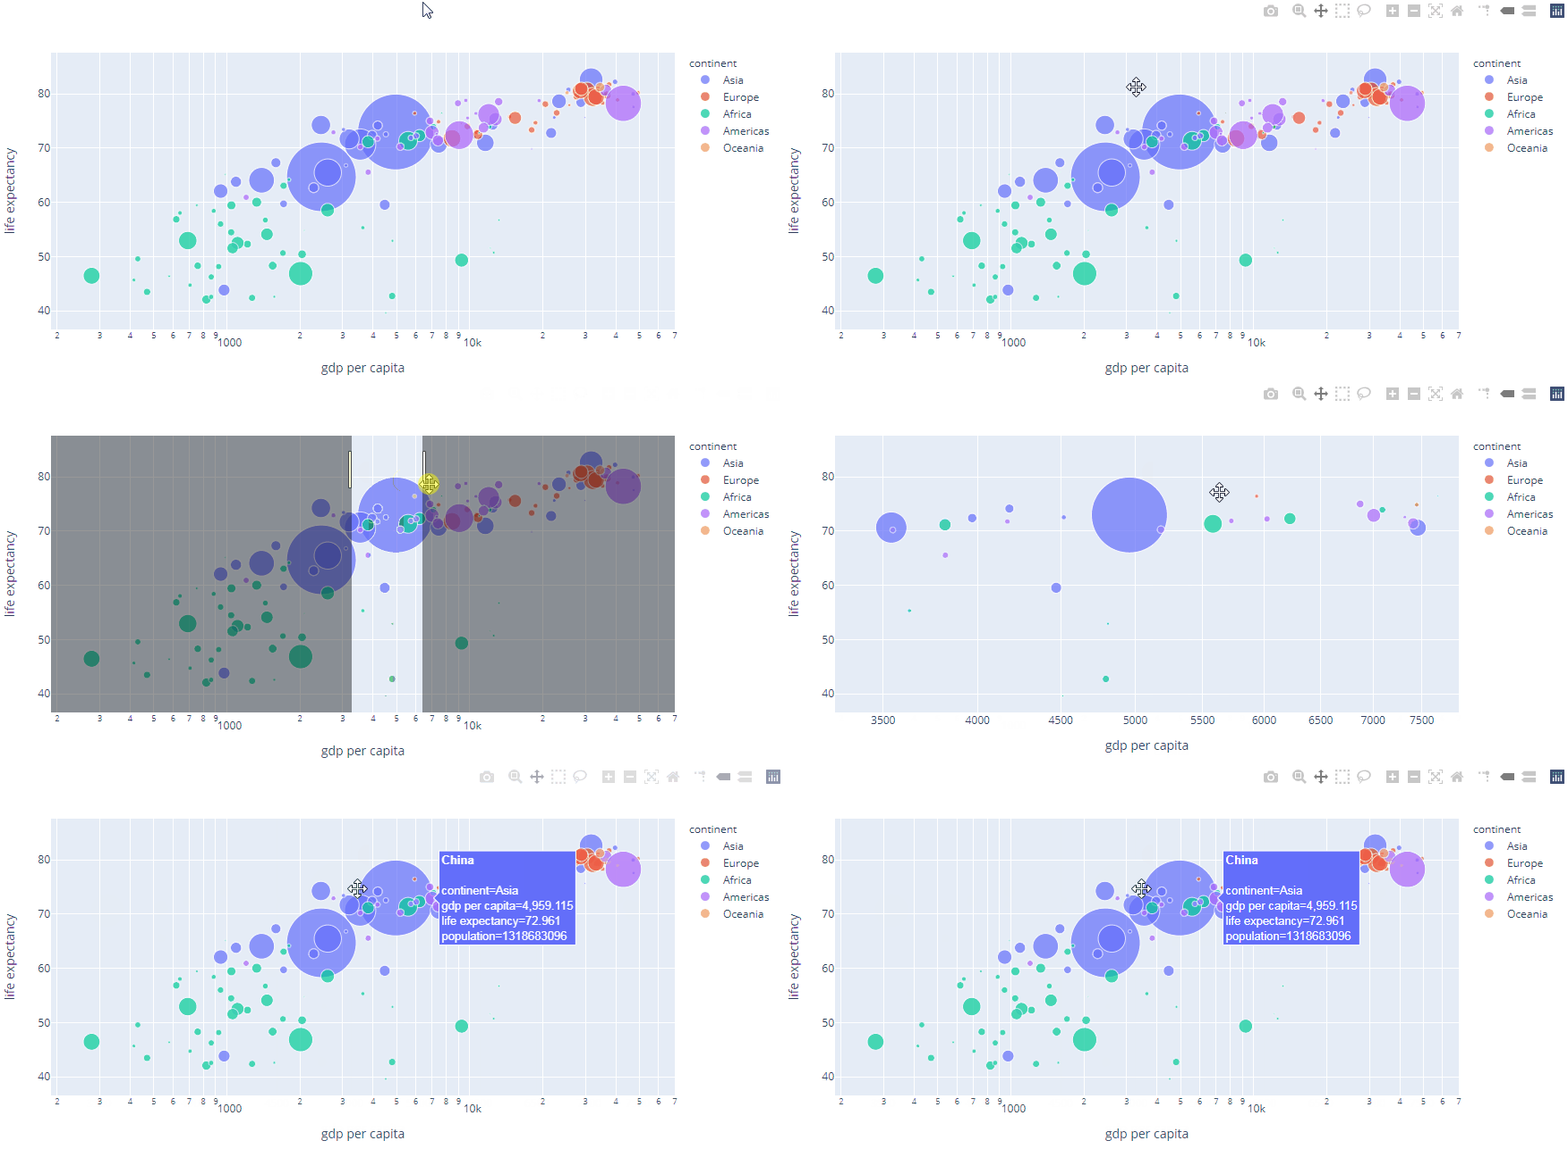
图表可交互:
- 悬停:看值
- 单击:跟踪
- 双击:复原
- Shift + 拖动:放大
Markdown
模块 dash.dcc 的 Markdown
from dash import Dash, html, dcc

app = Dash()

markdown_text = '''
# 质能方程

$E_0=mc^2$
'''

app.layout = html.Div([
    dcc.Markdown(children=markdown_text, mathjax=True)
])

if __name__ == '__main__':
    app.run_server(debug=True)
Dash 使用 Markdown 通用标记规范,渲染效果可对比 Cmd Markdown

本人测试不通过:
- 注脚
- 流程图
- 序列图
- 甘特图
安装扩展可支持,详细阅读 mermaid-js,甘特图
pip install dash_extensions
代码
from dash import Dash, html
from dash_extensions import Mermaid

app = Dash()

flow_chart = '''
flowchart LR
A[Hard] -->|Text| B(Round)
B --> C{Decision}
C -->|One| D[Result 1]
C -->|Two| E[Result 2]
'''

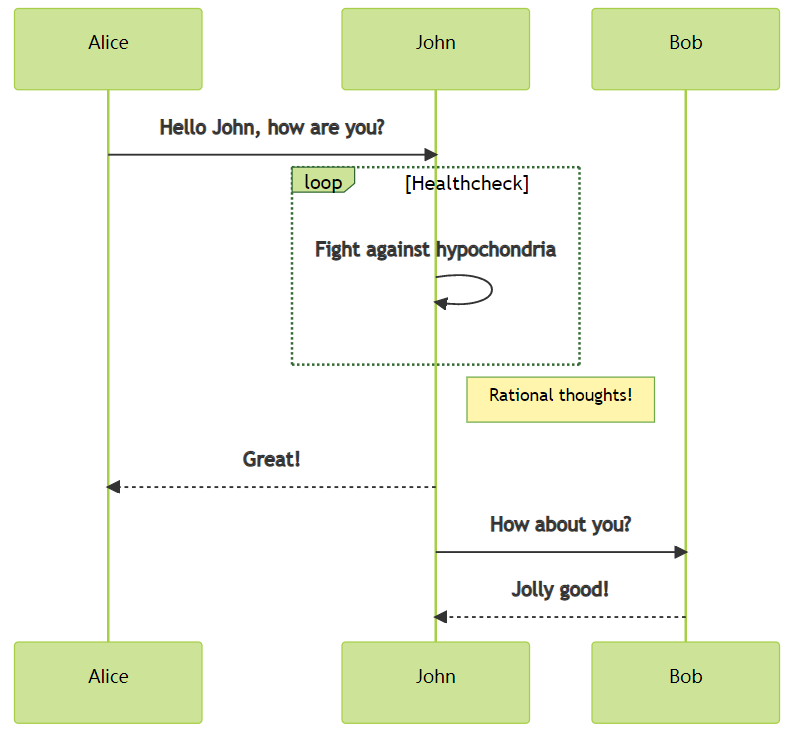
sequence_chart = '''
sequenceDiagram
Alice->>John: Hello John, how are you?
loop Healthcheck
    John->>John: Fight against hypochondria
end
Note right of John: Rational thoughts!
John-->>Alice: Great!
John->>Bob: How about you?
Bob-->>John: Jolly good!
'''

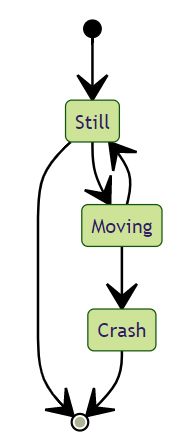
state_chart = '''
stateDiagram-v2
[*] --> Still
Still --> [*]
Still --> Moving
Moving --> Still
Moving --> Crash
Crash --> [*]
'''

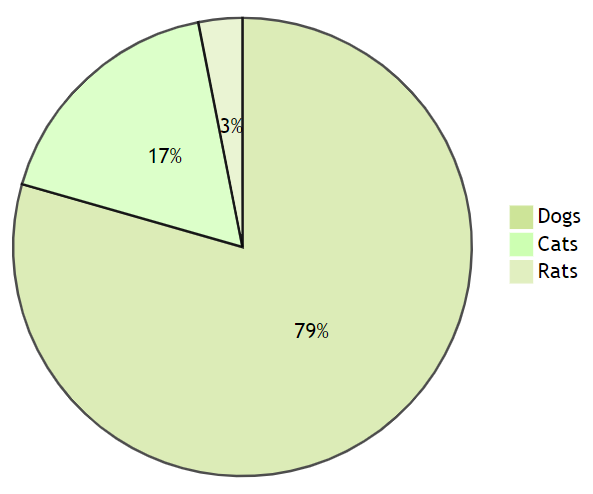
pie_chart = '''
pie
"Dogs" : 386
"Cats" : 85
"Rats" : 15
'''

app.layout = html.Div([
    Mermaid(chart=flow_chart),  # 流程图
    Mermaid(chart=sequence_chart),  # 时序图
    Mermaid(chart=state_chart),  # 状态图
    Mermaid(chart=pie_chart),  # 饼图
])

if __name__ == '__main__':
    app.run_server(debug=True)

核心组件
模块 dash.dcc 提供了一系列高级组件,如下拉菜单、图表、Markdown 等
查看所有组件:Dash Core Components
- 下拉框 Dropdown
- 滚动条 Slider
- 范围滚动条 RangeSlider
- 输入框 Input
- 文本框 Textarea
- 复选框 Checkboxes
- 单选框 Radio Items
- 按钮 Button
- 日期选择器 DatePickerSingle
- 日期范围选择器 DatePickerRange
- 轻量级标记语言 Markdown
- 上传组件 Upload Component
- 下载组件 Download Component
- 标签 Tabs
- 图像 Graphs
- 确认对话框 ConfirmDialog
- 存储组件 Store
- 加载组件 Loading component
- 地址定位 Location
from dash import Dash, html, dcc

app = Dash()

app.layout = html.Div([
    html.Label('Dropdown 单选下拉框'),
    dcc.Dropdown(
        options=[
            {'label': '北京', 'value': 'BJ'},
            {'label': '上海', 'value': 'SH'},
            {'label': '广州', 'value': 'GZ'}
        ],
        value='GZ'  # 默认值
    ),
    html.Br(),  # 换行

    html.Label('Dropdown 多选下拉框'),
    dcc.Dropdown(
        options=[
            {'label': '北京', 'value': 'BJ'},
            {'label': '上海', 'value': 'SH'},
            {'label': '广州', 'value': 'GZ'}
        ],
        value=['BJ', 'GZ'],
        multi=True  # 多选
    ),
    html.Br(),

    html.Label('RadioItems 单选按钮'),
    dcc.RadioItems(
        options=[
            {'label': '北京', 'value': 'BJ'},
            {'label': '上海', 'value': 'SH'},
            {'label': '广州', 'value': 'GZ'}
        ],
        value='GZ'
    ),
    html.Br(),

    html.Label('Checklist 复选按钮'),
    dcc.Checklist(
        options=[
            {'label': '北京', 'value': 'BJ'},
            {'label': '上海', 'value': 'SH'},
            {'label': '广州', 'value': 'GZ'}
        ],
        value=['BJ', 'GZ']
    ),
    html.Br(),

    html.Label('Input 输入框'),
    html.Br(),
    dcc.Input(value='广州', type='text'),
    html.Br(),
    html.Br(),

    html.Label('Slider 滑动条'),
    dcc.Slider(
        min=0,
        max=9,
        marks={i: str(i) for i in range(10)},  # 传入字典作为标记显示
        value=3,
    ),
    html.Br(),
])

if __name__ == '__main__':
    app.run_server(debug=True)
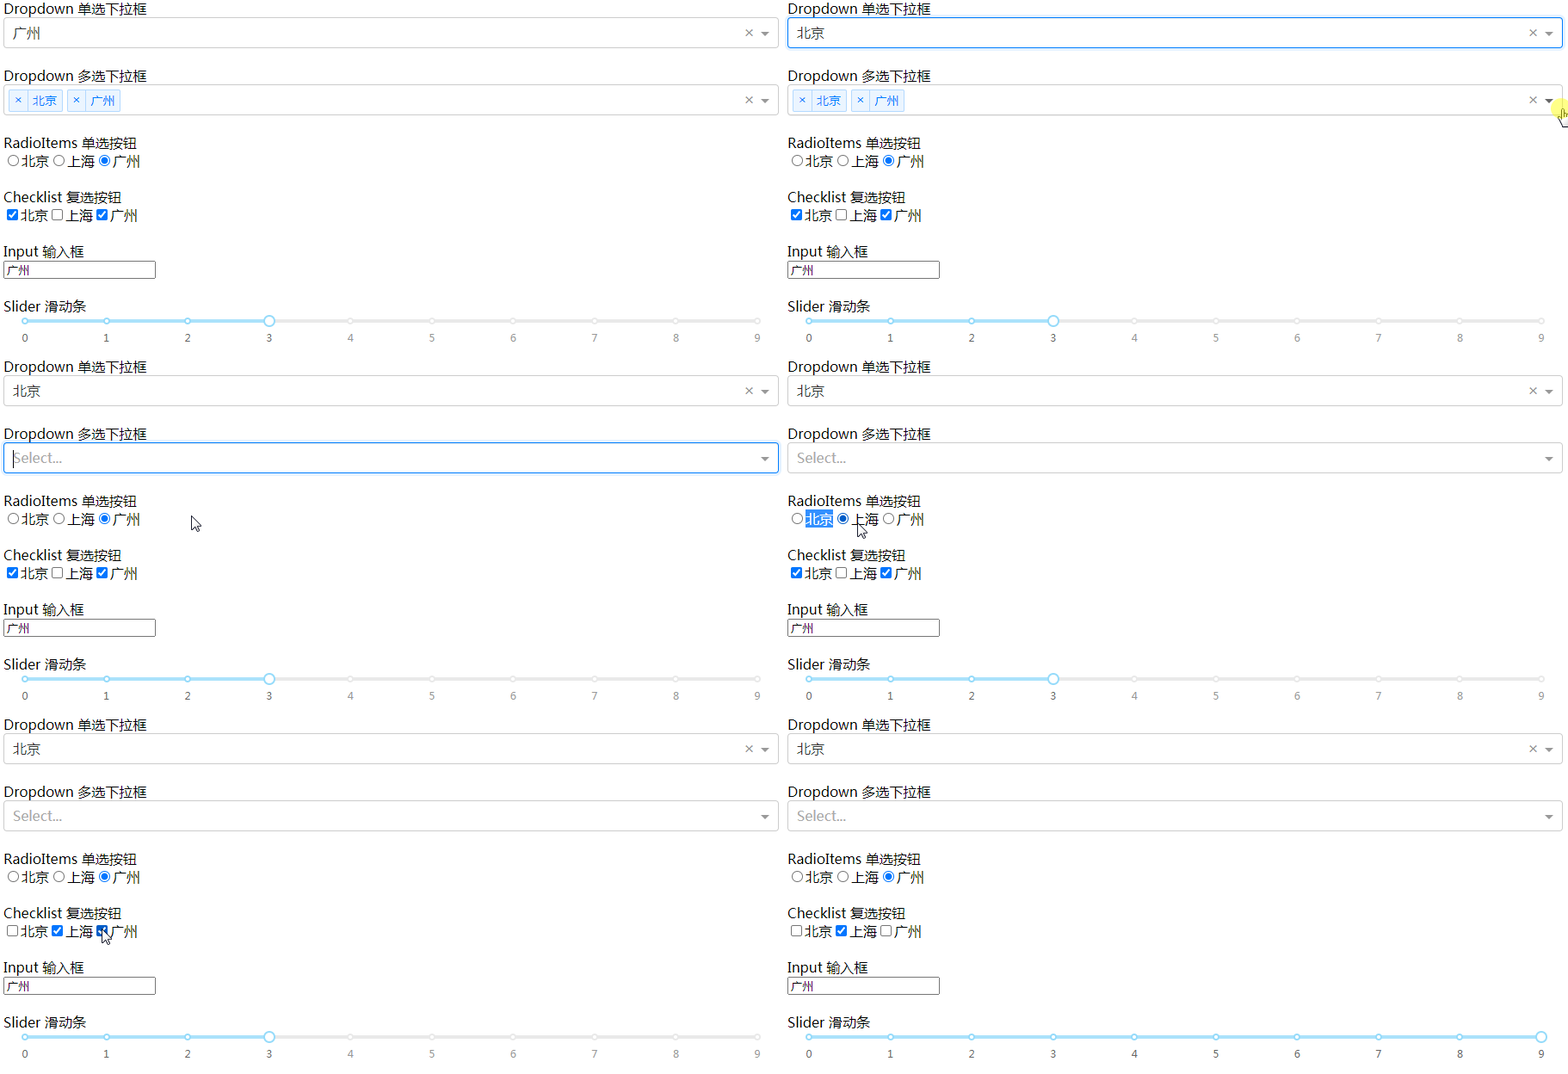
回调函数
Dash 应用由两部分组成:
layout:布局,外观callback:交互
通过修饰器 app.callback 定义 Output 和 Input
from dash import Dash, html, dcc, Input, Output

app = Dash()

app.layout = html.Div([
    html.H1('智能聊天机器人'),
    dcc.Input(id='input', value='在吗?', type='text'),
    html.Div(id='output')
])


@app.callback(
    Output(component_id='output', component_property='children'),  # 输出到id为output的children
    Input(component_id='input', component_property='value')  # 输入取id为input的value
)
def update_output_div(input_value):
    """AI核心代码,估值1个亿"""
    return input_value.replace('吗', '').replace('?', '!').replace('?', '!')


if __name__ == '__main__':
    app.run_server(debug=True)

回调函数默认在一开始调用,可使用参数 prevent_initial_call=True 关闭该特性。
滑块更新图表
import pandas as pd
import plotly.express as px
from dash import Dash, html, dcc, Input, Output

df = pd.read_csv('每五年GDP与人均寿命.csv')

app = Dash()

app.layout = html.Div([
    dcc.Graph(id='graph-with-slider'),
    dcc.Slider(
        id='year-slider',
        min=df['year'].min(),
        max=df['year'].max(),
        value=df['year'].min(),
        marks={str(year): str(year) for year in df['year'].unique()},
        step=None
    )
])


@app.callback(
    Output('graph-with-slider', 'figure'),
    [Input('year-slider', 'value')]
)
def update_figure(selected_year):
    filtered_df = df[df.year == selected_year]
    fig = px.scatter(filtered_df, x='gdpPercap', y='lifeExp',
                     size='pop', color='continent', hover_name='country',
                     log_x=True, size_max=60)
    fig.update_layout(transition_duration=500)  # 过渡时间
    return fig


if __name__ == '__main__':
    app.run_server(debug=True)
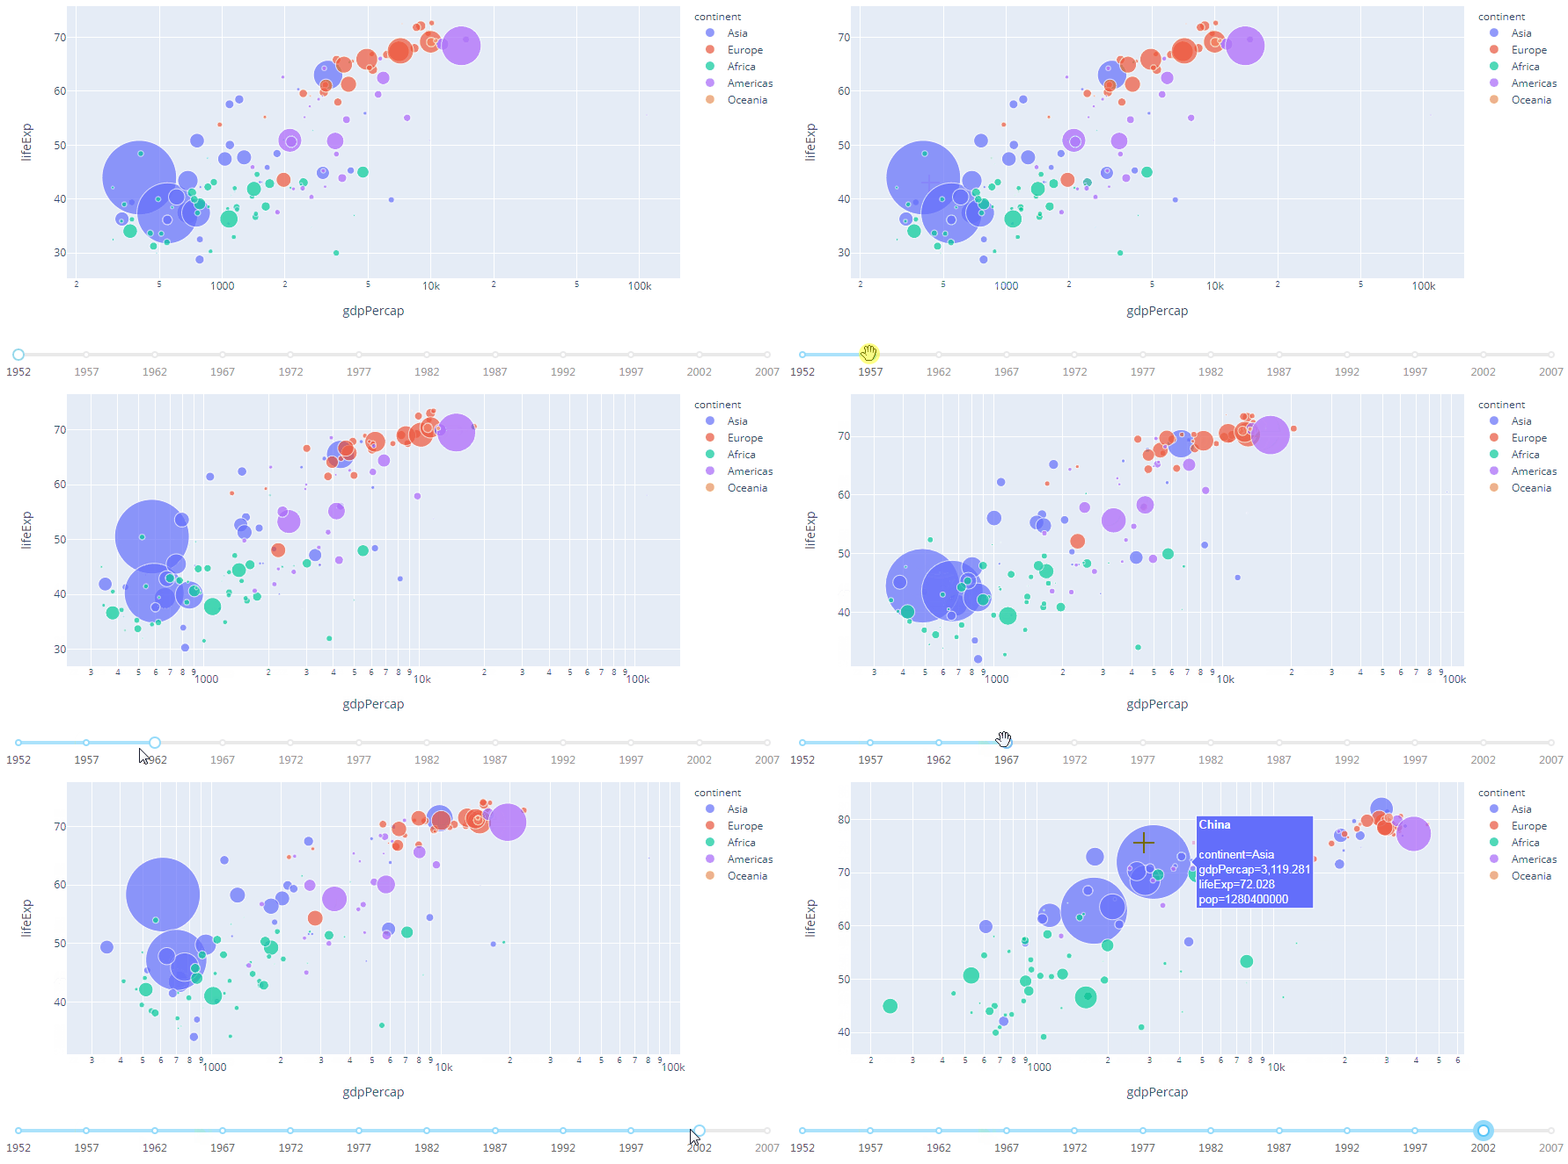
1952 年中国人均 GDP 只有 400 美元,平均寿命 44 岁。
50 年后,人均 GDP 飙升到 3119 美元,平均寿命达到 72 岁。
多个输入
import pandas as pd
import plotly.express as px
from dash import Dash, html, dcc, Input, Output

app = Dash()

df = pd.read_csv('国家及其指标.csv')

available_indicators = df['Indicator Name'].unique()  # 各种指标

app.layout = html.Div([
    html.Div([
        html.Div([
            dcc.Dropdown(
                id='xaxis-column',
                options=[{'label': i, 'value': i} for i in available_indicators],
                value='Fertility rate, total (births per woman)'
            ),
            dcc.RadioItems(
                id='xaxis-type',
                options=[{'label': i, 'value': i} for i in ['Linear', 'Log']],
                value='Linear',
                labelStyle={'display': 'inline-block'}
            )
        ],
            style={'width': '48%', 'display': 'inline-block'}),

        html.Div([
            dcc.Dropdown(
                id='yaxis-column',
                options=[{'label': i, 'value': i} for i in available_indicators],
                value='Life expectancy at birth, total (years)'
            ),
            dcc.RadioItems(
                id='yaxis-type',
                options=[{'label': i, 'value': i} for i in ['Linear', 'Log']],
                value='Linear',
                labelStyle={'display': 'inline-block'}
            )
        ], style={'width': '48%', 'float': 'right', 'display': 'inline-block'})
    ]),

    dcc.Graph(id='indicator-graphic'),

    dcc.Slider(
        id='year--slider',
        min=df['Year'].min(),
        max=df['Year'].max(),
        value=df['Year'].max(),
        marks={str(year): str(year) for year in df['Year'].unique()},
        step=None
    )
])


@app.callback(
    Output('indicator-graphic', 'figure'),
    [Input('xaxis-column', 'value'),
     Input('yaxis-column', 'value'),
     Input('xaxis-type', 'value'),
     Input('yaxis-type', 'value'),
     Input('year--slider', 'value')])
def update_graph(xaxis_column_name, yaxis_column_name, xaxis_type, yaxis_type, year_value):
    dff = df[df['Year'] == year_value]

    fig = px.scatter(x=dff[dff['Indicator Name'] == xaxis_column_name]['Value'],
                     y=dff[dff['Indicator Name'] == yaxis_column_name]['Value'],
                     hover_name=dff[dff['Indicator Name'] == yaxis_column_name]['Country Name'])

    fig.update_layout(margin={'l': 40, 'b': 40, 't': 10, 'r': 0}, hovermode='closest')

    fig.update_xaxes(title=xaxis_column_name, type='linear' if xaxis_type == 'Linear' else 'log')

    fig.update_yaxes(title=yaxis_column_name, type='linear' if yaxis_type == 'Linear' else 'log')

    return fig


if __name__ == '__main__':
    app.run_server(debug=True)
查看各国不同指标间的关系,如每位女性生娃数和平均寿命的关系
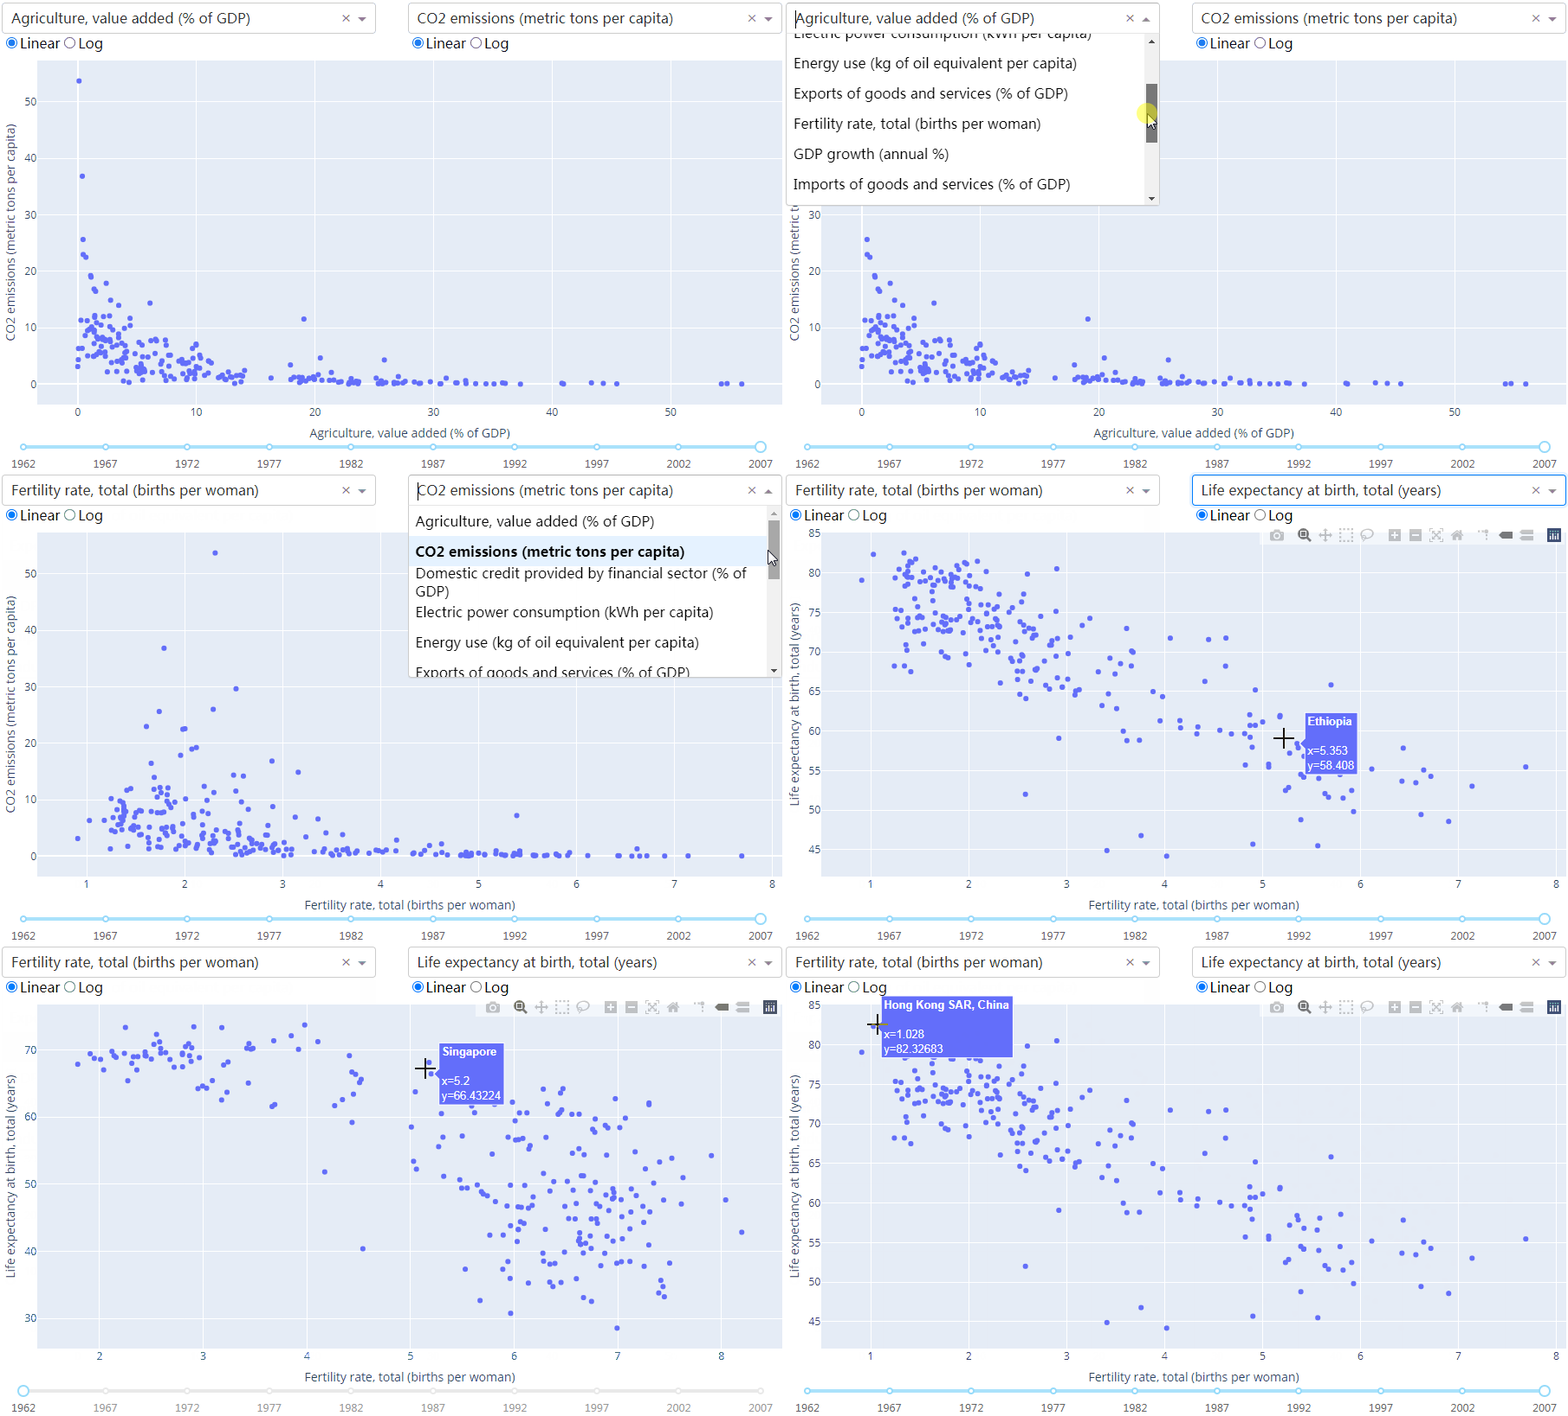
1962 年香港每位女性平均生 5 个孩子,平均寿命 68 岁。
2007 年香港每位女性平均生 1 个孩子,平均寿命 82 岁。
多个输出
from dash import Dash, html, dcc, Input, Output

app = Dash()

app.layout = html.Div([
    dcc.Input(
        id='num-multi',
        type='number',
        value=5
    ),
    html.Table([
        html.Tr([html.Td(['x', html.Sup(2)]), html.Td(id='square')]),
        html.Tr([html.Td(['x', html.Sup(3)]), html.Td(id='cube')]),
        html.Tr([html.Td(['x', html.Sup('x')]), html.Td(id='x^x')]),
    ]),
])


@app.callback(
    [Output('square', 'children'),
     Output('cube', 'children'),
     Output('x^x', 'children')],
    [Input('num-multi', 'value')])
def callback_a(x):
    return x ** 2, x ** 3, x ** x


if __name__ == '__main__':
    app.run_server(debug=True)
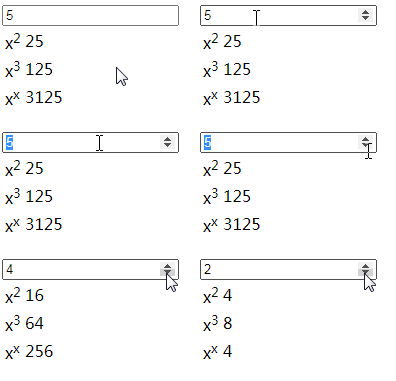
链式回调
一个回调函数的输出是另一个回调函数的输入
from dash import Dash, html, dcc, Input, Output

app = Dash()

all_options = {
    '中国': ['北京', '上海', '广州'],
    '美国': ['纽约', '旧金山']
}
app.layout = html.Div([
    dcc.RadioItems(
        id='countries-radio',
        options=[{'label': k, 'value': k} for k in all_options.keys()],
        value='中国'
    ),

    html.Hr(),

    dcc.RadioItems(id='cities-radio'),

    html.Hr(),

    html.Div(id='display-selected-values')
])


@app.callback(
    Output('cities-radio', 'options'),
    [Input('countries-radio', 'value')])
def set_cities_options(selected_country):
    return [{'label': i, 'value': i} for i in all_options[selected_country]]


@app.callback(
    Output('cities-radio', 'value'),
    [Input('cities-radio', 'options')])
def set_cities_value(available_options):
    return available_options[0]['value']


@app.callback(
    Output('display-selected-values', 'children'),
    [Input('countries-radio', 'value'),
     Input('cities-radio', 'value')])
def set_display_children(selected_country, selected_city):
    return '{} 是 {} 的城市'.format(selected_city, selected_country)


if __name__ == '__main__':
    app.run_server(debug=True)

状态
当用户输入完成后才回调
修饰器 app.callback 定义的 Input 改为 State
from dash import Dash, html, dcc, Input, Output, State

app = Dash()

app.layout = html.Div([
    dcc.Input(id='input-1-state', type='text', value='初始值1'),
    dcc.Input(id='input-2-state', type='text', value='初始值2'),
    html.Button(id='submit-button-state', n_clicks=0, children='Submit'),
    html.Div(id='output-state')
])


@app.callback(Output('output-state', 'children'),
              [Input('submit-button-state', 'n_clicks')],
              [State('input-1-state', 'value'),
               State('input-2-state', 'value')])
def update_output(n_clicks, input1, input2):
    return '点击了 {} 次:{}, {}'.format(n_clicks, input1, input2)


if __name__ == '__main__':
    app.run_server(debug=True)

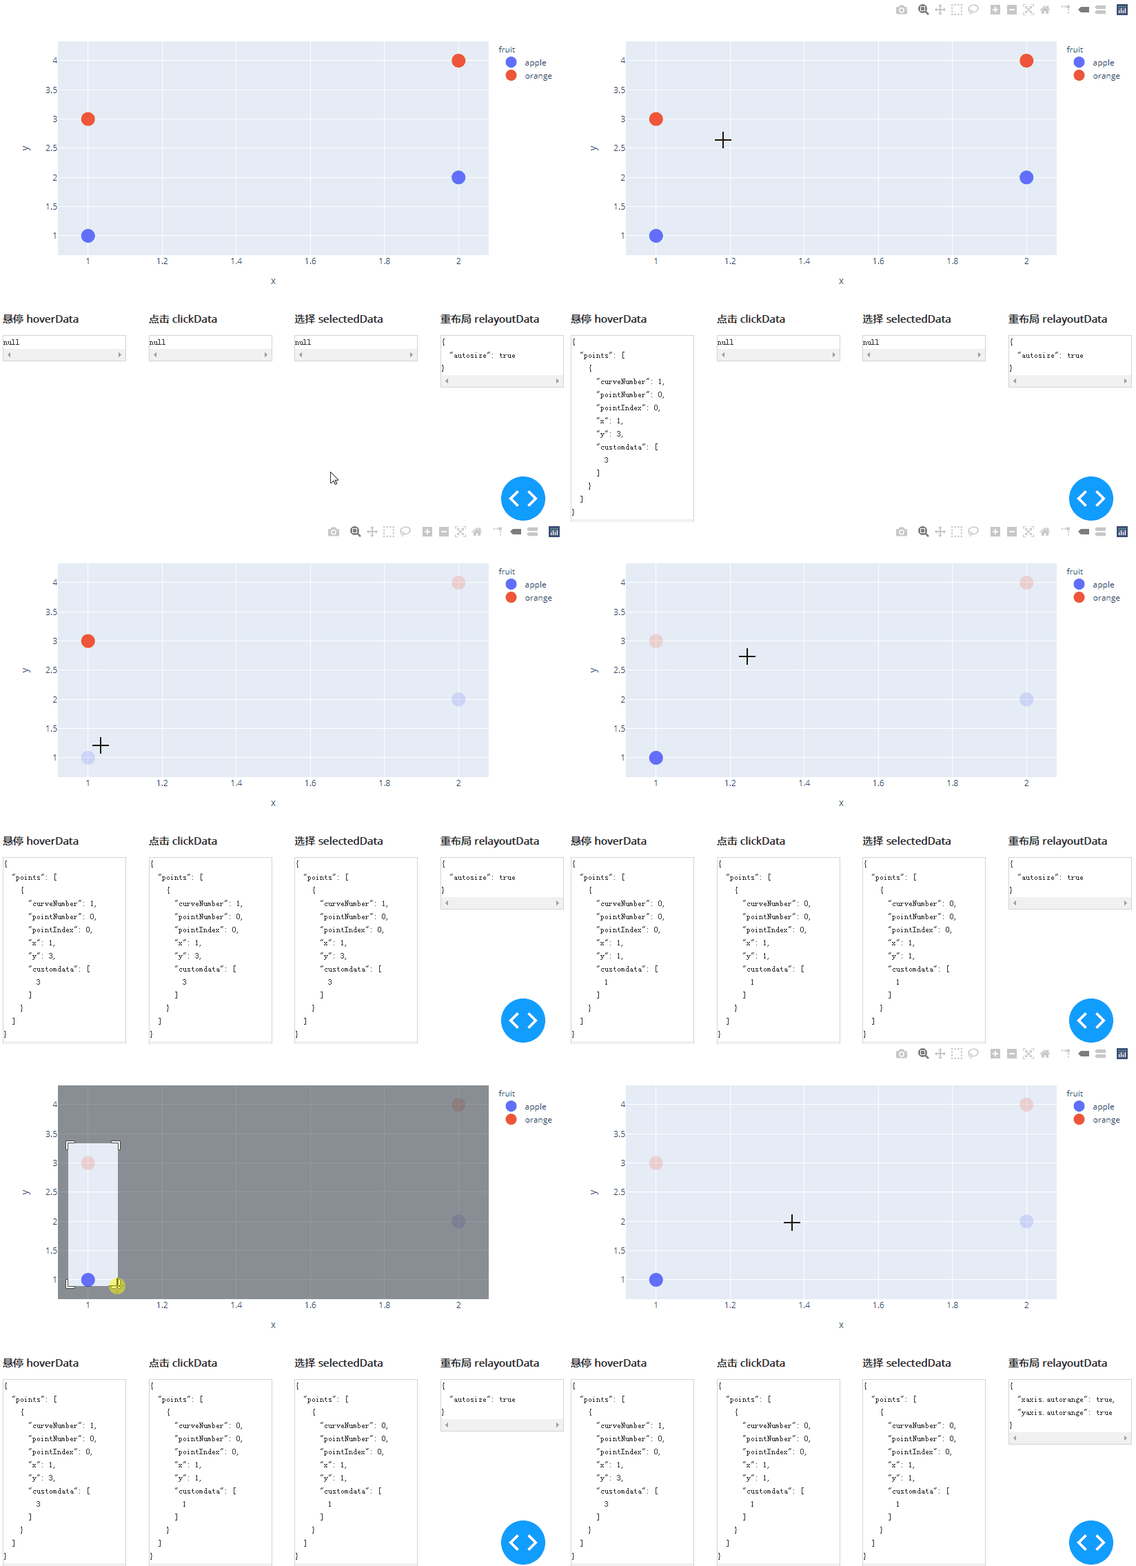
基本数据交互
修饰器 app.callback 定义的 Input 添加参数:
hoverData:悬停clickData:点击selectedData:选择relayoutData:重新布局
import json

import pandas as pd
import plotly.express as px
from dash import Dash, html, dcc, Input, Output

app = Dash()

styles = {
    'pre': {
        'border': 'thin lightgrey solid',
        'overflowX': 'scroll'
    }
}

df = pd.DataFrame({
    'x': [1, 2, 1, 2],
    'y': [1, 2, 3, 4],
    'customdata': [1, 2, 3, 4],
    'fruit': ['apple', 'apple', 'orange', 'orange']
})

fig = px.scatter(df, x='x', y='y', color='fruit', custom_data=['customdata'])

fig.update_layout(clickmode='event+select')

fig.update_traces(marker_size=20)

app.layout = html.Div([
    dcc.Graph(
        id='basic-interactions',
        figure=fig
    ),

    html.Div(className='row', children=[
        html.Div([
            dcc.Markdown('**悬停 hoverData**'),
            html.Pre(id='hover-data', style=styles['pre'])
        ], className='three columns'),

        html.Div([
            dcc.Markdown('**点击 clickData**'),
            html.Pre(id='click-data', style=styles['pre']),
        ], className='three columns'),

        html.Div([
            dcc.Markdown('**选择 selectedData**'),
            html.Pre(id='selected-data', style=styles['pre']),
        ], className='three columns'),

        html.Div([
            dcc.Markdown('**重布局 relayoutData**'),
            html.Pre(id='relayout-data', style=styles['pre']),
        ], className='three columns')
    ])
])


@app.callback(
    Output('hover-data', 'children'),
    [Input('basic-interactions', 'hoverData')])
def display_hover_data(hoverData):
    return json.dumps(hoverData, indent=2)


@app.callback(
    Output('click-data', 'children'),
    [Input('basic-interactions', 'clickData')])
def display_click_data(clickData):
    return json.dumps(clickData, indent=2)


@app.callback(
    Output('selected-data', 'children'),
    [Input('basic-interactions', 'selectedData')])
def display_selected_data(selectedData):
    return json.dumps(selectedData, indent=2)


@app.callback(
    Output('relayout-data', 'children'),
    [Input('basic-interactions', 'relayoutData')])
def display_relayout_data(relayoutData):
    return json.dumps(relayoutData, indent=2)


if __name__ == '__main__':
    app.run_server(debug=True)
悬停时更新图形
import pandas as pd
import plotly.express as px
from dash import Dash, html, dcc, Input, Output

app = Dash()

df = pd.read_csv('国家及其指标.csv')

available_indicators = df['Indicator Name'].unique()

app.layout = html.Div([
    html.Div([
        html.Div([
            dcc.Dropdown(
                id='crossfilter-xaxis-column',
                options=[{'label': i, 'value': i} for i in available_indicators],
                value='Fertility rate, total (births per woman)'
            ),
            dcc.RadioItems(
                id='crossfilter-xaxis-type',
                options=[{'label': i, 'value': i} for i in ['Linear', 'Log']],
                value='Linear',
                labelStyle={'display': 'inline-block'}
            )
        ], style={'width': '49%', 'display': 'inline-block'}),

        html.Div([
            dcc.Dropdown(
                id='crossfilter-yaxis-column',
                options=[{'label': i, 'value': i} for i in available_indicators],
                value='Life expectancy at birth, total (years)'
            ),
            dcc.RadioItems(
                id='crossfilter-yaxis-type',
                options=[{'label': i, 'value': i} for i in ['Linear', 'Log']],
                value='Linear',
                labelStyle={'display': 'inline-block'}
            )
        ], style={'width': '49%', 'float': 'right', 'display': 'inline-block'})
    ], style={
        'borderBottom': 'thin lightgrey solid',
        'backgroundColor': 'rgb(250, 250, 250)',
        'padding': '10px 5px'
    }),

    html.Div([
        dcc.Graph(
            id='crossfilter-indicator-scatter',
            hoverData={'points': [{'customdata': 'Japan'}]}
        )
    ], style={'width': '49%', 'display': 'inline-block', 'padding': '0 20'}),

    html.Div([
        dcc.Graph(id='x-time-series'),
        dcc.Graph(id='y-time-series'),
    ], style={'display': 'inline-block', 'width': '49%'}),

    html.Div([
        dcc.Slider(
            id='crossfilter-year--slider',
            min=df['Year'].min(),
            max=df['Year'].max(),
            value=df['Year'].max(),
            marks={str(year): str(year) for year in df['Year'].unique()},
            step=None
        )], style={'width': '49%', 'padding': '0px 20px 20px 20px'})
])


@app.callback(
    Output('crossfilter-indicator-scatter', 'figure'),
    [Input('crossfilter-xaxis-column', 'value'),
     Input('crossfilter-yaxis-column', 'value'),
     Input('crossfilter-xaxis-type', 'value'),
     Input('crossfilter-yaxis-type', 'value'),
     Input('crossfilter-year--slider', 'value')])
def update_graph(xaxis_column_name, yaxis_column_name, xaxis_type, yaxis_type, year_value):
    """一旦改变下拉框、单选按钮或年份则更新图表"""
    dff = df[df['Year'] == year_value]
    fig = px.scatter(
        x=dff[dff['Indicator Name'] == xaxis_column_name]['Value'],
        y=dff[dff['Indicator Name'] == yaxis_column_name]['Value'],
        hover_name=dff[dff['Indicator Name'] == yaxis_column_name]['Country Name']
    )
    fig.update_traces(customdata=dff[dff['Indicator Name'] == yaxis_column_name]['Country Name'])
    fig.update_xaxes(title=xaxis_column_name, type='linear' if xaxis_type == 'Linear' else 'log')
    fig.update_yaxes(title=yaxis_column_name, type='linear' if yaxis_type == 'Linear' else 'log')
    fig.update_layout(margin={'l': 40, 'b': 40, 't': 10, 'r': 0}, hovermode='closest')
    return fig


def create_time_series(dff, axis_type, title):
    """更新右边图表"""
    fig = px.scatter(dff, x='Year', y='Value')
    fig.update_traces(mode='lines+markers')
    fig.update_xaxes(showgrid=False)
    fig.update_yaxes(type='linear' if axis_type == 'Linear' else 'log')
    fig.add_annotation(
        x=0, y=0.85, xanchor='left', yanchor='bottom',
        xref='paper', yref='paper', showarrow=False, align='left',
        bgcolor='rgba(255, 255, 255, 0.5)', text=title
    )
    fig.update_layout(height=225, margin={'l': 20, 'b': 30, 'r': 10, 't': 10})
    return fig


@app.callback(
    Output('x-time-series', 'figure'),
    [Input('crossfilter-indicator-scatter', 'hoverData'),
     Input('crossfilter-xaxis-column', 'value'),
     Input('crossfilter-xaxis-type', 'value')])
def update_y_timeseries(hoverData, xaxis_column_name, axis_type):
    """更新右上角图表"""
    country_name = hoverData['points'][0]['customdata']
    dff = df[df['Country Name'] == country_name]
    dff = dff[dff['Indicator Name'] == xaxis_column_name]
    title = '<b>{}</b><br>{}'.format(country_name, xaxis_column_name)
    return create_time_series(dff, axis_type, title)


@app.callback(
    Output('y-time-series', 'figure'),
    [Input('crossfilter-indicator-scatter', 'hoverData'),
     Input('crossfilter-yaxis-column', 'value'),
     Input('crossfilter-yaxis-type', 'value')])
def update_x_timeseries(hoverData, yaxis_column_name, axis_type):
    """更右下角图表"""
    dff = df[df['Country Name'] == hoverData['points'][0]['customdata']]
    dff = dff[dff['Indicator Name'] == yaxis_column_name]
    return create_time_series(dff, axis_type, yaxis_column_name)


if __name__ == '__main__':
    app.run_server(debug=True)

我国出口商品的 GDP 比重和 GDP 的增速呈正比,说明了改革开放的重要性。
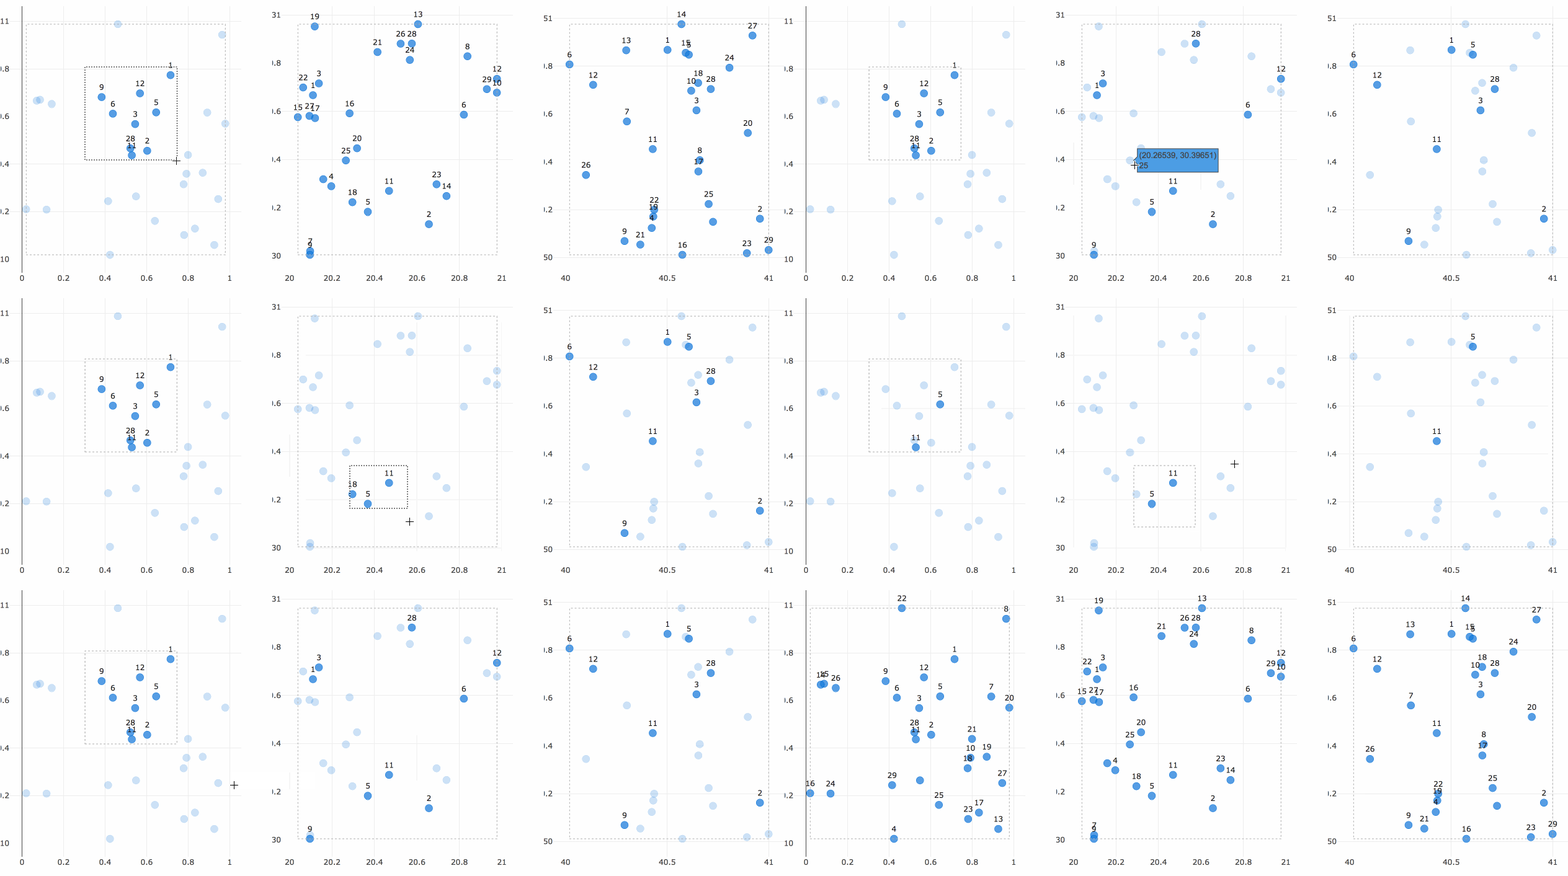
通用交叉过滤
对每个散点图的选择过滤底层数据
import numpy as np
import pandas as pd
import plotly.express as px
from dash import Dash, html, dcc, Input, Output

np.random.seed(0)
df = pd.DataFrame({'Col ' + str(i + 1): np.random.rand(30) for i in range(6)})  # 随机生成6组30以内的数(3组x,y轴数据)

app = Dash()

app.layout = html.Div([
    html.Div(
        dcc.Graph(id='g1', config={'displayModeBar': False}),
        className='four columns'
    ),
    html.Div(
        dcc.Graph(id='g2', config={'displayModeBar': False}),
        className='four columns'
    ),
    html.Div(
        dcc.Graph(id='g3', config={'displayModeBar': False}),
        className='four columns'
    )
], className='row')


def get_figure(df, x_col, y_col, selectedpoints, selectedpoints_local):
    if selectedpoints_local and selectedpoints_local['range']:
        ranges = selectedpoints_local['range']
        selection_bounds = {'x0': ranges['x'][0], 'x1': ranges['x'][1],
                            'y0': ranges['y'][0], 'y1': ranges['y'][1]}
    else:
        selection_bounds = {'x0': np.min(df[x_col]), 'x1': np.max(df[x_col]),
                            'y0': np.min(df[y_col]), 'y1': np.max(df[y_col])}

    fig = px.scatter(df, x=df[x_col], y=df[y_col], text=df.index)

    fig.update_traces(selectedpoints=selectedpoints,
                      customdata=df.index,
                      mode='markers+text', marker={'color': 'rgba(0, 116, 217, 0.7)', 'size': 20},
                      unselected={'marker': {'opacity': 0.3}, 'textfont': {'color': 'rgba(0, 0, 0, 0)'}})

    fig.update_layout(margin={'l': 20, 'r': 0, 'b': 15, 't': 5}, dragmode='select', hovermode=False)

    fig.add_shape(dict({'type': 'rect', 'line': {'width': 1, 'dash': 'dot', 'color': 'darkgrey'}}, **selection_bounds))

    return fig


@app.callback(
    [Output('g1', 'figure'),
     Output('g2', 'figure'),
     Output('g3', 'figure')],
    [Input('g1', 'selectedData'),
     Input('g2', 'selectedData'),
     Input('g3', 'selectedData')]
)
def callback(selection1, selection2, selection3):
    selectedpoints = df.index
    for selected_data in [selection1, selection2, selection3]:
        if selected_data and selected_data['points']:
            selectedpoints = np.intersect1d(
                selectedpoints,
                [p['customdata'] for p in selected_data['points']]
            )

    return [get_figure(df, 'Col 1', 'Col 2', selectedpoints, selection1),
            get_figure(df, 'Col 3', 'Col 4', selectedpoints, selection2),
            get_figure(df, 'Col 5', 'Col 6', selectedpoints, selection3)]


if __name__ == '__main__':
    app.run_server(debug=True)
点击或选择一个区域来过滤,选中的点会高亮
回调函数共享数据
为什么需要共享状态?
某些回调做数据处理,如SQL查询或下载数据,代价很大。与其让多个回调运行相同的任务,不如将结果共享给其余的回调。
可选方案:
- 多个output:对数据作一次小处理再查数据库代价仍太大
- global:数据会影响到用户之间
为了跨多个Python进程安全地共享数据,需要将数据存储在每个进程都可以访问的地方。主要方案有:
- 用户的浏览器会话
- 磁盘,如文件或新数据库
- 共享内存空间,如Redis
具体方案查看回调函数共享数据
Jupyter Notebook
如果你更喜欢用的 IDE 是 Jupyter notebook 或 JupyterLab,可以安装
pip install jupyter-dash
快速开发在线数据库更新修改工具
页面标题
from dash import Dash, html

app = Dash()
app.title = '标题'

app.layout = html.Div(children=[html.H1(children='Hello Dash')])

if __name__ == '__main__':
    app.run_server(debug=True)
文件上传
import io
import base64

import dash
import pandas as pd
from dash import dcc, html, dash_table, Input, Output, State

external_stylesheets = ['https://codepen.io/chriddyp/pen/bWLwgP.css']
app = dash.Dash(__name__, external_stylesheets=external_stylesheets)

app.layout = html.Div([
    # 上传组件
    dcc.Upload(
        id='upload',
        children=html.Div([html.A('点击上传或将文件拖入此区域')]),
        style={'width': '100%', 'height': '60px', 'lineHeight': '60px', 'borderWidth': '1px',
               'borderStyle': 'dashed', 'borderRadius': '5px', 'textAlign': 'center', 'margin': '10px'},
        # multiple=True  # 允许多文件上传
    ),

    # 数据表
    html.Div([
        dash_table.DataTable(id='datatable', editable=True,
                             style_cell={'fontSize': 20, 'font-family': 'sans-serif'})
    ], style={'width': '20%'}),
])


@app.callback(
    Output('datatable', 'data'),
    Output('datatable', 'columns'),
    Input('upload', 'contents'),
    State('upload', 'filename'),
    prevent_initial_call=True
)
def update_datatable(contents, filename):
    """上传文件后更新表格"""
    print(1)
    if not contents:
        return [{}], []
    df = None
    content_type, content_string = contents.split(',')
    decoded = base64.b64decode(content_string)
    if 'csv' in filename:
        df = pd.read_csv(io.StringIO(decoded.decode('utf-8')))
    elif 'xls' in filename:
        df = pd.read_excel(io.BytesIO(decoded))
    return df.to_dict('records'), [{'name': i, 'id': i} for i in df.columns]


if __name__ == '__main__':
    app.run_server(debug=False)
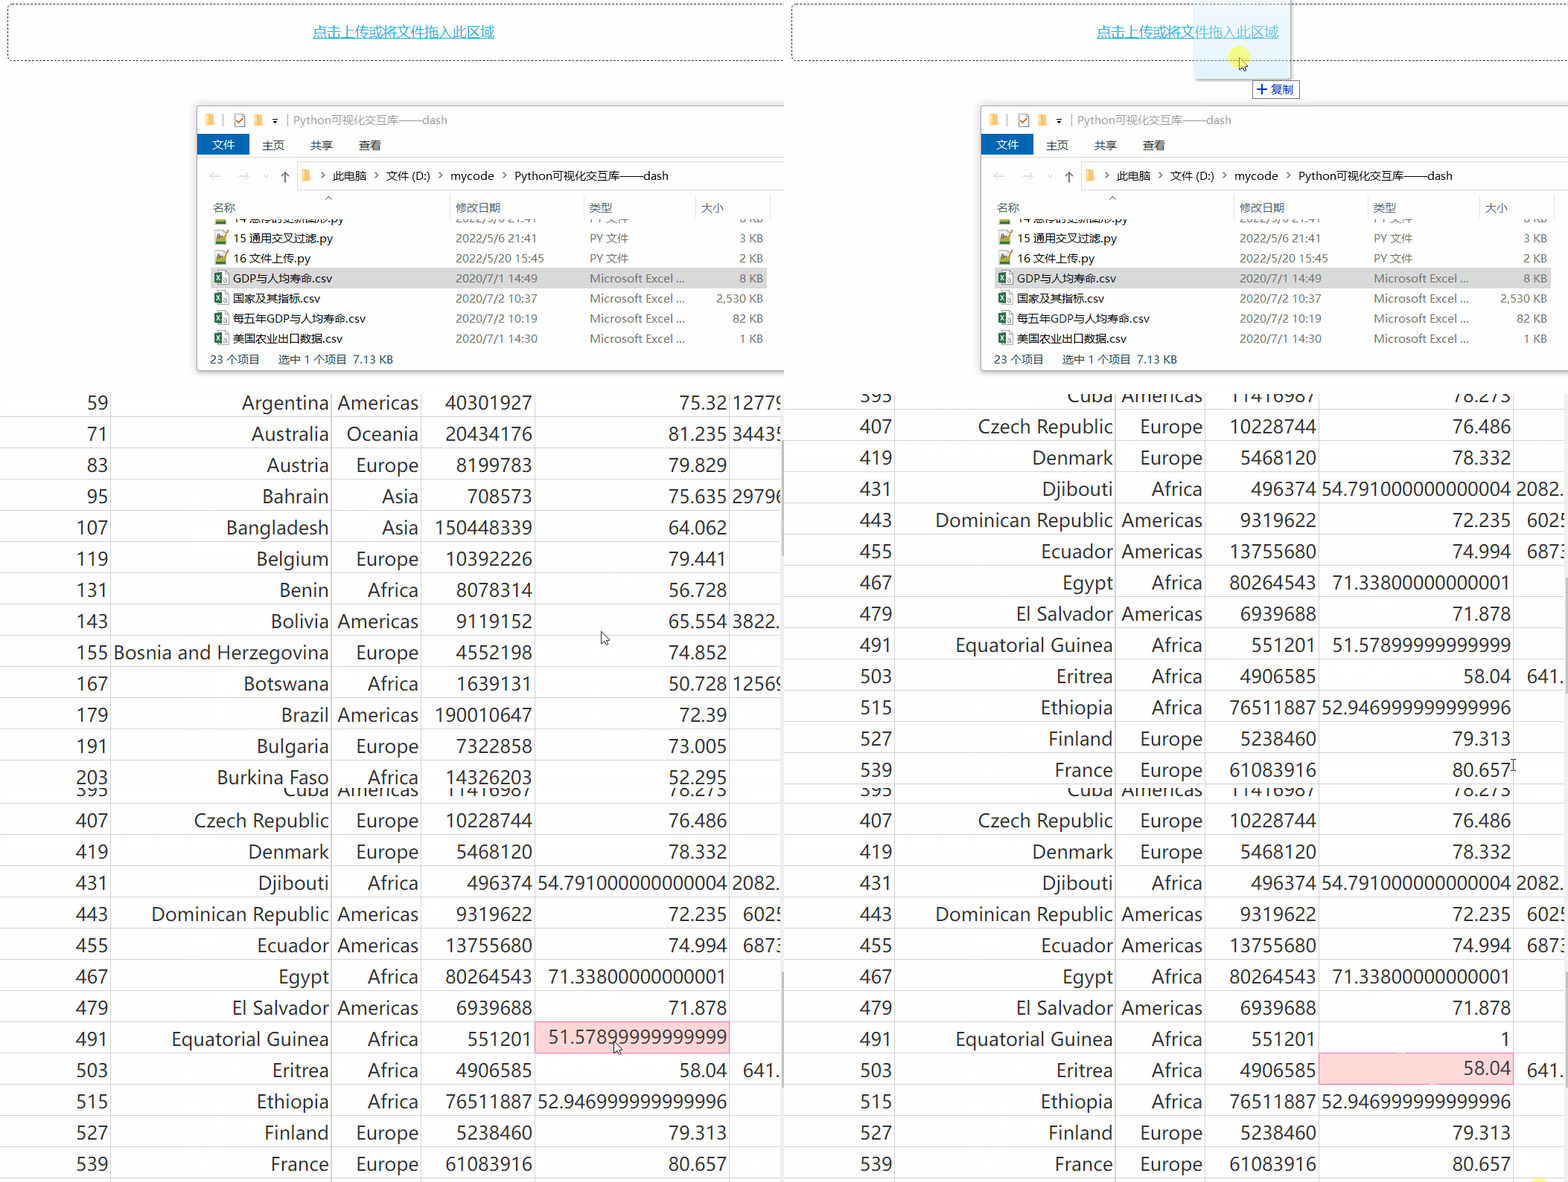
自带的 dcc.Upload() 可以实现简单的文件上传功能,但缺点有:
- 文件大小有限制,150 到 200 MB 左右出现瓶颈
- 上传策略是先将用户上传的文件存放在浏览器内存,再通过 base64 形式传到服务端解码,非常低效
- 上传过程无进度条
可使用第三方扩展解决——dash-uploader
安装
pip install dash-uploader
代码
from pathlib import Path

import dash
import pandas as pd
from dash import html, dash_table, Input, Output, State
import dash_uploader as du

external_stylesheets = ['https://codepen.io/chriddyp/pen/bWLwgP.css']
app = dash.Dash(__name__, external_stylesheets=external_stylesheets)

folder = Path(__file__).parent / 'tmp'  # 存放上传文件的目录
du.configure_upload(app, str(folder))

app.layout = html.Div([
    # 上传组件
    du.Upload(
        id='upload',
        text='点击上传或将文件拖入此区域',
        text_completed='成功上传 ',
        filetypes=['xls', 'csv'],
        default_style={'width': None, 'lineHeight': '60px', 'borderWidth': '1px',
                       'borderStyle': 'dashed', 'borderRadius': '5px', 'textAlign': 'center', 'margin': '10px'}
    ),
    html.Br(),

    # 数据表
    html.Div([
        dash_table.DataTable(id='datatable', editable=True,
                             style_cell={'fontSize': 20, 'font-family': 'sans-serif'})
    ], style={'width': '20%'}),
])


@app.callback(
    Output('datatable', 'data'),
    Output('datatable', 'columns'),
    Input('upload', 'isCompleted'),
    State('upload', 'fileNames'),
    State('upload', 'upload_id')
)
def update_datatable(is_completed, filenames, upload_id):
    if not is_completed:
        return [{}], []
    df = None
    filename = filenames[0]
    filepath = folder / upload_id / filename
    if 'csv' in filename:
        df = pd.read_csv(filepath)
    elif 'xls' in filename:
        df = pd.read_excel(filepath)
    return df.to_dict('records'), [{'name': i, 'id': i} for i in df.columns]


if __name__ == '__main__':
    app.run_server(debug=False)
文件下载
from pathlib import Path

import dash_uploader as du
from dash import Dash, dcc, html, Input, Output, State

external_stylesheets = ['https://codepen.io/chriddyp/pen/bWLwgP.css']
app = Dash(__name__, external_stylesheets=external_stylesheets)

folder = Path(__file__).parent / 'tmp'  # 存放上传文件的目录
du.configure_upload(app, str(folder))

app.layout = html.Div([
    du.Upload(
        id='upload',
        text='点击上传或将文件拖入此区域',
        text_completed='成功上传 ',
    ),
    html.Br(),
    html.Button(id='click', children='下载'),
    dcc.Download(id='download')
])


@app.callback(
    Output('click', 'children'),
    Input('upload', 'isCompleted'),
    State('upload', 'fileNames'),
    prevent_initial_call=True
)
def upload(is_completed, filenames):
    if is_completed:
        filename = filenames[0]
        return f'下载 {filename}'
    else:
        return '下载'


@app.callback(
    Output('download', 'data'),
    Input('click', 'n_clicks'),
    State('upload', 'fileNames'),
    State('upload', 'upload_id'),
    prevent_initial_call=True,
)
def download(n_clicks, filenames, upload_id):
    filename = filenames[0]
    filepath = folder / upload_id / filename
    return dcc.send_file(filepath)


if __name__ == '__main__':
    app.run_server(debug=False)

回调函数不要 Output
用一个隐藏的 div 替代
from dash import Dash, dcc, html, Input, Output

app = Dash()
app.layout = html.Div([
    # 下拉框
    html.Div(id='hidden-div', style={'display': 'none'}),
    dcc.Dropdown(
        id='dropdown',
        options=[
            {'label': '北京', 'value': 'BJ'},
            {'label': '上海', 'value': 'SH'},
            {'label': '广州', 'value': 'GZ'}
        ],
        value='GZ'
    ),
])


@app.callback(
    Output('hidden-div', 'children'),
    Input('dropdown', 'value'),
)
def update_output(value):
    print(value)


if __name__ == '__main__':
    app.run_server(debug=False)
加载组件
安装
pip install dash-uploader
代码
import time

from dash_loading_spinners import Hash
from dash import Dash, html, Input, Output

external_stylesheets = ['https://codepen.io/chriddyp/pen/bWLwgP.css']
app = Dash(__name__, external_stylesheets=external_stylesheets)

app.layout = html.Div([
    html.Button(id='save', children='运算', n_clicks=0),
    html.Br(),
    html.Br(),
    Hash(html.Label(id='spinner'), speed_multiplier=2),
])


@app.callback(
    Output('spinner', 'children'),
    Input('save', 'n_clicks'),
    prevent_initial_call=True
)
def save_to_word(n_clicks):
    time.sleep(2)
    return f'点了{n_clicks}次'


if __name__ == '__main__':
    app.run_server(debug=False)

更多实例
Button选中效果

url直达筛选
踩过的坑
1. 报错:ValueError: All arguments should have the same length. The length of argument y is 2, whereas the length of previous arguments ['x'] is 3
pip install plotly -U
2. 回调函数不运行
同样 Output 不能被多次触发,建议写在同一个回调中处理
from dash import Dash, html, dcc, Input, Output

app = Dash()

app.layout = html.Div([
    dcc.Input(id='input', type='text'),
    html.Br(),
    html.Label(id='output', children='同样Output不能被多次触发'),
])


@app.callback(
    Output('output', 'children'),
    Input('input', 'value')
)
def update1(value):
    return value + '1'


@app.callback(
    Output('output', 'children'),
    Input('input', 'value')
)
def update2(value):
    return value + '2'


if __name__ == '__main__':
    app.run_server(debug=False)
参考文献
- Dash Documentation
- Dash GitHub
- Dash API
- plotly.py
- plotly.py GitHub
- dash-daq GitHub
- dash-extensions GitHub
- mermaid-js GitHub
- Flowchart / sequence diagram support
- DataTable - how to update style (specifically font family and size)
- Register plotly dash callbacks after app.run_server() without having to reload webpage
- Python+Dash快速web应用开发——上传下载篇
- dash-uploader GitHub
- App callback without an output
- dash回调函数同一个组件只能绑定一个Output
- Python+Dash快速web应用开发——静态部件篇(下)
- dash-loading-spinners GitHub
更多推荐
 已为社区贡献3条内容





所有评论(0)