python matplotlib.Rectangle在一幅图片里作出一个或多个矩形框
import matplotlib.pyplot as pltimport matplotlib.patches as patches# 根据坐标作图def plot_pic():img_path = "000000000650.jpg"txt_path = "000000000650.txt"img = plt.imread(img_path)h,w,c = img.shapetxt_lines
·
import matplotlib.pyplot as plt
import matplotlib.patches as patches

# 根据坐标作图
def plot_pic():
    img_path = "000000000650.jpg"
    txt_path = "000000000650.txt"

    img = plt.imread(img_path)
    h,w,c = img.shape
    txt_lines = open(txt_path).readlines()

    coords = []
    for line in txt_lines:
        new_line = line.strip().split(" ")[1:]
        # [x_center,y_center,width,hieght]坐标转换成[left,top,width,height]
        width = float(new_line[2]) * w
        height = float(new_line[3]) * h
        left = float(new_line[0]) * w - width / 2
        bottom = float(new_line[1]) * h + height / 2

        coords.append([left,bottom ,width,height])


    fig, ax = plt.subplots(1, 1)
    ax.imshow(img)
    currentAxis = fig.gca()

    #
    for index, coord in enumerate(coords):
        rect = patches.Rectangle((coord[0], coord[1]), coord[2], coord[3],
        						linewidth=1, edgecolor='r',facecolor='none')
        currentAxis.add_patch(rect)

        plt.show()
    print(0)
if __name__ == "__main__":
    plot_pic()
其中
000000000650.jpg图片如下:
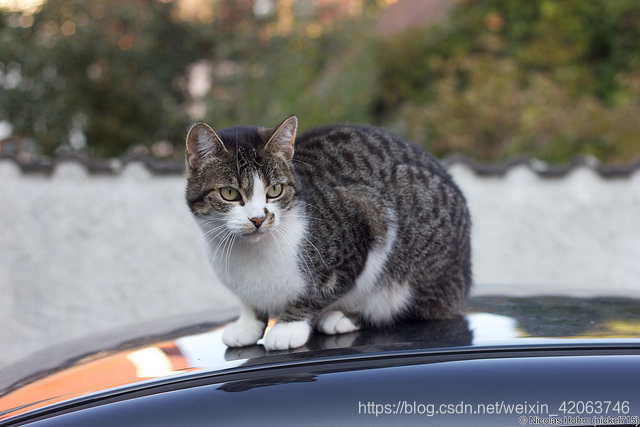
000000000650.txt内容如下:
15 0.519398 0.544087 0.476359 0.572061
2 0.501859 0.820726 0.996281 0.332178
#[class x_center y_center width height] 复制请删除这一行
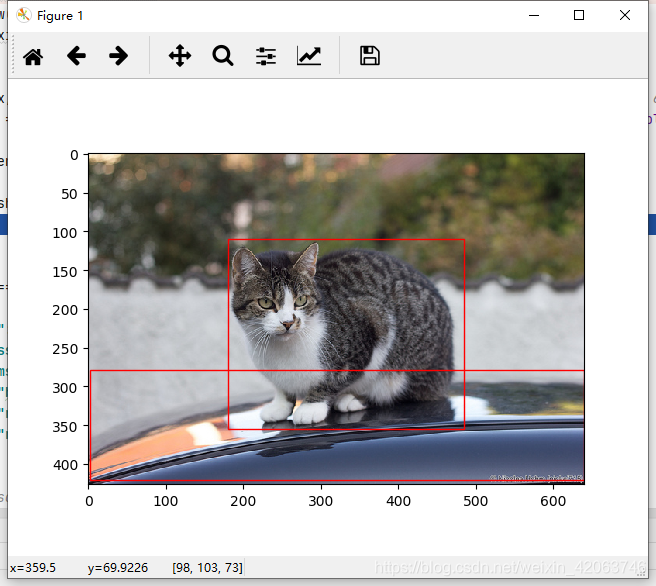
通过运行上面的程序,得到如下结果:
rectangle函数的参数解释如下:
Rectangle(xy,width,heigth,angle=0,**kwargs)
参数
xy:2元组,矩形左下角坐标
width:矩形的宽度
height:矩形的高度
angle:float,可选,矩形相对于x轴逆时针旋转角度,默认0
fill:bool,可选,是否填充矩形

为开发者提供学习成长、分享交流、生态实践、资源工具等服务,帮助开发者快速成长。
更多推荐


 3
3 0
0- 0


 已为社区贡献1条内容

所有评论(0)