利用mglearn绘图报错:TypeError: ‘(slice(None, None, None), 0)‘ is an invalid key
想利用mglearn可视化有俩个特征的数据时,出现了如上的报错。data = pd.read_csv('ex2data1.txt', names=['score1', 'score2', 'Admission'])m, n = data.shapex = data[['score1', 'score2']]y = data[['Admission']]mglearn.discrete_scatte
·
想利用mglearn可视化有俩个特征的数据时,出现了文章标题所示的错误。
data = pd.read_csv('ex2data1.txt', names=['score1', 'score2', 'Admission'])
m, n = data.shape
x = data[['score1', 'score2']]
y = data[['Admission']]

mglearn.discrete_scatter(x[:, 0], x[:, 1], y)
plt.show()
这是因为没有将数据转化为数组的格式,所以首先将数据转化为数组的格式。使用np.array
data = pd.read_csv('ex2data1.txt', names=['score1', 'score2', 'Admission'])
m, n = data.shape
x = data[['score1', 'score2']]
y = data['Admission']
x = np.array(x.values)
y = np.array(y.values)
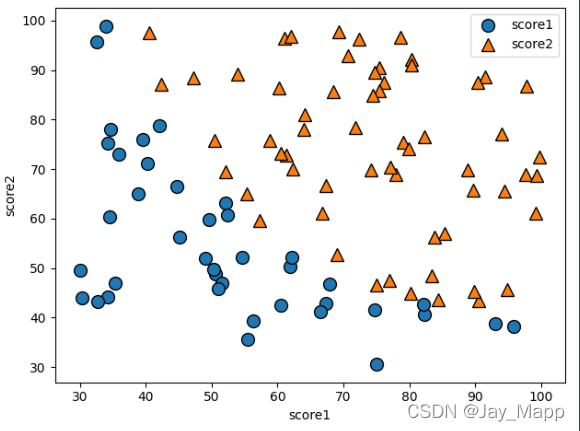
mglearn.discrete_scatter(x[:, 0], x[:, 1], y)
plt.legend(['score1', 'score2'])
plt.show()
这样,问题解决,数据可视化更加方便了。

华为开发者空间,是为全球开发者打造的专属开发空间,汇聚了华为优质开发资源及工具,致力于让每一位开发者拥有一台云主机,基于华为根生态开发、创新。
更多推荐


 5
5 0
0- 0


 已为社区贡献2条内容

所有评论(0)