Python学习笔记---pivot_table()数据透视表
系列文章目录提示:这里可以添加系列文章的所有文章的目录,目录需要自己手动添加例如:第一章 Python 机器学习入门之pandas的使用提示:写完文章后,目录可以自动生成,如何生成可参考右边的帮助文档文章目录系列文章目录前言一、pandas是什么?二、使用步骤1.引入库2.读入数据总结前言提示:这里可以添加本文要记录的大概内容:例如:随着人工智能的不断发展,机器学习这门技术也越来越重要,很多人都开
Python学习笔记—pivot_table()数据透视表
前言
excel有很强大的数据透视表功能,不仅可以做全局统计分析,还可以做联动效果的分析图表。同样python也有数据透视表功能,就是pivot_table。
一、pivot_table数据透视表
用好pivot_table,比excel能更多更快的处理数据。
pivot_table参数列表:
pandas.pivot_table(data, values=None, index=None, columns=None, aggfunc=‘mean’, fill_value=None, margins=False, dropna=True, margins_name=‘All’, observed=False, sort=True)
同样可以写成:
data.pivot_table(’ data列名’,index,columns,aggfunc…)
常用参数释义:
data:要进行数据透视的数据
values:要做计算的数据 ,对谁求和/求均值/计算个数等
index:确定行参数,可以是多个。单个’‘,多个[’‘,’‘]表示
columns:确定列参数,可以是多个。单个’‘,多个[’‘,’']
aggfunc:要计算的函数,mean求均值、sum求和、size计算个数
dropna:表示是否计算全为NaN的数据。bool类型,默认True 不计算
sort:对values结果进行排序。bool类型 默认False 升序
二、操作步骤
用pivot_table对数据进行sum、mean及计算个数统计。
all_data数据展示如下:
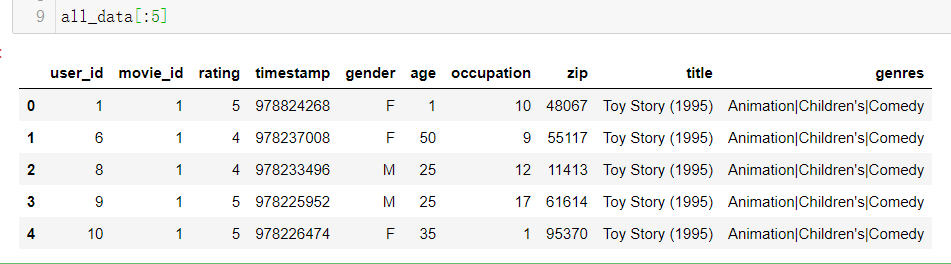
all_data:
user_id movie_id rating timestamp gender age occupation zip title genres
0 1 1 5 978824268 F 1 10 48067 Toy Story (1995) Animation|Children’s|Comedy
1 6 1 4 978237008 F 50 9 55117 Toy Story (1995) Animation|Children’s|Comedy
2 8 1 4 978233496 M 25 12 11413 Toy Story (1995) Animation|Children’s|Comedy
3 9 1 5 978225952 M 25 17 61614 Toy Story (1995) Animation|Children’s|Comedy
4 10 1 5 978226474 F 35 1 95370 Toy Story (1995) Animation|Children’s|Comedy
1.具体代码及结果
代码如下:
import pandas as pd
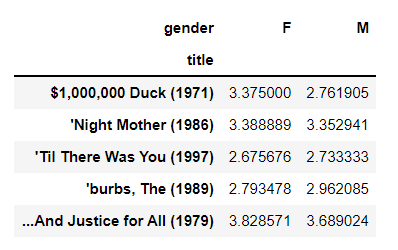
#按性别分级的每部电影的平均评分 pivot_table 数据透视表。 对每部电影的rating 按性别进行平均值操作
mean_ratings = all_data.pivot_table('rating',index = 'title',columns = 'gender' ,aggfunc ='mean' )
#并显示前5行结果
mean_ratings[:5]
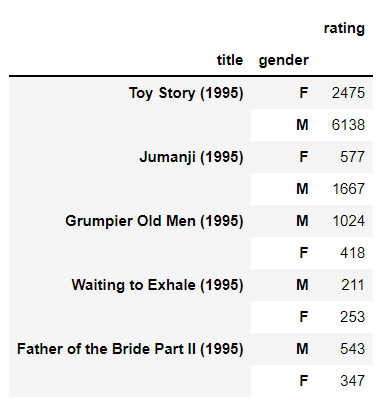
#对每部电影的总评分按性别进行分组统计:
movie_xingbie = pd.pivot_table(all_data,index=['title','gender'],values='rating',aggfunc = 'sum',sort =False)
并显示前10行结果:
movie_xingbie[:10]
2.其他操作
代码如下:
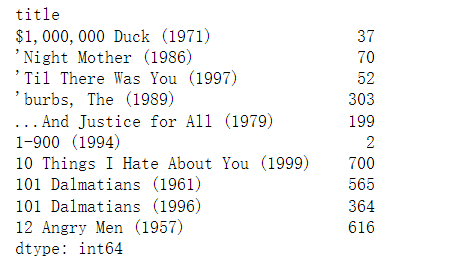
#按电影名进行分组查看评分
ratings_by_title = all_data.groupby('title').size()
ratings_by_title[:10]
总结
新手学习pivot_table中,希望我的笔记可以帮助你更好的理解。
【每天积累一点点,python的路上就少迷惑一点,更高效一些】

华为开发者空间,是为全球开发者打造的专属开发空间,汇聚了华为优质开发资源及工具,致力于让每一位开发者拥有一台云主机,基于华为根生态开发、创新。
更多推荐


 8
8 0
0- 0


 已为社区贡献2条内容
 免费领云主机


 华为云 x DeepSeek:AI驱动云上应用创新

 DTT年度收官盛典:华为开发者空间大咖汇,共探云端开发创新
 华为云数字人,助力行业数字化业务创新
 企业数据治理一站式解决方案及应用实践
 轻松构建AIoT智能场景应用


所有评论(0)