【pandas】星巴克门店数据集分析
文章目录一、数据集二、实现导包1.查看星巴克旗下有多少品牌2.查看全世界一共有多少个国家和地区开设了星巴克门店,显示门店数量排名前10和后10的国家和地区。# 3.用柱状图绘制排名前10的分布情况4.显示拥有星巴克门店数量前10的城市5.按照星巴克门店在中国的分布,统计排名前10的城市绘制柱状图导包一、数据集数据集:资料,提取码:zmlc二、实现导包# -*- coding: utf-8 -*im
·
文章目录
一、数据集
数据集:资料,提取码:pqgp
二、实现
导包
# -*- coding: utf-8 -*
import pandas as pd
import numpy as np
import matplotlib.pyplot as plt
import matplotlib


# 导入小费数据集
df = pd.read_csv('directory.csv')
# 设置中文字体
matplotlib.rcParams['font.sans-serif'] = ['SimHei']
matplotlib.rcParams['font.family'] = 'sans-serif'
1.查看星巴克旗下有多少品牌
# 1.查看星巴克旗下有多少品牌
all_brand_len = len(df['Brand'].unique())
print(all_brand_len)

# 查看全世界有多少星巴克门店
all_store_len = len(df['Store Number'].unique())
print(all_store_len)
2.查看全世界一共有多少个国家和地区开设了星巴克门店,显示门店数量排名前10和后10的国家和地区。
# 2.查看全世界一共有多少个国家和地区开设了星巴克门店,显示门店数量排名前10和后10的国家和地区。

all_country_len = len(df['Country'].unique())
all_country = df.groupby(by="Country").count(
)["Store Number"].sort_values(ascending=False)
# 前10
top_country = all_country[:10]
# 后10
end_country = all_country[-10:]
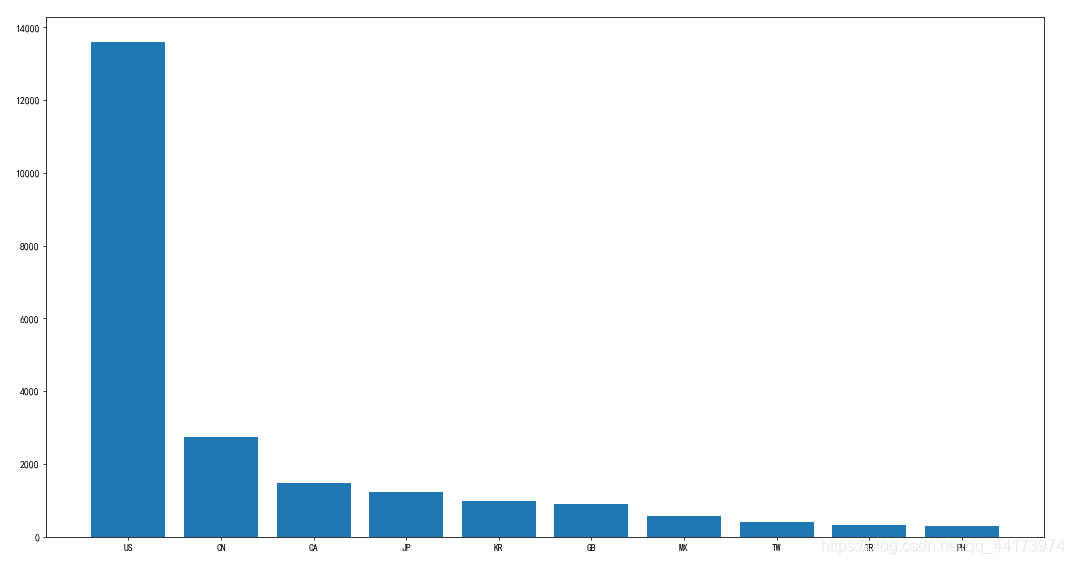
3.用柱状图绘制排名前10的分布情况
# 3.用柱状图绘制排名前10的分布情况
top_country_x = top_country.index
top_country_y = top_country.data

plt.figure(figsize=(20, 8), dpi=70)
plt.bar(range(len(top_country_x)), top_country_y)
plt.xticks(range(len(top_country_x)), top_country_x)
plt.show()
4.显示拥有星巴克门店数量前10的城市
# 4.显示拥有星巴克门店数量前10的城市
top_city = df.groupby(by="City")["Brand"].count(
).sort_values(ascending=False)[:10]
5.绘制星巴克门店数前10的城市分布柱状图
# 5.绘制星巴克门店数前10的城市分布柱状图
top_city_x = top_city.index
top_city_y = top_city.data

plt.bar(range(len(top_city_x)), top_city_y)
plt.xticks(range(len(top_city_x)), top_city_x)
plt.show()

6.按照星巴克门店在中国的分布,统计排名前10的城市绘制柱状图
# 6.按照星巴克门店在中国的分布,统计排名前10的城市绘制柱状图
china_data = df[df['Country'] == 'CN']
class_data = china_data.groupby(
    by="City")["Brand"].count().sort_values(ascending=False)[0:20]
class_data_x = class_data.index
class_data_y = class_data.values
# 画图
plt.barh(range(len(class_data_x)), class_data_y, height=0.3)
plt.yticks(range(len(class_data_x)), class_data_x)
plt.show()

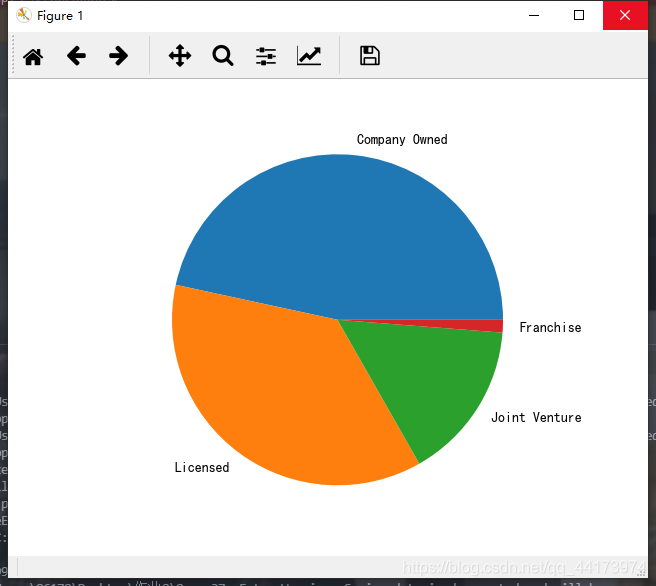
7.用饼状图显示星巴克门店的经营方式
# 7.用饼状图显示星巴克门店的经营方式
operation = df.groupby(by='Ownership Type')[
    "Brand"].count().sort_values(ascending=False)
operation_x = operation.index
operation_y = operation.values
plt.pie(x=operation_y, labels=operation_x)
plt.axis('equal')
plt.show()
三、完整代码
# -*- coding: utf-8 -*
import pandas as pd
import numpy as np
import matplotlib.pyplot as plt
import matplotlib


# 导入小费数据集
df = pd.read_csv('directory.csv')
# 设置中文字体
matplotlib.rcParams['font.sans-serif'] = ['SimHei']
matplotlib.rcParams['font.family'] = 'sans-serif'


# 1.查看星巴克旗下有多少品牌
all_brand_len = len(df['Brand'].unique())
print(all_brand_len)

# 查看全世界有多少星巴克门店
all_store_len = len(df['Store Number'].unique())
print(all_store_len)


# 2.查看全世界一共有多少个国家和地区开设了星巴克门店,显示门店数量排名前10和后10的国家和地区。

all_country_len = len(df['Country'].unique())
all_country = df.groupby(by="Country").count(
)["Store Number"].sort_values(ascending=False)
# 前10
top_country = all_country[:10]
# 后10
end_country = all_country[-10:]


# 3.用柱状图绘制排名前10的分布情况
top_country_x = top_country.index
top_country_y = top_country.data

plt.figure(figsize=(20, 8), dpi=70)
plt.bar(range(len(top_country_x)), top_country_y)
plt.xticks(range(len(top_country_x)), top_country_x)
plt.show()


# 4.显示拥有星巴克门店数量前10的城市
top_city = df.groupby(by="City")["Brand"].count(
).sort_values(ascending=False)[:10]
# 5.绘制星巴克门店数前10的城市分布柱状图
top_city_x = top_city.index
top_city_y = top_city.data

plt.bar(range(len(top_city_x)), top_city_y)
plt.xticks(range(len(top_city_x)), top_city_x)
plt.show()

# 6.按照星巴克门店在中国的分布,统计排名前10的城市绘制柱状图
china_data = df[df['Country'] == 'CN']
class_data = china_data.groupby(
    by="City")["Brand"].count().sort_values(ascending=False)[0:20]
class_data_x = class_data.index
class_data_y = class_data.values
# 画图
plt.barh(range(len(class_data_x)), class_data_y, height=0.3)
plt.yticks(range(len(class_data_x)), class_data_x)
plt.show()

# 7.用饼状图显示星巴克门店的经营方式
operation = df.groupby(by='Ownership Type')[
    "Brand"].count().sort_values(ascending=False)
operation_x = operation.index
operation_y = operation.values
plt.pie(x=operation_y, labels=operation_x)
plt.axis('equal')
plt.show()

为开发者提供学习成长、分享交流、生态实践、资源工具等服务,帮助开发者快速成长。
更多推荐


 18
18 0
0- 0


 已为社区贡献6条内容

所有评论(0)