Python出租车GPS数据的路网匹配(TransBigData+leuvenmapmatching)
本例尝试使用TransBigData+leuvenmapmatching实现出租车GPS数据的路网匹配
本例尝试使用TransBigData+leuvenmapmatching实现出租车GPS数据的路网匹配,使用的样例数据在:https://github.com/ni1o1/transbigdata/tree/main/docs/source/gallery/dataA Python package developed for transportation spatio-temporal big data processing and analysis. - transbigdata/example/data at main · ni1o1/transbigdata https://github.com/ni1o1/transbigdata/tree/main/docs/source/gallery/data
说明
本案例中用到的基础技术方法在我录制的课程中:
 https://www.bilibili.com/video/BV1WL4y1L7QG
 https://www.bilibili.com/video/BV1Gr4y1q7F9
轨迹整理
import transbigdata as tbd
import pandas as pd
# 地图匹配包
from leuvenmapmatching.matcher.distance import DistanceMatcher
from leuvenmapmatching.map.inmem import InMemMap
from leuvenmapmatching import visualization as mmviz

#读取数据
data = pd.read_csv('TaxiData-Sample.csv',header = None)
data.columns = ['VehicleNum','Time','Lng','Lat','OpenStatus','Speed']
#从GPS数据提取OD与路径GPS
oddata = tbd.taxigps_to_od(data,col = ['VehicleNum','Time','Lng','Lat','OpenStatus'])
data_deliver,data_idle = tbd.taxigps_traj_point(data,oddata,col=['VehicleNum', 'Time', 'Lng', 'Lat', 'OpenStatus'])
路网建模
# 获取路网
import osmnx as ox
bounds = [113.75, 22.4, 114.62, 22.86]
north, south, east, west = bounds[3], bounds[1], bounds[2], bounds[0]
G = ox.graph_from_bbox(north, south, east, west, network_type='drive')
#存储路网
ox.save_graphml(G,'shenzhen.graphml')#获取道路中心点坐标
nodes, edges = ox.graph_to_gdfs(G, nodes=True, edges=True)
edges['lon'] = edges.centroid.x
edges['lat'] = edges.centroid.y#转换路网的坐标系
G_p = ox.project_graph(G, to_crs=2416)
nodes_p, edges_p = ox.graph_to_gdfs(G_p, nodes=True, edges=True)edges_p.plot()
# 将路网转换为网络
map_con = InMemMap(name='pNEUMA', use_latlon=False) # , use_rtree=True, index_edges=True)

# 构建网络
for node_id, row in nodes_p.iterrows():
    map_con.add_node(node_id, (row['y'], row['x']))
for node_id_1, node_id_2, _ in G_p.edges:
    map_con.add_edge(node_id_1, node_id_2)
地图匹配
#用transbigdata提取出行轨迹
import geopandas as gpd
tmp_gdf = data_deliver[data_deliver['ID'] == 22].sort_values(by = 'Time')
#轨迹增密
tmp_gdf = tbd.traj_densify(tmp_gdf,col = ['ID', 'Time', 'Lng', 'Lat'],timegap = 15)
#转换轨迹的坐标系为地理坐标系
tmp_gdf['geometry'] = gpd.points_from_xy(tmp_gdf['Lng'],tmp_gdf['Lat'])
tmp_gdf = gpd.GeoDataFrame(tmp_gdf)
tmp_gdf.crs = {'init':'epsg:4326'}
tmp_gdf = tmp_gdf.to_crs(2416)
#获得轨迹点
path = list(zip(tmp_gdf.geometry.y, tmp_gdf.geometry.x))
#构建地图匹配工具
matcher = DistanceMatcher(map_con,
                          max_dist=500,
                          max_dist_init=170,
                          min_prob_norm=0.0001,
                        non_emitting_length_factor=0.95,
                        obs_noise=50,
                          obs_noise_ne=50,
                              dist_noise=50,
                              max_lattice_width=20,
                              non_emitting_states=True)
#进行地图匹配
states, _ = matcher.match(path, unique=False)
#绘制底图匹配结果
mmviz.plot_map(map_con, matcher=matcher,
               show_labels=False, show_matching=True,# show_graph=True,
               filename=None)
#获取地图匹配的路径geodataframe
pathdf = pd.DataFrame(matcher.path_pred_onlynodes,columns = ['u'])
pathdf['v'] = pathdf['u'].shift(-1)
pathdf = pathdf[-pathdf['v'].isnull()]
pathgdf = pd.merge(pathdf,edges_p.reset_index())
pathgdf = gpd.GeoDataFrame(pathgdf)
pathgdf.plot()
pathgdf.crs = {'init':'epsg:2416'}
pathgdf_4326 = pathgdf.to_crs(4326)
结果可视化
#与路网一起可视化
import matplotlib as mpl
import matplotlib.pyplot as plt
fig = plt.figure(1,(8,8),dpi = 100)
ax = plt.subplot(111)
plt.sca(ax)
fig.tight_layout(rect = (0.05,0.1,1,0.9))
#设定可视化边界
bounds = pathgdf_4326.unary_union.bounds
gap = 0.003
bounds = [bounds[0]-gap,bounds[1]-gap,bounds[2]+gap,bounds[3]+gap]
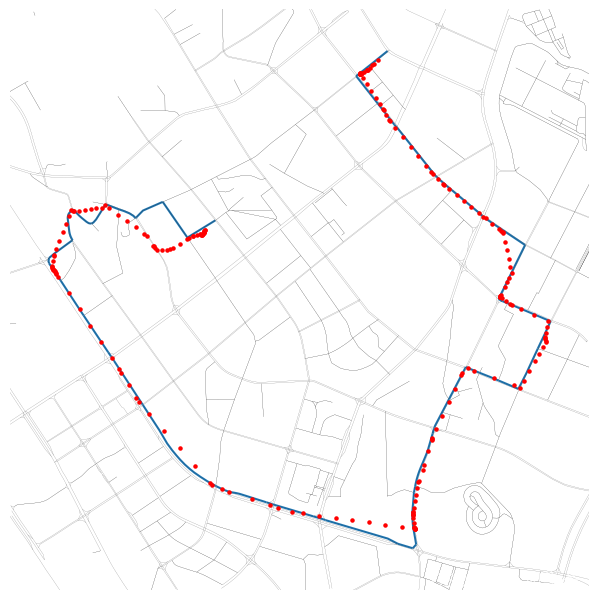
#绘制匹配的路径
pathgdf_4326.plot(ax = ax,zorder = 1)
#绘制底图路网
tbd.clean_outofbounds(edges,bounds,col = ['lon','lat']).plot(ax = ax,color = '#333',lw = 0.1)
#绘制GPS点
tmp_gdf.to_crs(4326).plot(ax = ax,color = 'r',markersize = 5,zorder = 2)
plt.axis('off')
plt.xlim(bounds[0],bounds[2])
plt.ylim(bounds[1],bounds[3])
plt.show()
随便选几个轨迹匹配的结果:


参考链接
TransBigData 为交通时空大数据而生 — TransBigData 0.2.7 文档https://transbigdata.readthedocs.io/Leuven.MapMatching’s documentation — Leuven.MapMatching 1.0.0 documentation
 https://leuvenmapmatching.readthedocs.io/en/latest/OSMnx 1.1.2 — OSMnx 1.1.2 documentationhttps://osmnx.readthedocs.io/en/stable/

华为开发者空间,是为全球开发者打造的专属开发空间,汇聚了华为优质开发资源及工具,致力于让每一位开发者拥有一台云主机,基于华为根生态开发、创新。
更多推荐


 44
44 1
1- 0


 已为社区贡献3条内容

所有评论(0)