雷达图 The number of FixedLocator locations (13), usually from a call to set_ticks, does not match the
The number of FixedLocator locations (13), usually from a call to set_ticks, does not match the number of ticklabels (12).最近在使用matplotlib绘制雷达图时,出现了如上所述问题。我建立时序预测模型对风机的各项参数做了预测,最后想可视化这些参数各自的预测误差。解决方案:保
The number of FixedLocator locations (13), usually from a call to set_ticks,
does not match the number of ticklabels (12).
最近使用时序预测模型对风机的各项参数做了预测,最后想可视化这些参数各自的预测误差,但是在使用matplotlib绘制雷达图时,出现了如上所述问题。
解决方案:
- 保证绘图时
feature和values数量一致:
函数内代码第三行后加上feature=np.concatenate((feature,[feature[0]]))
过程
起初,我的代码如下:
def radarplot(values, feature):
    # 设置每个数据点的显示位置,在雷达图上用角度表示
    angles=np.linspace(0, 2*np.pi,len(values), endpoint=False)
    # 拼接数据首尾,使图形中线条封闭
    values=np.concatenate((values,[values[0]]))
    angles=np.concatenate((angles,[angles[0]]))
    fig=plt.figure()
    ax = fig.add_subplot(111, polar=True)
    ax.plot(angles, values, 'o-', linewidth=2)
    ax.fill(angles, values, alpha=0.25)
    ax.set_thetagrids(angles * 180/np.pi, feature)
    ax.grid(True)

test_rmse_each = np.sqrt(np.mean(test_err.values**2, axis=0))
#print(test_rmse_each,test_err.columns)
radarplot(test_rmse_each, test_err.columns)
运行结果虽然能显示出雷达图,但是会有错误提示,且没有显示各个角度对应的属性名称。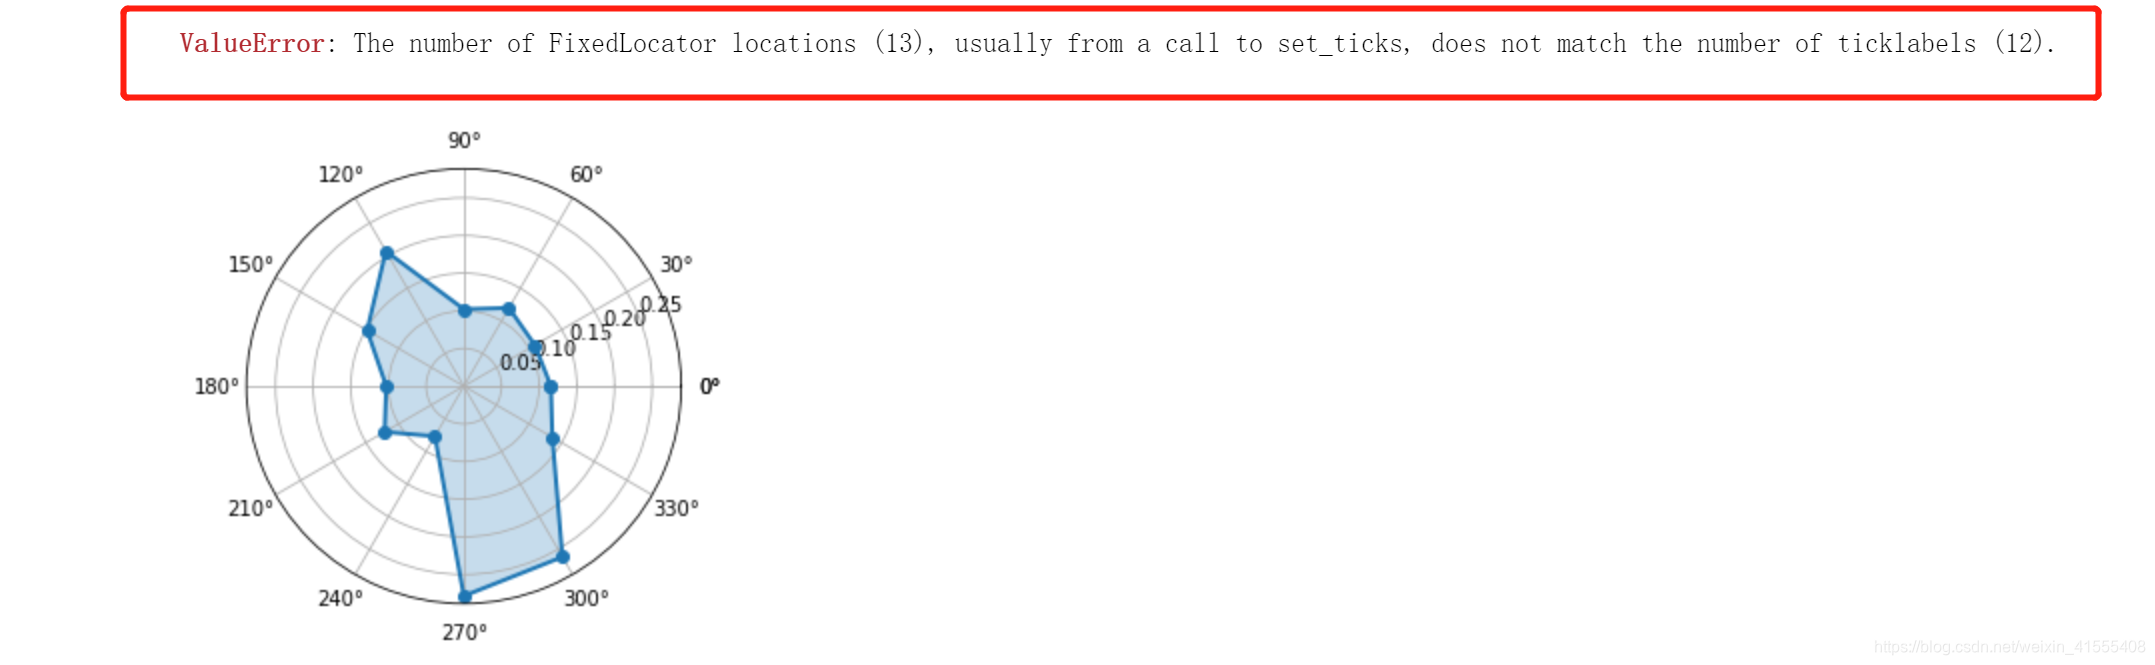
报错定位在这一行

最开始,根据报错提示,感觉应该是一开始设定的标签数量(radarplot函数内第一行:angles=np.linspace(0, 2*np.pi,len(values), endpoint=False))和后面绘图时输入值的数量(radarplot函数内第八行:ax.set_thetagrids(angles * 180/np.pi, feature))不匹配了。注意函数里第一行,我们在设置角度时,根据value的个数来设置的,但是后面的np.concatenate函数却又进行了一次首尾相连,相当于此时的value数值是在原来的基础上又加了1。应该是此处导致了报错。所以我们要解决的就是这个问题。
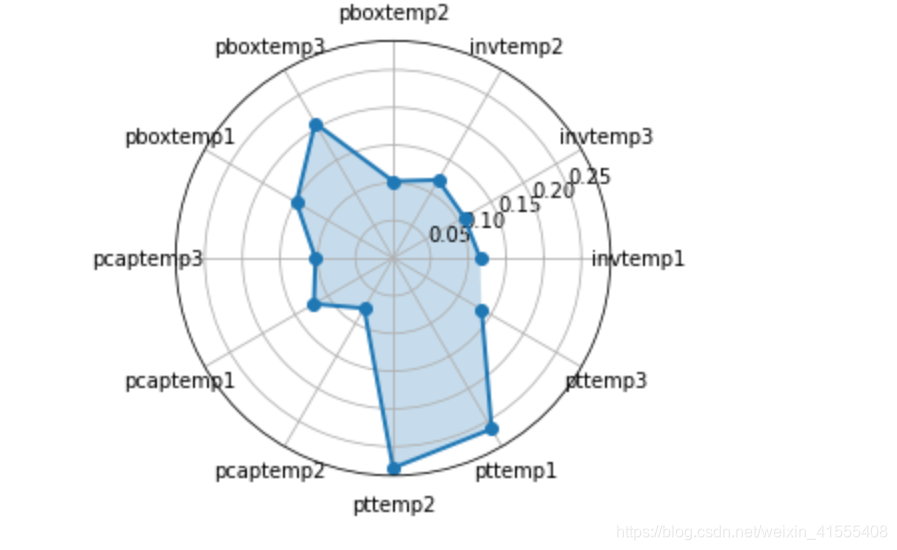
在网上搜索后发现,matplotlib新版本(应该是2020之后)不需要再进行np.concatenate了,于是把函数内第二、三行注释掉。此时,代码就可以成功运行,没有报错,而且各个角度上显示的也是属性,而不是角度,但是雷达图不闭合。
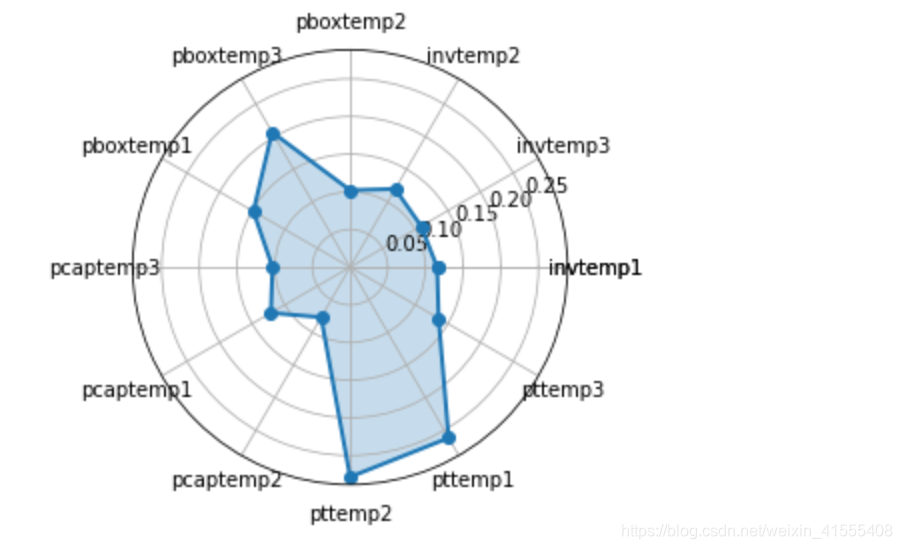
要想雷达图闭合就需要进行首尾相连的操作,但是网上搜到的方法都是说注释掉np.concatenate行,显然这种解决方法不能帮我们得到一个好看的闭合的雷达图。转念一想,上面出错是因为feature数量和np.concatenate后的value数量不一致了,那我们把feature数量也加一不就可以了嘛。于是,按照类似的操作,在函数内代码第三行后加上feature=np.concatenate((feature,[feature[0]])) ,再运行代码,完美~

为开发者提供学习成长、分享交流、生态实践、资源工具等服务,帮助开发者快速成长。
更多推荐


 32
32 0
0- 0


 已为社区贡献3条内容

所有评论(0)