Python 中图例 Legend 的调整
python 中图例的使用
·
Part.I 调用方法
基本调用,可以在plot中设置label标签,
plt.plot(x, y, color="black", linestyle="-.", linewidth="2", label="sinx")
plt.legend()
也可以在调用legend的时候指定label的内容:
plt.plot(x, y, color="black", linestyle="-.", linewidth="2")
plt.legend(["sinx"])
Chap.I 位置参数
参考:https://blog.csdn.net/Wannna/article/details/102751689
https://blog.csdn.net/qq_33221533/article/details/81431264
legend的位置主要通过函数的loc参数来设置,loc可以取的值可以是string,也可以是数字,详见下面的表格:
| 位置 | String | Number |
|---|---|---|
| 右上 | upper right | 1 |
| 左上 | upper left | 2 |
| 左下 | lower left | 3 |
| 右下 | lower right | 4 |
| 正右 | right | 5 |
| 中央偏左 | center left | 6 |
| 中央偏右 | center right | 7 |
| 中央偏下 | lower center | 8 |
| 中央偏上 | upper center | 9 |
| 正中央 | center | 10 |
具体在图中的位置如下图:

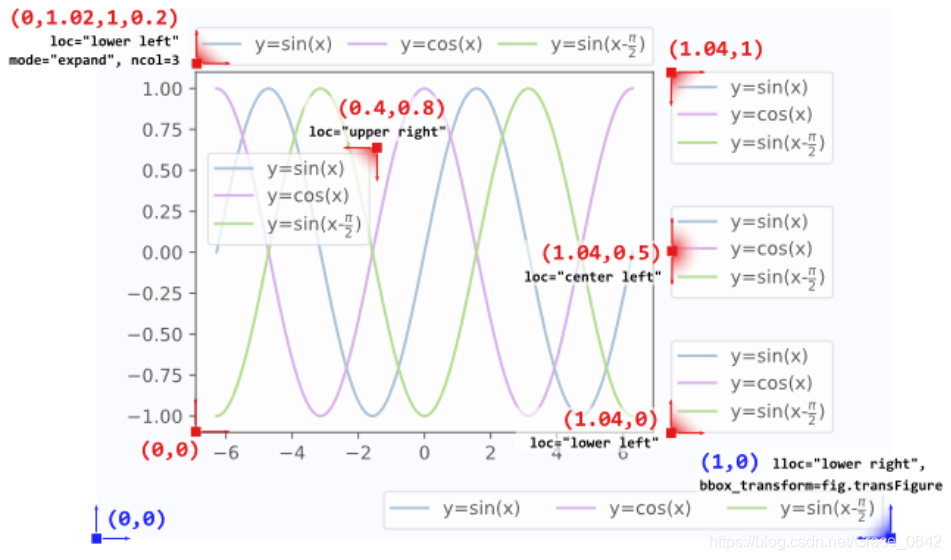
除了上述取值外,还有一个比较特殊的取值best,它会自动寻找最优的地方放置图例(有时候会十分智障)。当然,loc 的参数经常和bbox_to_anchor参数组合,这个参数的取值是元组,一般会这样用:
l1 = plt.legend(bbox_to_anchor=(1.04,1), borderaxespad=0)
l2 = plt.legend(bbox_to_anchor=(1.04,0), loc="lower left", borderaxespad=0)
l3 = plt.legend(bbox_to_anchor=(1.04,0.5), loc="center left", borderaxespad=0)
l4 = plt.legend(bbox_to_anchor=(0,1.02,1,0.2), loc="lower left",
                mode="expand", borderaxespad=0, ncol=3)
l5 = plt.legend(bbox_to_anchor=(1,0), loc="lower right",
                bbox_transform=fig.transFigure, ncol=3)
l6 = plt.legend(bbox_to_anchor=(0.4,0.8), loc="upper right")
Chap.II 其他参数
这里列一些个人比较常用的参数及其取值:
ncol=3				#图例分成3列
frameon=False		#不要图例框架
framealpha=0.5		#图例框架的透明度
edgecolor			#图例框架边缘颜色
prop=font2			#图例采用的字体参数
fontsize=10			#图例所用字体大小,这个参数只有在没有指定prop参数的时候才会发挥作用。
还有一些其他参数,其具体含义可以参看上面的博文。

为开发者提供学习成长、分享交流、生态实践、资源工具等服务,帮助开发者快速成长。
更多推荐


 9
9 0
0- 0


 已为社区贡献9条内容

所有评论(0)