yolov5的anchor详解
一直对yolov5的检测过程怎么完成的,利用anchor加速学习,在损失时与GT比较,加速收敛。
以yolov5s v3为例:
以下是yolov5 v3.0中的anchor
anchors:
 1. [10,13, 16,30, 33,23]  # P3/8  		608/8=76
 2. [30,61, 62,45, 59,119]  # P4/16		608/16=38
 3. [116,90, 156,198, 373,326]  # P5/32	608/32=19
为啥anchor一共是3行呢?
答:这里指的是在三个不同分辨率的特征图上的anchor,能够分别对大、中、小目标进行计算。
第一行在最大的特征图上 ----小数值检测大的目标
第二行在第二大的特征图上
第三行在最小的特征图上----大数值检测小的目标
为啥anchor一行是六个数呢,xywh个数也不对啊?
这里就要说一下anchor是怎么生成的了。
-
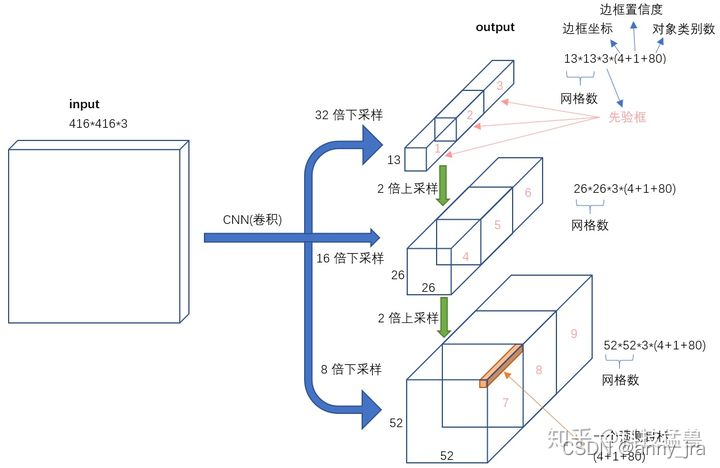
对于输出层(Prediction),经过前面的一系列特征提取和计算操作后,会生成三个特定大小的特征,大小分别为608/8=76,608/16=38,608/32=19,可能这也是输入图像大小要求是32的倍数的原因。
-
下面是v5代码中采用kmeans计算anchor的过程。
path代表数据yaml路径,n代表聚类数,img_size代表模型输入图片的大小,thr代表长宽比的阈值(将长宽比限定在一定的范围内,这个可以自己统计一下数据集),gen代表kmeans迭代次数。
def kmean_anchors(path='./data/coco128.yaml', n=9, img_size=640, thr=4.0, gen=1000, verbose=True):
    """ Creates kmeans-evolved anchors from training dataset

        Arguments:
            path: path to dataset *.yaml, or a loaded dataset
            n: number of anchors
            img_size: image size used for training
            thr: anchor-label wh ratio threshold hyperparameter hyp['anchor_t'] used for training, default=4.0
            gen: generations to evolve anchors using genetic algorithm

        Return:
            k: kmeans evolved anchors

        Usage:
            from utils.general import *; _ = kmean_anchors()
    """
    thr = 1. / thr

    def metric(k, wh):  # compute metrics
        r = wh[:, None] / k[None]
        x = torch.min(r, 1. / r).min(2)[0]  # ratio metric
        # x = wh_iou(wh, torch.tensor(k))  # iou metric
        return x, x.max(1)[0]  # x, best_x

    def fitness(k):  # mutation fitness
        _, best = metric(torch.tensor(k, dtype=torch.float32), wh)
        return (best * (best > thr).float()).mean()  # fitness

    def print_results(k):
        k = k[np.argsort(k.prod(1))]  # sort small to large
        x, best = metric(k, wh0)
        bpr, aat = (best > thr).float().mean(), (x > thr).float().mean() * n  # best possible recall, anch > thr
        print('thr=%.2f: %.4f best possible recall, %.2f anchors past thr' % (thr, bpr, aat))
        print('n=%g, img_size=%s, metric_all=%.3f/%.3f-mean/best, past_thr=%.3f-mean: ' %
              (n, img_size, x.mean(), best.mean(), x[x > thr].mean()), end='')
        for i, x in enumerate(k):
            print('%i,%i' % (round(x[0]), round(x[1])), end=',  ' if i < len(k) - 1 else '\n')  # use in *.cfg
        return k

    if isinstance(path, str):  # *.yaml file
        with open(path) as f:
            data_dict = yaml.load(f, Loader=yaml.FullLoader)  # model dict
        from utils.datasets import LoadImagesAndLabels
        dataset = LoadImagesAndLabels(data_dict['train'], augment=True, rect=True)
    else:
        dataset = path  # dataset

    # Get label wh
    shapes = img_size * dataset.shapes / dataset.shapes.max(1, keepdims=True)
    wh0 = np.concatenate([l[:, 3:5] * s for s, l in zip(shapes, dataset.labels)])  # wh

    # Filter
    i = (wh0 < 3.0).any(1).sum()
    if i:
        print('WARNING: Extremely small objects found. '
              '%g of %g labels are < 3 pixels in width or height.' % (i, len(wh0)))
    wh = wh0[(wh0 >= 2.0).any(1)]  # filter > 2 pixels

    # Kmeans calculation
    print('Running kmeans for %g anchors on %g points...' % (n, len(wh)))
    s = wh.std(0)  # sigmas for whitening
    k, dist = kmeans(wh / s, n, iter=30)  # points, mean distance
    k *= s
    wh = torch.tensor(wh, dtype=torch.float32)  # filtered
    wh0 = torch.tensor(wh0, dtype=torch.float32)  # unflitered
    k = print_results(k)

    # Plot
    # k, d = [None] * 20, [None] * 20
    # for i in tqdm(range(1, 21)):
    #     k[i-1], d[i-1] = kmeans(wh / s, i)  # points, mean distance
    # fig, ax = plt.subplots(1, 2, figsize=(14, 7))
    # ax = ax.ravel()
    # ax[0].plot(np.arange(1, 21), np.array(d) ** 2, marker='.')
    # fig, ax = plt.subplots(1, 2, figsize=(14, 7))  # plot wh
    # ax[0].hist(wh[wh[:, 0]<100, 0],400)
    # ax[1].hist(wh[wh[:, 1]<100, 1],400)
    # fig.tight_layout()
    # fig.savefig('wh.png', dpi=200)

    # Evolve
    npr = np.random
    f, sh, mp, s = fitness(k), k.shape, 0.9, 0.1  # fitness, generations, mutation prob, sigma
    pbar = tqdm(range(gen), desc='Evolving anchors with Genetic Algorithm')  # progress bar
    for _ in pbar:
        v = np.ones(sh)
        while (v == 1).all():  # mutate until a change occurs (prevent duplicates)
            v = ((npr.random(sh) < mp) * npr.random() * npr.randn(*sh) * s + 1).clip(0.3, 3.0)
        kg = (k.copy() * v).clip(min=2.0)
        fg = fitness(kg)
        if fg > f:
            f, k = fg, kg.copy()
            pbar.desc = 'Evolving anchors with Genetic Algorithm: fitness = %.4f' % f
            if verbose:
                print_results(k)

    return print_results(k)
上面的计算过程相当于将我画的长宽比先转化到resize640大小的长宽比下,再进行聚类,得到9个聚类中心,每个聚类中心包含(x,y)坐标就是我们需要的anchor如下:
134,38, 172,35, 135,48, 175,43, 209,38, 174,62, 254,69, 314,82, 373,95
将其放入list
#anchors:
 #1. [10,13, 16,30, 33,23]  # P3/8  		608/8=76
 #2. [30,61, 62,45, 59,119]  # P4/16		608/16=38
 #3. [116,90, 156,198, 373,326]  # P5/32	608/32=19
 1. [134,38,135,48,172,35]  # P3/8  		608/8=76
 2. [174,62,175,43,209,38]  # P4/16			608/16=38
 3. [254,69,314,82,373,95]  # P5/32			608/32=19
这里的thr其实是和hyp.scratch.yaml文件中的anchor_t一样,代表了anchor放大的scale,我的标注框长宽比最大在8左右,因此设置为8。
检测模块
接下来就是anchor在模型中的应用了。这就涉及到了yolo系列目标框回归的过程了。
yolov5中的detect模块沿用了v3检测方式,这里就用这种方式来阐述了。
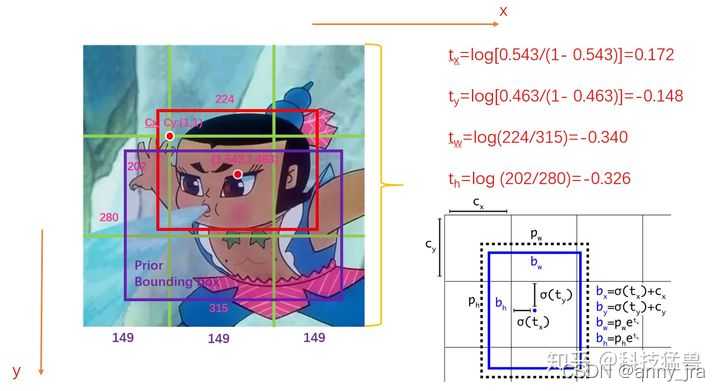
1.检测到的不是框,是偏移量。
   tx,ty指的是针对所在grid的左上角坐标的偏移量
   tw,th指的是相对于anchor的宽高的偏移量
通过如下图的计算方式,得到bx,by,bw,bh就是最终的检测结果。
2. 前面经过backbone,neck, head是panet的三个分支,可见特征图size不同,每个特征图分了13个网格,同一尺度的特征图对应了3个anchor,检测了[c,x,y,w,h]和num_class个的one-hot类别标签。3个尺度的特征图,总共就有9个anchor。
-
用多个anchor去负责一个GT。方法是:对于 GT-j 来说,只要
IoU (anchor-i, GT-j) > threshold ,就让 anchor-i 去负责 GT-j 。 -
ioul loss 这里采用的是GIOU loss。

-
加了nonautoanchor参数,可以控制要不要重新算anchor,还是用默认的就好。
代码中的具体方法,loss函数的具体过程待补充。。。

为开发者提供学习成长、分享交流、生态实践、资源工具等服务,帮助开发者快速成长。
更多推荐


 14
14 0
0- 0


 已为社区贡献1条内容

所有评论(0)