python下的spectral模块(高光谱图像处理)
Spectral Python (SPy)是一个用于处理高光谱图像数据的纯Python模块。它具有读取、显示、操作和分类高光谱图像的功能。之所以用它是因为这个对多波段图像的支持更好参考一、SPy 安装依赖模块虽然可以只用Python和NumPy来使用SPy来处理高光谱数据,但如果想使用SPy的任何图形功能,你还需要其他几个模块要在IPython中使用SPy,您需要在" pylab "模式下启动IP
Spectral Python (SPy)是一个用于处理高光谱图像数据的纯Python模块。它具有读取、显示、操作和分类高光谱图像的功能。
之所以用它是因为这个对多波段图像的支持更好
参考
一、SPy 安装
依赖模块
虽然可以只用Python和NumPy来使用SPy来处理高光谱数据,但如果想使用SPy的任何图形功能,你还需要其他几个模块
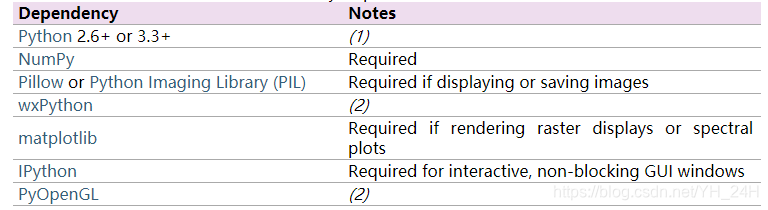
要在IPython中使用SPy,您需要在" pylab "模式下启动IPython(请参阅启动IPython)
安装
pip install spectral
二、读取高光谱图像
import spectral
img = open_image('92AV3C.lan')
print(img)
这个时候会显示图片信息,包括长宽波段数等,如下:
Data Source:   '.\.\./92AV3C.lan'
# Rows:            145
# Samples:         145
# Bands:           220
Interleave:        BIL
Quantization:  16 bits
Data format:     int16
读取图像文件中的特殊子类实例方法
| 方法 | 描述 |
|---|---|
| read_band | Reads a single band into an MxN array |
| read_bands | Reads multiple bands into an MxNxC array |
| read_pixel | Reads a single pixel into a length B array |
| read_subregion | Reads multiple bands from a rectangular sub-region of the image |
| read_subimage | Reads specified rows, columns, and bands |
三、显示图像
1 固定显示
按理就是如下
import spectral

img = spectral.open_image('./92AV3C.lan')
print(img)
view = spectral.imshow(img)
但是图像一闪而过,并且spectral好像没有类似CV2的waitKey方法。所以无法暂停,解决方法有三:
- 断点
加断点调试, - 进入ipython模式,
终端下输入ipython并回车
In [1]: from spectral import *

In [2]: img = open_image('92AV3C.lan')

In [3]: view = imshow(img,(29,19,9))
Attribute Qt::AA_EnableHighDpiScaling must be set before QCoreApplication is created.
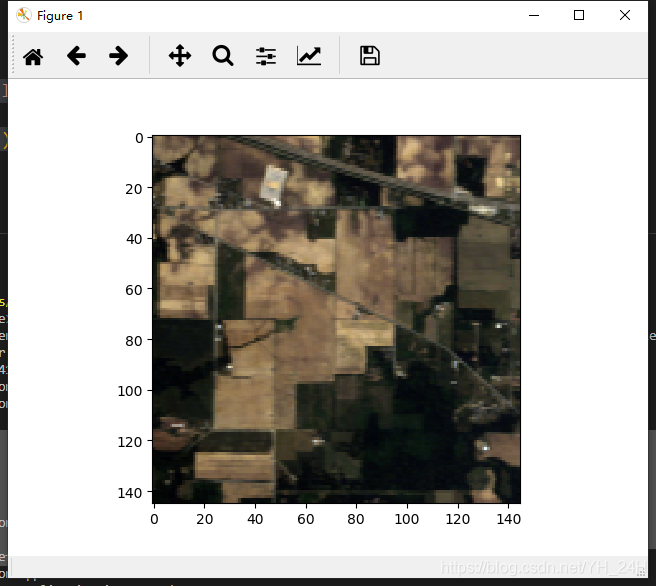
图片显示出来。
- 借助CV2的waitKey
这个是真的离谱,但是还挺好用
import spectral
import cv2

img = spectral.open_image('./92AV3C.lan')

img_1 = img[:,:,19].reshape(145,145)

view = spectral.imshow(img,(29,19,9))

cv2.imshow('1',img_1)
cv2.waitKey(0)
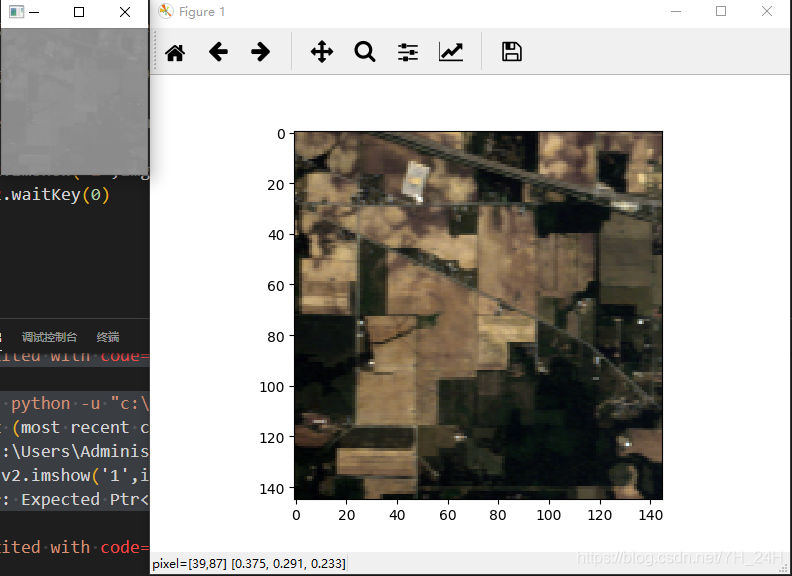
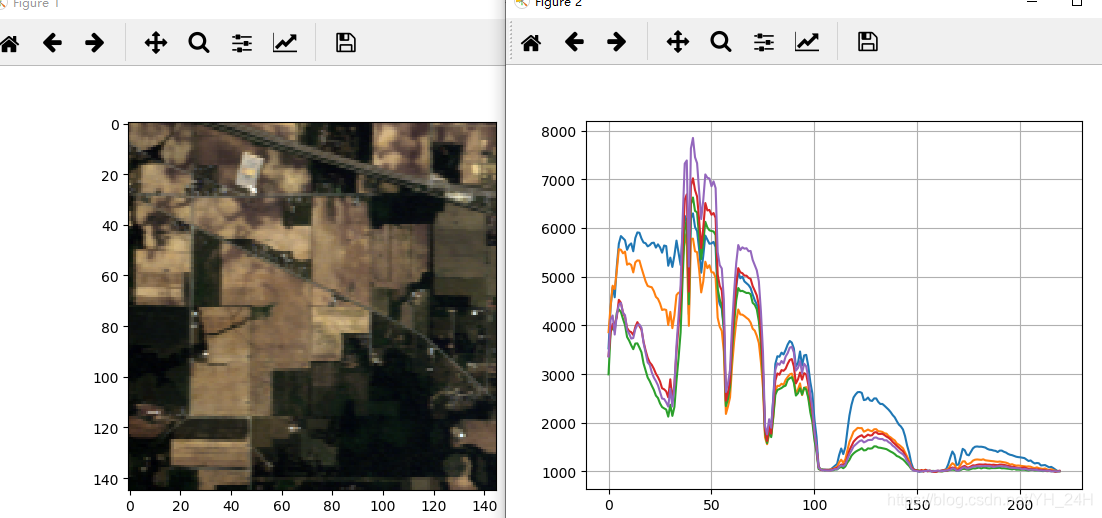
左边那幅小图就是opencv显示的。有点透。
2 spectral的特点
-
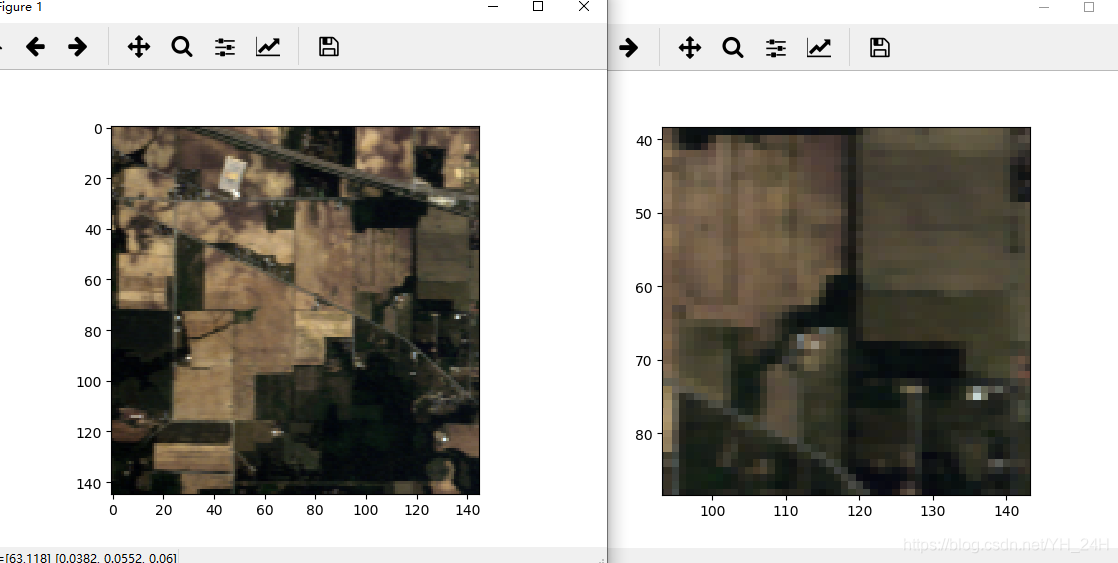
图像放大镜
按下z键盘键,将打开变焦窗口,显示图像的放大视图。通过按住ctrl键并在原始窗口中用鼠标左键单击,缩放窗口将显示原始窗口中选中的像素
-
显示像素光谱信息
双击原始图或者缩放窗口中的点,将会显示该点的全波段信息。点可以叠加。
-
显示RGB 数据
In [1]: from spectral import *

In [2]: img = open_image('92AV3C.lan')

In [3]: view = imshow(img, (29, 19, 9))
In [4]: print(view)
ImageView object:
  Display bands       :  (29, 19, 9)
  Interpolation       :  <default>
  RGB data limits     :
    R: [2054.0, 6317.0]
    G: [2775.0, 7307.0]
    B: [3560.0, 7928.0]
imshow(img, (29, 19, 9))中的(29,19,9)就是从光谱中分别抽取的第29,19,9个波段来当替代RGB三个波段。形成伪RGB图像。(原因是谱相机可能避开了可见光部分波段,无法形成真RGB图)
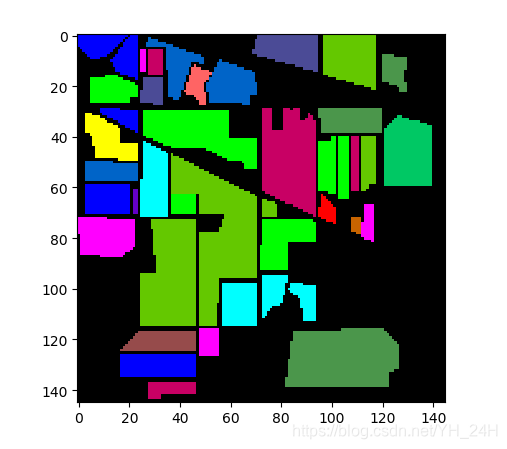
4. 类地图显示
import spectral
import cv2

img = spectral.open_image('./92AV3C.lan')
img_1 = img[:,:,19].reshape(145,145)

# 显示真实地物分类
gt = spectral.open_image('92AV3GT.GIS').read_band(0)
view = spectral.imshow(classes=gt)

cv2.imshow('1',img_1)
cv2.waitKey(0)
import spectral
import cv2

img = spectral.open_image('./92AV3C.lan')
img_1 = img[:,:,19].reshape(145,145)

#显示遮罩图像
gt = spectral.open_image('92AV3GT.GIS').read_band(0)
view = spectral.imshow(img, (30, 20, 10), classes=gt)
view.set_display_mode('overlay') #显示模式为覆盖
view.class_alpha = 0.5 #透明度


cv2.imshow('1',img_1)
cv2.waitKey(0)
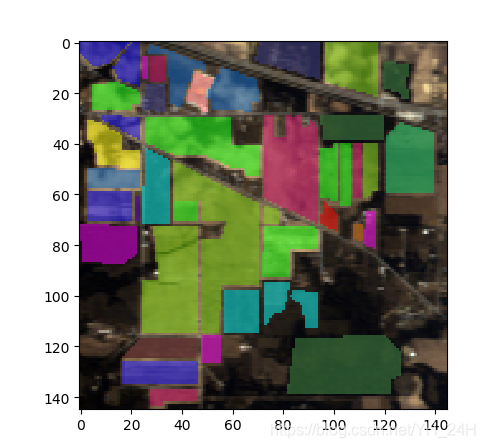
可以按键盘上的c,d,shift+C来互相切换。关于键鼠方面的快捷方式,可以通过按h键来在终端输出。
如下:
Mouse Functions:
----------------
ctrl+left-click          ->   pan zoom window to pixel
shift+left-click&drag    ->   select rectangular image region
left-dblclick            ->   plot pixel spectrum

Keybinds:
---------
0-9     -> enter class ID for image pixel labeling
ENTER   -> apply specified class ID to selected rectangular region
a/A     -> decrease/increase class overlay alpha value
c       -> set display mode to "classes" (if classes set)
C       -> set display mode to "overlay" (if data and classes set)
d       -> set display mode to "data" (if data set)
h       -> print help message
i       -> toggle pixel interpolation between "nearest" and SPy default.
z       -> open zoom window
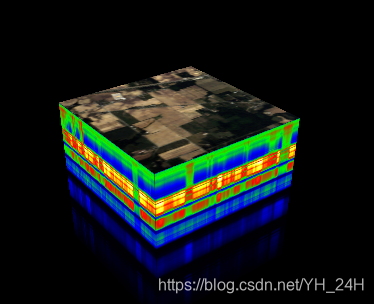
3 光谱立方体显示
个人觉得超立方显示光谱图像不具备分析效用,但是的确巨塔马好看

这部分需要安装wx包,openGL包,
wx基于 wxPython 模块实现
pip3 install wxPython
pip3 install PyOpenGL
安装好了就可以显示了,输入以下代码
import spectral
import cv2

img = spectral.open_image('./92AV3C.lan')
img_1 = img[:,:,19].reshape(145,145)

spectral.view_cube(img, bands=[29, 19, 9])
#这里也可以不选波段,但是打开会慢很多


cv2.imshow('1',img_1)
cv2.waitKey(0)
这里注意,打开的窗口产生空白画布(未显示立方体),如果是显示器不支持32位深度缓冲区,可以使用如下命令改变缓冲器大小位16位等
spectral.settings.WX_GL_DEPTH_SIZE = 16
四、保存图像
spectral.save_rgb('rgb.jpg', img, [29, 19, 9])
保存索引彩色图像类似于保存 RGB 图像

为开发者提供学习成长、分享交流、生态实践、资源工具等服务,帮助开发者快速成长。
更多推荐


 38
38 0
0- 0


 已为社区贡献2条内容

所有评论(0)