python画自定义颜色的坐标图
用python画自定义颜色的坐标图。
·
import numpy as np
import matplotlib.pyplot as plt
plt.axis([0, 100, 0, 10]) # x轴是0-100,y轴是0-10
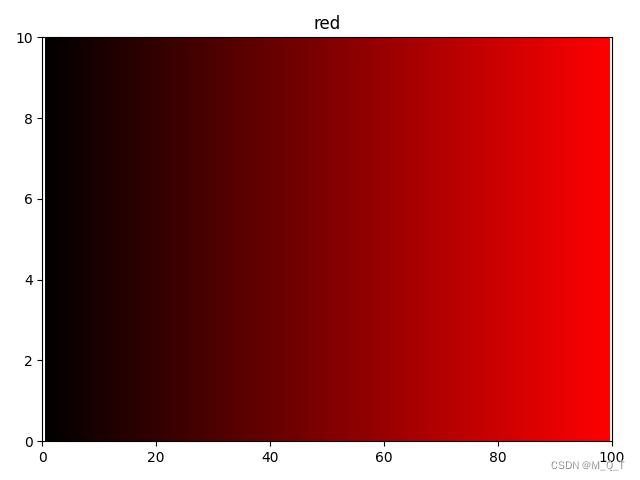
# 第一幅红色渐变色
for x in np.arange(1, 100, 1): # 100次遍历
r = x/100
g = 0
b = 0
# [x, x] x方向 , [0, 10]y方向
plt.plot([x, x], [0, 10], linewidth=5, color=(r, g, b)) # linewidth=5 线宽
plt.title('red')
plt. show()
# 第二幅绿色渐变色
for x in np.arange(1, 100, 1): # 100次遍历
r = 0
g = x/100
b = 0
plt.plot([x, x], [0, 10], linewidth=5, color=(r, g, b)) # linewidth=5 线宽
plt.title('green')
plt. show()
# 第三幅蓝色渐变色
for x in np.arange(1, 100, 1): # 100次遍历
r = 0
g = 0
b = x/100
plt.plot([x, x], [0, 10], linewidth=5, color=(r, g, b)) # linewidth=5 线宽
plt.title('bule')
plt. show()
# 可以通过color(r,g,b)语句利用红(r)、绿(g)、蓝(b)三种颜色混合搭配出自己想要的颜色
# 例如color=(1, 0, 1)就是洋红色,color=(0.7,0.7, 0.7)就是浅灰色
# 第四幅图
for x in np.arange(1, 100, 1):
plt.plot([x, x], [0, 10], linewidth=5, color=(1, 0, 1)) # linewidth=5 线宽
plt.title('yang hong se')
plt. show()
上述代码运行如下:
第一幅图:

第二幅图:

第三幅图:

第四幅图:


华为开发者空间,是为全球开发者打造的专属开发空间,汇聚了华为优质开发资源及工具,致力于让每一位开发者拥有一台云主机,基于华为根生态开发、创新。
更多推荐

 4
4 0
0- 0


 已为社区贡献11条内容

所有评论(0)