neo4j可视化
neo4j的创建、查询所有节点并可视化在前端、查询单个节点和下一级节点并可视化在前端
利用Echarts将后端获取的neo4j中的图谱数据显示在前端界面
文章包括四部分内容:
①利用python创建图数据库
②查询neo4j中所有的节点和关系并显示在前端
③查询前端输入的节点,并显示该节点及其下一级节点以及他们之前的关系
④将查询所有和查询单个合并
一、利用python创建图数据库
1、启动neo4j
在cmd中输入neo4j.bat console
2、安装py2neo
在pycharm的命令窗口输入pip install py2neo
3、创建数据
import py2neo

# 连接数据库
graph = py2neo.Graph('http://localhost:7474', auth=('neo4j', 'root'))

def creat():
    # 创建节点
    lb = py2neo.Node('person', name='刘备')
    gy = py2neo.Node('person', name='关羽')
    zgl = py2neo.Node('person', name='诸葛亮')
    cc = py2neo.Node('person', name='曹操')
    xhd = py2neo.Node('person', name='夏侯惇')
    sq = py2neo.Node('person', name='孙权')
    sc = py2neo.Node('person', name='孙策')
    zy = py2neo.Node('person', name='周瑜')
    graph.create(lb)
    graph.create(gy)
    graph.create(zgl)
    graph.create(cc)
    graph.create(xhd)
    graph.create(sq)
    graph.create(sc)
    graph.create(zy)
    r1 = py2neo.Relationship(lb, '兄弟', gy)
    r2 = py2neo.Relationship(lb, '属下', zgl)
    r3 = py2neo.Relationship(lb, '大舅哥+敌对', sc)
    r4 = py2neo.Relationship(lb, '二舅哥+敌对', sq)
    r5 = py2neo.Relationship(lb, '敌对', cc)
    r6 = py2neo.Relationship(cc, '属下', xhd)
    r7 = py2neo.Relationship(sq, '兄弟', sc)
    r8 = py2neo.Relationship(sq, '属下', zy)
    graph.create(r1)
    graph.create(r2)
    graph.create(r3)
    graph.create(r4)
    graph.create(r5)
    graph.create(r6)
    graph.create(r7)
    graph.create(r8)
 if __name__ == '__main__':
    creat()
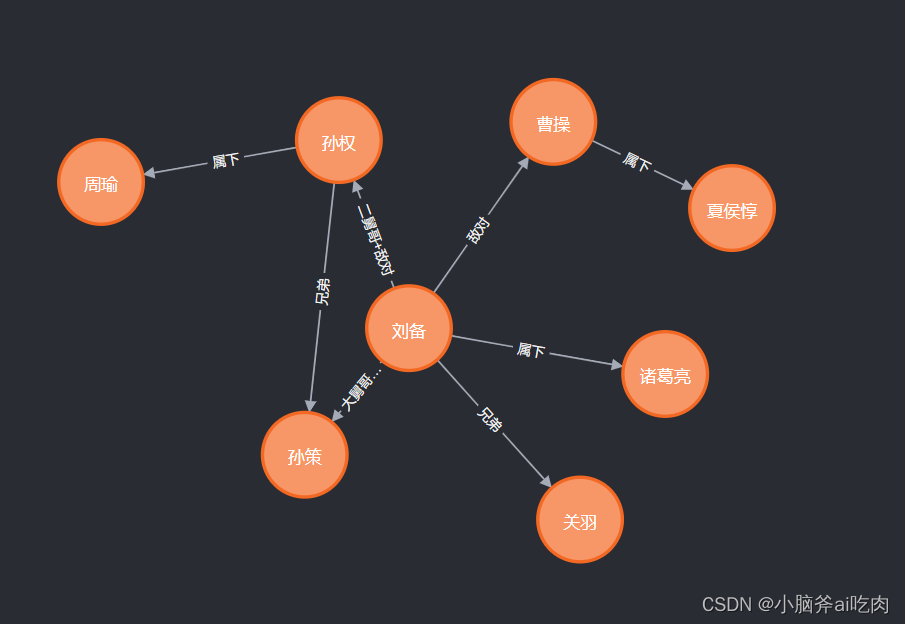
创建成功之后的效果在neo4j中的效果
二、查询所有节点和关系并显示在前端
1、引入echarts
echarts的引入并不复杂,详情见此处
2、查询所有节点和关系
后端
import json
from py2neo import *
from django.shortcuts import render

# 连接数据库
graph = Graph('http://localhost:7474/', auth=('neo4j', 'root'))


def search_all():
    # 定义data数组,存放节点信息
    data = []
    # 定义关系数组,存放节点间的关系
    links = []
    # 查询所有节点,并将节点信息取出存放在data数组中
    for n in graph.nodes:
        # 将节点信息转化为json格式,否则中文会不显示
        nodesStr = json.dumps(graph.nodes[n], ensure_ascii=False)
        # 取出节点的name
        node_name = json.loads(nodesStr)['name']
        # 构造字典,存储单个节点信息
        dict = {
            'name': node_name,
            'symbolSize': 50,
            'category': '对象'
        }
        # 将单个节点信息存放在data数组中
        data.append(dict)
    # 查询所有关系,并将所有的关系信息存放在links数组中
    rps = graph.relationships
    for r in rps:
        # 取出开始节点的name
        source = str(rps[r].start_node['name'])
        # 取出结束节点的name
        target = str(rps[r].end_node['name'])
        # 取出开始节点的结束节点之间的关系
        name = str(type(rps[r]).__name__)
        # 构造字典存储单个关系信息
        dict = {
            'source': source,
            'target': target,
            'name': name
        }
        # 将单个关系信息存放进links数组中
        links.append(dict)
    # 输出所有节点信息
    for item in data:
        print(item)
    # 输出所有关系信息
    for item in links:
        print(item)
    # 将所有的节点信息和关系信息存放在一个字典中
    neo4j_data = {
        'data': data,
        'links': links
    }
    #将字典转化json格式
    neo4j_data = json.dumps(neo4j_data)
    return neo4j_data

def index(request):
    neo4j_data = search_all()
    return render(request, 'index.html', {'neo4j_data': neo4j_data})
`
前端
{% load static %}
<!DOCTYPE html>
<html lang="en">
<head>
    <meta charset="UTF-8">
    <title>Title</title>
    <script type="text/javascript" src="{% static 'echarts.min.js' %}"></script>
</head>
<body>
<div id="container" style="width: 800px;height: 700px;border: 2px solid black;float: left;margin-top: 50px;"></div>
<script type="text/javascript">
    {#查询所有#}
    var neo4j_data = [{{ neo4j_data|safe }}]
    var data1 = neo4j_data[0]['data']
    var links1 = neo4j_data[0]['links']
    console.log(data1)
    console.log(links1)
    var myChart1 = echarts.init(document.getElementById('container'));
    var categories1 = [{name: "对象"}, {name: "属性"}, {name: "实例"}];
    option1 = {
        // 图的标题
        title: {
            text: '三国人物关系图谱'
        },
        // 提示框的配置
        tooltip: {
            formatter: function (x) {
                return x.data.des;
            }
        },
        // 工具箱
        toolbox: {
            // 显示工具箱
            show: true,
            feature: {
                mark: {
                    show: true
                },
                // 还原
                restore: {
                    show: true
                },
                // 保存为图片
                saveAsImage: {
                    show: true
                }
            }
        },
        legend: [{
            // selectedMode: 'single',
            data: categories1.map(function (a) {
                return a.name;
            })
        }],
        series: [{
            type: 'graph', // 类型:关系图
            layout: 'force', //图的布局,类型为力导图
            symbolSize: 40, // 调整节点的大小
            roam: true, // 是否开启鼠标缩放和平移漫游。默认不开启。如果只想要开启缩放或者平移,可以设置成 'scale' 或者 'move'。设置成 true 为都开启
            edgeSymbol: ['circle', 'arrow'],
            edgeSymbolSize: [2, 10],
            edgeLabel: {
                normal: {
                    textStyle: {
                        fontSize: 20
                    }
                }
            },
            force: {
                repulsion: 2500,
                edgeLength: [10, 50]
            },
            draggable: true,
            lineStyle: {
                normal: {
                    width: 2,
                    color: '#4b565b',
                }
            },
            edgeLabel: {
                normal: {
                    show: true,
                    formatter: function (x) {
                        return x.data.name;
                    }
                }
            },
            label: {
                normal: {
                    show: true,
                    textStyle: {}
                }
            },

            // 数据
            data: data1,
            links: links1,
            categories: categories1,
        }]
    };
    myChart1.setOption(option1);
</script>
</body>
</html>
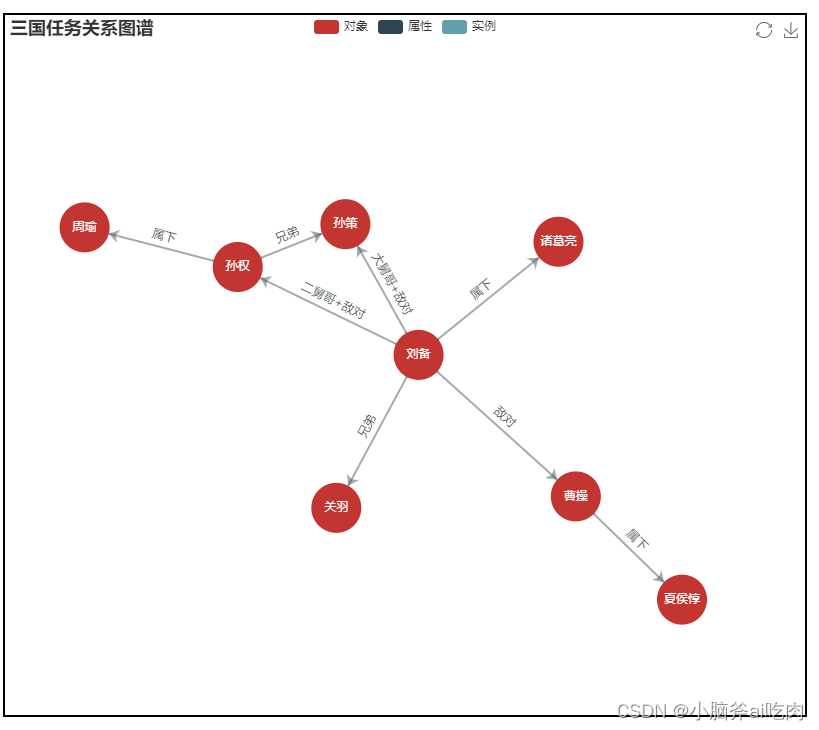
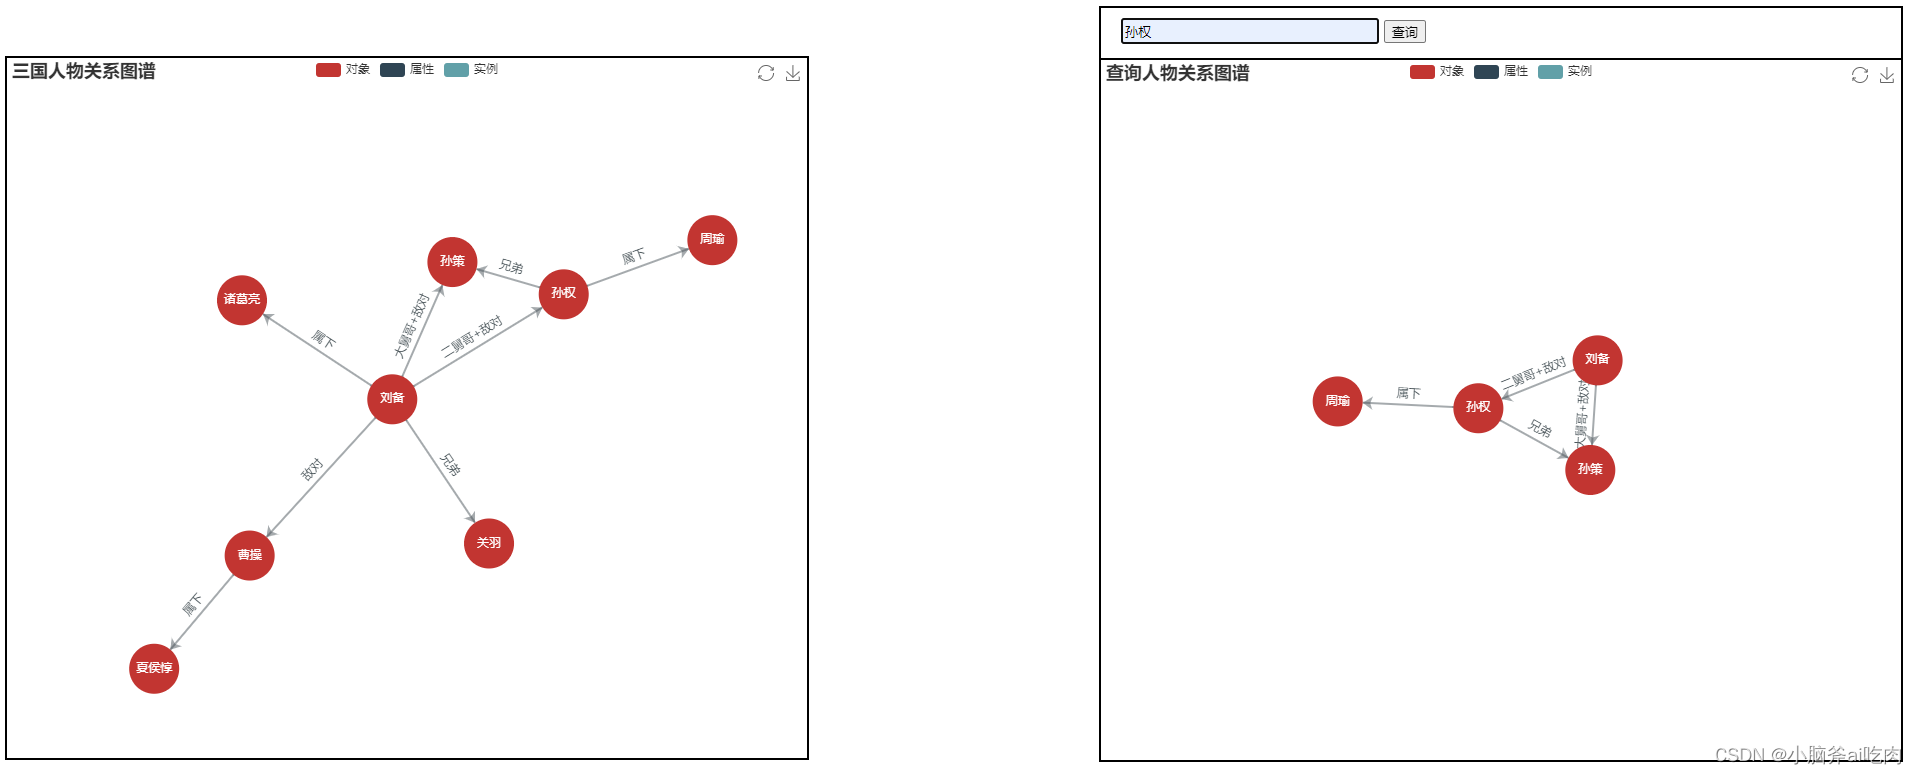
前端显示效果
如果你的需求只是需要在前端构造一个静态的知识图谱,而不是需要根据neo4j中的数据来构建动态图谱的话,那你可以参照这篇文章
三、查询前端输入的节点,并显示该节点及其下一级节点以及他们之前的关系
后端
import json
from py2neo import *
from django.shortcuts import render

# 连接数据库
graph = Graph('http://localhost:7474/', auth=('neo4j', 'root'))

def search_one(value):
    # 定义data数组存储节点信息
    data = []
    # 定义links数组存储关系信息
    links = []
    # 查询节点是否存在
    node = graph.run('MATCH(n:person{name:"' + value + '"}) return n').data()
    # 如果节点存在len(node)的值为1不存在的话len(node)的值为0
    if len(node):
        # 如果该节点存在将该节点存入data数组中
        # 构造字典存放节点信息
        dict = {
            'name': value,
            'symbolSize': 50,
            'category': '对象'
        }
        data.append(dict)
        # 查询与该节点有关的节点,无向,步长为1,并返回这些节点
        nodes = graph.run('MATCH(n:person{name:"' + value + '"})<-->(m:person) return m').data()
        # 查询该节点所涉及的所有relationship,无向,步长为1,并返回这些relationship
        reps = graph.run('MATCH(n:person{name:"' + value + '"})<-[rel]->(m:person) return rel').data()
        # 处理节点信息
        for n in nodes:
            # 将节点信息的格式转化为json
            node = json.dumps(n, ensure_ascii=False)
            node = json.loads(node)
            # 取出节点信息中person的name
            name = str(node['m']['name'])
            # 构造字典存放单个节点信息
            dict = {
                'name': name,
                'symbolSize': 50,
                'category': '对象'
            }
            # 将单个节点信息存储进data数组中
            data.append(dict)
        # 处理relationship
        for r in reps:
            source = str(r['rel'].start_node['name'])
            target = str(r['rel'].end_node['name'])
            name = str(type(r['rel']).__name__)
            dict = {
                'source': source,
                'target': target,
                'name': name
            }
            links.append(dict)
        # 构造字典存储data和links
        search_neo4j_data = {
            'data': data,
            'links': links
        }
        # 将dict转化为json格式
        search_neo4j_data = json.dumps(search_neo4j_data)
        return search_neo4j_data
    else:
        print("查无此人")
        return 0


def index(request):
    ctx = {}
    if request.method == 'POST':
        # 接收前端传过来的查询值
        node_name = request.POST.get('node')
        # 查询结果
        search_neo4j_data = search_one(node_name)
        # 未查询到该节点
        if search_neo4j_data == 0:
            ctx = {'title': '数据库中暂未添加该实体'}
        # 查询到了该节点
        else:
            return render(request, 'index.html',{'search_neo4j_data': search_neo4j_data, 'ctx': ctx})

    return render(request, 'index.html', {'ctx': ctx})
前端
{% load static %}
<!DOCTYPE html>
<html lang="en">
<head>
    <meta charset="UTF-8">
    <title>Title</title>
    <script type="text/javascript" src="{% static 'echarts.min.js' %}"></script>
</head>
<body>
<div style="width: 800px;height: 750px;float: right;margin-right: 10px;">
    <div style="width: 800px;height: 50px;border-top: 2px solid black;border-left: 2px solid black;border-right: 2px solid black">
        <form action="/" method="post">
            <input type="text" name="node" style="width: 250px;height: 20px; margin-top: 10px;margin-left: 20px;">
            <input type="submit" value="查询">
        </form>
    </div>
    {% if ctx %}
        <div style="width: 800px;height: 700px;border: 2px solid black;text-align: center;line-height: 704px;">
            <h1>该数据库中未添加该实体</h1>
        </div>
    {% endif %}
    {% if search_neo4j_data %}
        <div id="container_search" style="width: 800px;height: 700px;border: 2px solid black"></div>
    {% endif %}
</div>
<script type="text/javascript">
    {#查询单个#}
    var search_neo4j_data=[{{ search_neo4j_data|safe }}]
    var data2=search_neo4j_data[0]['data']
    var links2=search_neo4j_data[0]['links']
    console.log(data2)
    console.log(links2)
    var myChart2 = echarts.init(document.getElementById('container_search'));
    var categories2 = [{name: "对象"}, {name: "属性"}, {name: "实例"}];
    option2 = {
        // 图的标题
        title: {
            text: '查询人物关系图谱'
        },
        // 提示框的配置
        tooltip: {
            formatter: function (x) {
                return x.data.des;
            }
        },
        // 工具箱
        toolbox: {
            // 显示工具箱
            show: true,
            feature: {
                mark: {
                    show: true
                },
                // 还原
                restore: {
                    show: true
                },
                // 保存为图片
                saveAsImage: {
                    show: true
                }
            }
        },
        legend: [{
            // selectedMode: 'single',
            data: categories2.map(function (a) {
                return a.name;
            })
        }],
        series: [{
            type: 'graph', // 类型:关系图
            layout: 'force', //图的布局,类型为力导图
            symbolSize: 40, // 调整节点的大小
            roam: true, // 是否开启鼠标缩放和平移漫游。默认不开启。如果只想要开启缩放或者平移,可以设置成 'scale' 或者 'move'。设置成 true 为都开启
            edgeSymbol: ['circle', 'arrow'],
            edgeSymbolSize: [2, 10],
            edgeLabel: {
                normal: {
                    textStyle: {
                        fontSize: 20
                    }
                }
            },
            force: {
                repulsion: 2500,
                edgeLength: [10, 50]
            },
            draggable: true,
            lineStyle: {
                normal: {
                    width: 2,
                    color: '#4b565b',
                }
            },
            edgeLabel: {
                normal: {
                    show: true,
                    formatter: function (x) {
                        return x.data.name;
                    }
                }
            },
            label: {
                normal: {
                    show: true,
                    textStyle: {}
                }
            },

            // 数据
            data: data2,
            links: links2,
            categories: categories2,
        }]
    };
    myChart2.setOption(option2);

</script>
</body>
</html>
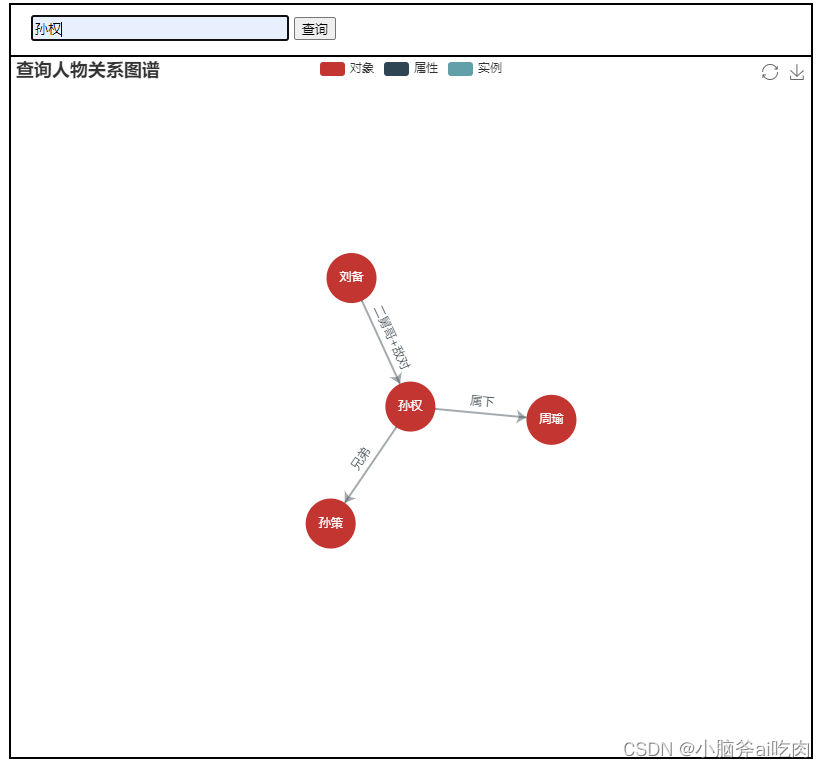
查询效果
四、将查询所有和查询单个合并
项目结构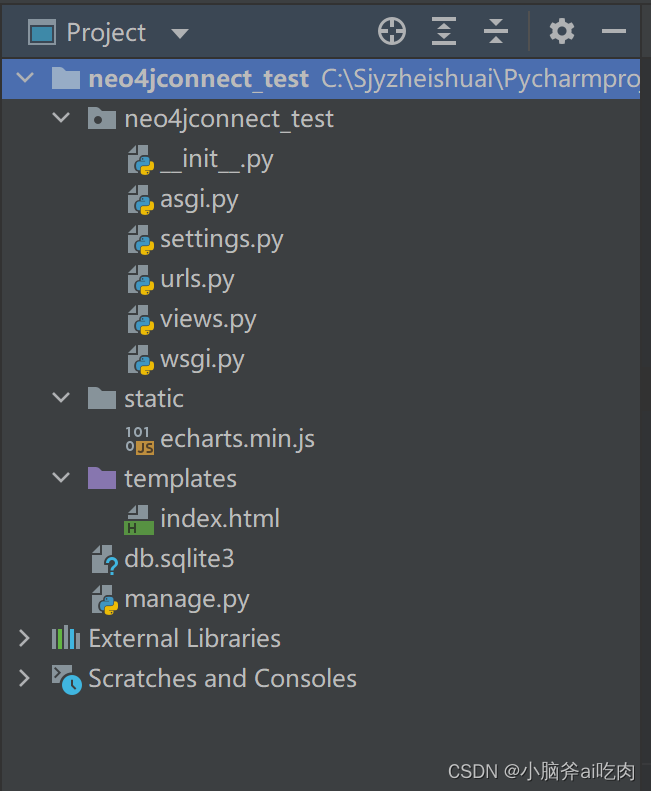
后端
import json
from py2neo import *
from django.shortcuts import render

# 连接数据库
graph = Graph('http://localhost:7474/', auth=('neo4j', 'root'))


def search_all():
    # 定义data数组,存放节点信息
    data = []
    # 定义关系数组,存放节点间的关系
    links = []
    # 查询所有节点,并将节点信息取出存放在data数组中
    for n in graph.nodes:
        # 将节点信息转化为json格式,否则中文会不显示
        nodesStr = json.dumps(graph.nodes[n], ensure_ascii=False)
        # 取出节点的name
        node_name = json.loads(nodesStr)['name']
        # 构造字典,存储单个节点信息
        dict = {
            'name': node_name,
            'symbolSize': 50,
            'category': '对象'
        }
        # 将单个节点信息存放在data数组中
        data.append(dict)
    # 查询所有关系,并将所有的关系信息存放在links数组中
    rps = graph.relationships
    for r in rps:
        # 取出开始节点的name
        source = str(rps[r].start_node['name'])
        # 取出结束节点的name
        target = str(rps[r].end_node['name'])
        # 取出开始节点的结束节点之间的关系
        name = str(type(rps[r]).__name__)
        # 构造字典存储单个关系信息
        dict = {
            'source': source,
            'target': target,
            'name': name
        }
        # 将单个关系信息存放进links数组中
        links.append(dict)
    # 输出所有节点信息
    for item in data:
        print(item)
    # 输出所有关系信息
    for item in links:
        print(item)
    # 将所有的节点信息和关系信息存放在一个字典中
    neo4j_data = {
        'data': data,
        'links': links
    }
    neo4j_data = json.dumps(neo4j_data)
    return neo4j_data


def search_one(value):
    # 定义data数组存储节点信息
    data = []
    # 定义links数组存储关系信息
    links = []
    # 查询节点是否存在
    node = graph.run('MATCH(n:person{name:"' + value + '"}) return n').data()
    # 如果节点存在len(node)的值为1不存在的话len(node)的值为0
    if len(node):
        # 如果该节点存在将该节点存入data数组中
        # 构造字典存放节点信息
        dict = {
            'name': value,
            'symbolSize': 50,
            'category': '对象'
        }
        data.append(dict)
        # 查询与该节点有关的节点,无向,步长为1,并返回这些节点
        nodes = graph.run('MATCH(n:person{name:"' + value + '"})<-->(m:person) return m').data()
        # 查询该节点所涉及的所有relationship,无向,步长为1,并返回这些relationship
        reps = graph.run('MATCH(n:person{name:"' + value + '"})<-[rel]->(m:person) return rel').data()
        # 处理节点信息
        for n in nodes:
            # 将节点信息的格式转化为json
            node = json.dumps(n, ensure_ascii=False)
            node = json.loads(node)
            # 取出节点信息中person的name
            name = str(node['m']['name'])
            # 构造字典存放单个节点信息
            dict = {
                'name': name,
                'symbolSize': 50,
                'category': '对象'
            }
            # 将单个节点信息存储进data数组中
            data.append(dict)
        # 处理relationship
        for r in reps:
            source = str(r['rel'].start_node['name'])
            target = str(r['rel'].end_node['name'])
            name = str(type(r['rel']).__name__)
            dict = {
                'source': source,
                'target': target,
                'name': name
            }
            links.append(dict)
        # 构造字典存储data和links
        search_neo4j_data = {
            'data': data,
            'links': links
        }
        # 将dict转化为json格式
        search_neo4j_data = json.dumps(search_neo4j_data)
        return search_neo4j_data
    else:
        print("查无此人")
        return 0


def index(request):
    ctx = {}
    if request.method == 'POST':
        # 接收前端传过来的查询值
        node_name = request.POST.get('node')
        # 查询结果
        search_neo4j_data = search_one(node_name)
        # 未查询到该节点
        if search_neo4j_data == 0:
            ctx = {'title': '数据库中暂未添加该实体'}
            neo4j_data = search_all()
            return render(request, 'index.html', {'neo4j_data': neo4j_data, 'ctx': ctx})
        # 查询到了该节点
        else:
            neo4j_data = search_all()
            return render(request, 'index.html',
                          {'neo4j_data': neo4j_data, 'search_neo4j_data': search_neo4j_data, 'ctx': ctx})

    neo4j_data = search_all()
    return render(request, 'index.html', {'neo4j_data': neo4j_data, 'ctx': ctx})
前端
{% load static %}
<!DOCTYPE html>
<html lang="en">
<head>
    <meta charset="UTF-8">
    <title>Title</title>
    <script type="text/javascript" src="{% static 'echarts.min.js' %}"></script>
</head>
<body>
<div id="container" style="width: 800px;height: 700px;border: 2px solid black;float: left;margin-top: 50px;"></div>
<div style="width: 800px;height: 750px;float: right;margin-right: 10px;">
    <div style="width: 800px;height: 50px;border-top: 2px solid black;border-left: 2px solid black;border-right: 2px solid black">
        <form action="/" method="post">
            <input type="text" name="node" style="width: 250px;height: 20px; margin-top: 10px;margin-left: 20px;">
            <input type="submit" value="查询">
        </form>
    </div>
    {% if ctx %}
        <div style="width: 800px;height: 700px;border: 2px solid black;text-align: center;line-height: 704px;">
            <h1>该数据库中未添加该实体</h1>
        </div>
    {% endif %}
    {% if search_neo4j_data %}
        <div id="container_search" style="width: 800px;height: 700px;border: 2px solid black"></div>
    {% endif %}
</div>
<script type="text/javascript">
    {#查询所有#}
    var neo4j_data = [{{ neo4j_data|safe }}]
    var data1 = neo4j_data[0]['data']
    var links1 = neo4j_data[0]['links']
    console.log(data1)
    console.log(links1)
    var myChart1 = echarts.init(document.getElementById('container'));
    var categories1 = [{name: "对象"}, {name: "属性"}, {name: "实例"}];
    option1 = {
        // 图的标题
        title: {
            text: '三国人物关系图谱'
        },
        // 提示框的配置
        tooltip: {
            formatter: function (x) {
                return x.data.des;
            }
        },
        // 工具箱
        toolbox: {
            // 显示工具箱
            show: true,
            feature: {
                mark: {
                    show: true
                },
                // 还原
                restore: {
                    show: true
                },
                // 保存为图片
                saveAsImage: {
                    show: true
                }
            }
        },
        legend: [{
            // selectedMode: 'single',
            data: categories1.map(function (a) {
                return a.name;
            })
        }],
        series: [{
            type: 'graph', // 类型:关系图
            layout: 'force', //图的布局,类型为力导图
            symbolSize: 40, // 调整节点的大小
            roam: true, // 是否开启鼠标缩放和平移漫游。默认不开启。如果只想要开启缩放或者平移,可以设置成 'scale' 或者 'move'。设置成 true 为都开启
            edgeSymbol: ['circle', 'arrow'],
            edgeSymbolSize: [2, 10],
            edgeLabel: {
                normal: {
                    textStyle: {
                        fontSize: 20
                    }
                }
            },
            force: {
                repulsion: 2500,
                edgeLength: [10, 50]
            },
            draggable: true,
            lineStyle: {
                normal: {
                    width: 2,
                    color: '#4b565b',
                }
            },
            edgeLabel: {
                normal: {
                    show: true,
                    formatter: function (x) {
                        return x.data.name;
                    }
                }
            },
            label: {
                normal: {
                    show: true,
                    textStyle: {}
                }
            },

            // 数据
            data: data1,
            links: links1,
            categories: categories1,
        }]
    };
    myChart1.setOption(option1);

    {#查询单个#}
    var search_neo4j_data=[{{ search_neo4j_data|safe }}]
    var data2=search_neo4j_data[0]['data']
    var links2=search_neo4j_data[0]['links']
    console.log(data2)
    console.log(links2)
    var myChart2 = echarts.init(document.getElementById('container_search'));
    var categories2 = [{name: "对象"}, {name: "属性"}, {name: "实例"}];
    option2 = {
        // 图的标题
        title: {
            text: '查询人物关系图谱'
        },
        // 提示框的配置
        tooltip: {
            formatter: function (x) {
                return x.data.des;
            }
        },
        // 工具箱
        toolbox: {
            // 显示工具箱
            show: true,
            feature: {
                mark: {
                    show: true
                },
                // 还原
                restore: {
                    show: true
                },
                // 保存为图片
                saveAsImage: {
                    show: true
                }
            }
        },
        legend: [{
            // selectedMode: 'single',
            data: categories2.map(function (a) {
                return a.name;
            })
        }],
        series: [{
            type: 'graph', // 类型:关系图
            layout: 'force', //图的布局,类型为力导图
            symbolSize: 40, // 调整节点的大小
            roam: true, // 是否开启鼠标缩放和平移漫游。默认不开启。如果只想要开启缩放或者平移,可以设置成 'scale' 或者 'move'。设置成 true 为都开启
            edgeSymbol: ['circle', 'arrow'],
            edgeSymbolSize: [2, 10],
            edgeLabel: {
                normal: {
                    textStyle: {
                        fontSize: 20
                    }
                }
            },
            force: {
                repulsion: 2500,
                edgeLength: [10, 50]
            },
            draggable: true,
            lineStyle: {
                normal: {
                    width: 2,
                    color: '#4b565b',
                }
            },
            edgeLabel: {
                normal: {
                    show: true,
                    formatter: function (x) {
                        return x.data.name;
                    }
                }
            },
            label: {
                normal: {
                    show: true,
                    textStyle: {}
                }
            },

            // 数据
            data: data2,
            links: links1,
            categories: categories2,
        }]
    };
    myChart2.setOption(option2);

</script>
</body>
</html>
效果
此时你会发现,同样是查询孙权这里的图谱和上面三当中的图谱不同即
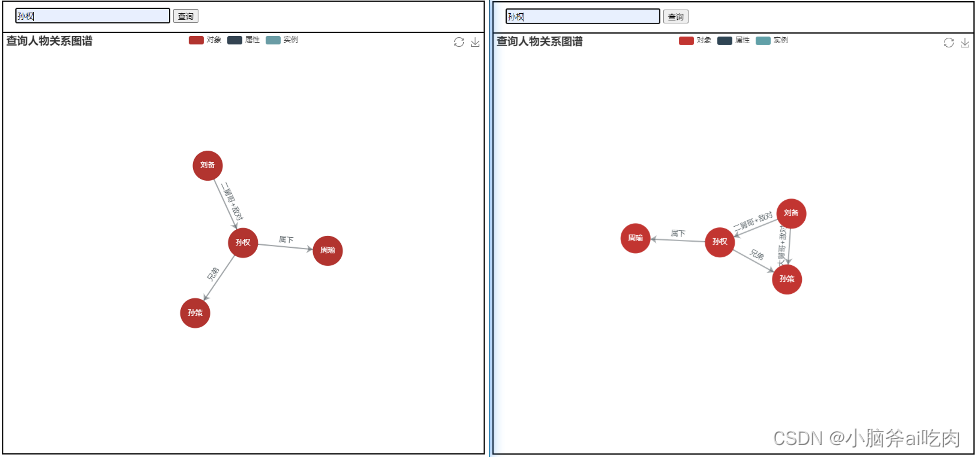
此处的不同是因为在绘制查询到的节点与所关联的节点时所使用的links的关系,即此处。
links1中存储了所有节点的关系,所以在绘制知识图谱时不仅会绘制孙权和他的下一级节点的关系,还会绘制下一级节点它们之间的关系。而links2中只存储了孙权和下一级节点之间的关系,所以在绘制时只会绘制孙权和下一级节点的关系,具体该用哪个可根据需求决定。
项目链接:https://github.com/Sjyzheishuai/Neo4j-visualization
结语
我觉得应该还是存在更加快速简便的方法可以实现neo4j的可视化,至少在数据处理这里这一块应该会有更加简单的方法,而不是像我采用的方法将查询结果一个个取出来重新写入字典再存储进数组,经过格式转换成json格式在传给前端。

为开发者提供学习成长、分享交流、生态实践、资源工具等服务,帮助开发者快速成长。
更多推荐


 38
38 0
0- 0


 已为社区贡献3条内容

所有评论(0)