Python二手房价格预测(二)——数据处理及数据可视化
Python二手房价格预测(二)——数据处理及数据可视化,对原始数据进行数据清洗,填充缺失数据,并进行可视化分析。
系列文章目录
数据获取部分:Python二手房价格预测(一)——数据获取
一、数据清洗
1、先导入需要的库:
import pandas as pd
import numpy as np
import matplotlib.pyplot as plt
import sys
import seaborn as sns
import warnings
import json
import pymongo
import re
warnings.filterwarnings("ignore")
plt.rcParams['font.sans-serif'] = ['SimHei']  # 用来正常显示中文标签
plt.rcParams['axes.unicode_minus'] = False  # 用来正常显示负号
pd.set_option('display.max_rows', 100,'display.max_columns', 1000,"display.max_colwidth",1000,'display.width',1000)
2、读取数据
data = pd.read_excel("链家沈阳二手房数据.xlsx", na_values=np.nan)

# 看一下数据维度
print(data.shape) # (2984, 31)

# 看一下数据的前五行
data.head()

# 输出数据的info
data.info()

'''
输出:
<class 'pandas.core.frame.DataFrame'>
RangeIndex: 2984 entries, 0 to 2983
Data columns (total 31 columns):
 #   Column  Non-Null Count  Dtype
---  ------  --------------  -----
 0   总价      2984 non-null   float64
 1   单位价格    2984 non-null   object
 2   楼房信息    2984 non-null   object
 3   小区      2984 non-null   object
 4   所属区县    2984 non-null   object
 5   房屋户型    2984 non-null   object
 6   所在楼层    2984 non-null   object
 7   建筑面积    2984 non-null   object
 8   户型结构    2967 non-null   object
 9   套内面积    2984 non-null   object
 10  建筑类型    2967 non-null   object
 11  房屋朝向    2984 non-null   object
 12  建筑结构    2984 non-null   object
 13  装修情况    2984 non-null   object
 14  梯户比例    2967 non-null   object
 15  供暖方式    2984 non-null   object
 16  配备电梯    2967 non-null   object
 17  挂牌时间    2984 non-null   object
 18  交易权属    2984 non-null   object
 19  上次交易    2984 non-null   object
 20  房屋用途    2984 non-null   object
 21  房屋年限    2984 non-null   object
 22  产权所属    2984 non-null   object
 23  抵押信息    2984 non-null   object
 24  房本备件    2984 non-null   object
 25  户型分间    2984 non-null   object
 26  小区简介    2984 non-null   object
 27  别墅类型    17 non-null     object
 28  用水类型    16 non-null     object
 29  用电类型    16 non-null     object
 30  燃气价格    13 non-null     object
dtypes: float64(1), object(30)
memory usage: 722.8+ KB
'''
3、数据处理
通过info可以看到数据的27、28、29、30列几乎全部为空值,因此我们先将这四列数据剔除。
data = data[data.columns[:-4]]

# 再看一下数据
data.head()

可以看到数据现在只有 总价 是为数值型数据,通过 data.describe() 也可以得到。因此,需要将一些 Object 类型数据转化为数值型数据。
data['单位价格'] = data['单位价格'].str[:-4]
data['单位价格'] = data['单位价格'].astype(float)

data['楼房信息'] = data['楼房信息'].str[:4]
data['楼房信息'].value_counts()
'''
输出:
未知年建    673
2019    187
2012    183
2018    175
2017    173
2015    171
2016    171
2014    150
2009    142
2010    140
2013    109
2011    102
2020    100
2008     99
2006     72
2007     67
2005     55
2000     43
2021     37
2004     35
1999     25
2003     20
1998     12
1996     10
1997      9
1995      6
2002      5
1990      3
2001      3
1994      3
1992      1
2090      1
2121      1
1987      1
Name: 楼房信息, dtype: int64

# 从楼房信息的输出结果可以看出,有673条样本为“未知年建”,因此这部分数据需要进一步处理,我们使用小区简介中的小区建造年份进行填补。
'''

# 定义填补函数
def fillBuildYear(df):
    if df['楼房信息'] == "未知年建":
        xiaoqu = json.loads(df['小区简介'].replace("'", '"'))
        return xiaoqu['小区建造年份'][:4]
    else:
        return df['楼房信息']

# 进行填补
data['楼房信息'] = data.apply(lambda x:fillBuildYear(x), axis=1)
# 再看一下
data['楼房信息'].value_counts()
'''
输出:
2012    224
2019    204
2017    194
2018    188
2015    183
2009    179
2014    176
2010    176
2016    172
2008    153
2000    127
2013    113
2011    106
2020    101
2006     98
2007     98
2005     86
2004     59
1999     48
2021     41
2003     36
1998     32
1995     28
1990     27
2002     26
2001     16
1996     16
1997     16
1988      8
1992      8
1987      6
1978      6
1980      6
1989      5
1994      4
1970      3
1985      2
1986      2
1955      1
2121      1
1993      1
1991      1
2090      1
1960      1
1983      1
1958      1
1900      1
1972      1
1979      1
Name: 楼房信息, dtype: int64
'''

# 转换一下类型
data['楼房信息'] = data['楼房信息'].astype(int)

# 然后看一下房屋户型,我们可以发现都是 x室x厅x厨x卫的格式,因此我们直接将其中的数字提取出来。
data['房屋户型_室'] = data['房屋户型'].str[0].astype(int)
data['房屋户型_厅'] = data['房屋户型'].str[2].astype(int)
data['房屋户型_厨'] = data['房屋户型'].str[4].astype(int)
data['房屋户型_卫'] = data['房屋户型'].str[6].astype(int)

# 所在楼层部分只有低中高楼层是确定的,后面的(共几层)无用,因此将低中高楼层提取替换
data['所在楼层'] = data['所在楼层'].str[:3]

# 然后将建筑面积的“㎡” 删掉
data['建筑面积'] = data['建筑面积'].str[:-1].astype(float)

# 然后我们看一下套内面积的数据分布情况
data['套内面积'].value_counts()
'''
输出:
暂无数据       2581
50㎡           5
129㎡          4
70㎡           4
73.66㎡        3
           ...
47.54㎡        1
88.56㎡        1
66.37㎡        1
64㎡           1
122.64㎡       1
Name: 套内面积, Length: 317, dtype: int64
'''
# 我们可以发现,大量数据是“暂无数据”,但我认为套内面积这个属性还比较重要,因此我们对它进行一个均值填充
# 取其他有数值的房子,计算其建筑面积与套内面积的差值,并在最后取平均,对于“暂无数据”的这些房子,我们用建筑面积减去均值
count = 0
areaDiff = 0
for i in range(data.shape[0]):
    if "㎡" in data.iloc[i]['套内面积']:
        # print(data.iloc[i]['建筑面积'], data.iloc[i]['套内面积'][:-1])
        areaDiff += data.iloc[i]['建筑面积'] - float(data.iloc[i]['套内面积'][:-1])
        count += 1
print(round(areaDiff,2), count, round(areaDiff/count, 2)) # 输出:6173.99 403 15.32
# 均值为15.32,因此我们进行填充
# 定义填充函数
def fillInsideArea(df):
    if "㎡" in df['套内面积']:
        return float(df['套内面积'][:-1])
    else:
        return (df['建筑面积'] - 15.32)

# 填充
data['套内面积'] = data.apply(lambda x:fillInsideArea(x), axis=1)

# 然后是梯户比例,查看数据可以发现,x梯xx户的形式,因此我们直接将这部分转化为数值的比例,用 户/梯
# 定义转化函数
def ratioTH(df, flag):
    CN_NUM = {'十': 10, '一': 1, '二': 2, '三': 3, '四': 4, '五': 5, '六': 6, '七': 7, '八': 8, '九': 9, '零': 0, '两': 2}
    if pd.isna(df['梯户比例']) or "" == df['梯户比例']:
        return 0

    strList = df['梯户比例'].split("梯")
    T = strList[0]
    H = strList[1]
    numTList = list(T)
    numHList = list(H)

    numTStr = '0'
    for i in range(len(numTList)):
        if numTList[i] in CN_NUM.keys():
            numTStr = str(int(numTStr) + CN_NUM[numTList[i]])

    numHStr = '0'
    for i in range(len(numHList)):
        if numHList[i] in CN_NUM.keys():
            numHStr = str(int(numHStr) + CN_NUM[numHList[i]])

    if flag == 1:
        return int(numTStr)
    elif flag == 2:
        return int(numHStr)
    else:
        return int(numHStr)/int(numTStr)

data['梯户比例_梯'] = data.apply(lambda x:ratioTH(x, 1), axis=1)
data['梯户比例_户'] = data.apply(lambda x:ratioTH(x, 2), axis=1)
data['梯户比例_比例'] = data.apply(lambda x:ratioTH(x, 3), axis=1)

# 查看一下转化后的结果
data[ ['梯户比例', '梯户比例_梯', '梯户比例_户', '梯户比例_比例'] ].head()
'''
输出:
	梯户比例	梯户比例_梯	梯户比例_户	梯户比例_比例
0	两梯两户		2			2			1.00
1	两梯四户		2			4			2.00
2	一梯两户		1			2			2.00
3	两梯三户		2			3			1.50
4	一梯两户		1			2			2.00
'''

# 可以填充的我们基本处理完了,再看一下data.info()
data.info()
'''
输出:
<class 'pandas.core.frame.DataFrame'>
RangeIndex: 2984 entries, 0 to 2983
Data columns (total 34 columns):
 #   Column   Non-Null Count  Dtype
---  ------   --------------  -----
 0   总价       2984 non-null   float64
 1   单位价格     2984 non-null   float64
 2   楼房信息     2984 non-null   int32
 3   小区       2984 non-null   object
 4   所属区县     2984 non-null   object
 5   房屋户型     2984 non-null   object
 6   所在楼层     2984 non-null   object
 7   建筑面积     2984 non-null   float64
 8   户型结构     2967 non-null   object
 9   套内面积     2984 non-null   float64
 10  建筑类型     2967 non-null   object
 11  房屋朝向     2984 non-null   object
 12  建筑结构     2984 non-null   object
 13  装修情况     2984 non-null   object
 14  梯户比例     2967 non-null   object
 15  供暖方式     2984 non-null   object
 16  配备电梯     2967 non-null   object
 17  挂牌时间     2984 non-null   object
 18  交易权属     2984 non-null   object
 19  上次交易     2984 non-null   object
 20  房屋用途     2984 non-null   object
 21  房屋年限     2984 non-null   object
 22  产权所属     2984 non-null   object
 23  抵押信息     2984 non-null   object
 24  房本备件     2984 non-null   object
 25  户型分间     2984 non-null   object
 26  小区简介     2984 non-null   object
 27  房屋户型_室   2984 non-null   int32
 28  房屋户型_厅   2984 non-null   int32
 29  房屋户型_厨   2984 non-null   int32
 30  房屋户型_卫   2984 non-null   int32
 31  梯户比例_梯   2984 non-null   int64
 32  梯户比例_户   2984 non-null   int64
 33  梯户比例_比例  2984 non-null   float64
dtypes: float64(5), int32(5), int64(2), object(22)
memory usage: 734.5+ KB
'''
# 我们发现,仍有四列['户型结构', '建筑类型', '梯户比例', '配备电梯'],有空值,其中'梯户比例'已处理,直接删除该列,其他三列看看数据分布
data.drop(['梯户比例'], axis=1, inplace=True)
fillColName = ['户型结构', '建筑类型', '配备电梯']
for c in fillColName:
    print(data[c].value_counts())

'''
输出:
平层      2742
跃层       112
错层        53
复式        53
暂无数据       7
Name: 户型结构, dtype: int64

板楼      2463
板塔结合     330
塔楼       107
暂无数据      63
平房         4
Name: 建筑类型, dtype: int64

有       2218
无        410
暂无数据     339
Name: 配备电梯, dtype: int64
'''

# 我们发现,均有暂无数据,那么空值就可以填充为“暂无数据”了
for c in fillColName:
    data[c].fillna("暂无数据", inplace=True)

# 看一下有哪些列为数值型数据
data.dtypes[ data.dtypes != 'object' ]
'''
输出:
总价         float64
单位价格       float64
楼房信息         int32
建筑面积       float64
套内面积       float64
房屋户型_室       int32
房屋户型_厅       int32
房屋户型_厨       int32
房屋户型_卫       int32
梯户比例_梯       int64
梯户比例_户       int64
梯户比例_比例    float64
'''

# 哪些列为Object型数据
data.dtypes[ data.dtypes == 'object' ]
'''
输出:
小区      object
所属区县    object
房屋户型    object
所在楼层    object
户型结构    object
建筑类型    object
房屋朝向    object
建筑结构    object
装修情况    object
供暖方式    object
配备电梯    object
挂牌时间    object
交易权属    object
上次交易    object
房屋用途    object
房屋年限    object
产权所属    object
抵押信息    object
房本备件    object
户型分间    object
小区简介    object
'''
# 类型为Object的数据我们暂时先不用处理了,后面会做独热编码处理
二、数据可视化
1、沈阳市各区域二手房数量分布
areaName = list(data['所属区县'].value_counts().index)
areaCountList = list(data['所属区县'].value_counts())

plt.figure(figsize=(10,6))
plt.title("沈阳市各区域二手房数量分布")
g = sns.barplot(areaName, areaCountList, alpha=0.8, color="royalblue",edgecolor="k")
plt.xlabel("\n区域")
plt.ylabel("计\n数", rotation = 'horizontal', verticalalignment = 'center', horizontalalignment = 'right')
for a,b in zip(range(len(areaName)),areaCountList):   #柱子上的数字显示
    plt.text(a,b+3,'%.f' % b,ha='center',va='bottom',fontsize=10)
plt.show()

2、沈阳市二手房单位价格直方图
plt.figure(figsize=(10,6))
plt.title("沈阳市二手房单位价格直方图")
sns.distplot(data['单位价格'], color="royalblue",bins=20, kde=True, hist_kws={"edgecolor":"w"})
plt.xlabel("\n单位价格")
plt.ylabel("频\n率", rotation = 'horizontal', verticalalignment = 'center', horizontalalignment = 'right')
yticks_list = ['0', '100', '200', '300', '400', '500', '600']
plt.yticks(np.arange(0.0, 0.00014, 0.00002), yticks_list)
plt.xlim(0,60000)
plt.show()

3、沈阳市二手房总价直方图
plt.figure(figsize=(10,6))
plt.title("沈阳市二手房总价直方图")
sns.distplot(data['总价'], color="royalblue",bins=50, kde=False, hist_kws={"edgecolor":"w"})
plt.xlabel("\n总价")
plt.ylabel("频\n率", rotation = 'horizontal', verticalalignment = 'center', horizontalalignment = 'right')
# yticks_list = ['0', '100', '200', '300', '400', '500', '600']
# plt.yticks(np.arange(0.0, 0.00014, 0.00002), yticks_list)
plt.xlim(0,500)
plt.show()

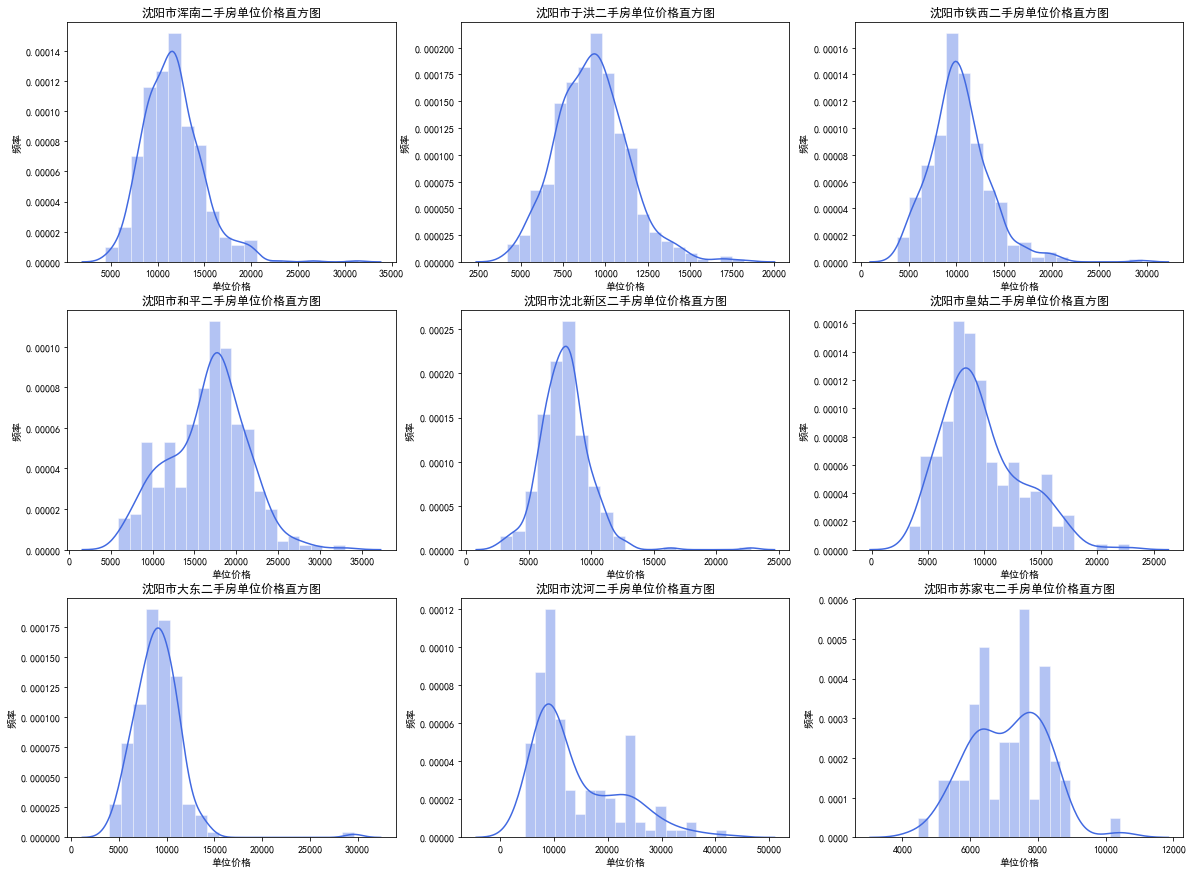
4、沈阳市各区县二手房单位价格直方图
plt.figure(figsize=(20,15))
for i in range(len(areaName)):
    cur_data = data[ data['所属区县'] == areaName[i] ]
    plt.subplot(3,3,i+1)
    plt.title("沈阳市" + areaName[i] + "二手房单位价格直方图")
    sns.distplot(cur_data['单位价格'], color="royalblue",bins=20, kde=True, hist_kws={"edgecolor":"w"})
    plt.xlabel("单位价格")
    plt.ylabel("频率")
plt.show()

5、沈阳市各区县二手房总价直方图
plt.figure(figsize=(20,15))
for i in range(len(areaName)):
    cur_data = data[ data['所属区县'] == areaName[i] ]
    plt.subplot(3,3,i+1)
    plt.title("沈阳市" + areaName[i] + "二手房总价直方图")
    sns.distplot(cur_data['总价'], color="royalblue",bins=20, kde=True, hist_kws={"edgecolor":"w"})
    plt.xlabel("总价")
    plt.ylabel("频率")
plt.show()

6、沈阳市二手房户型统计图
huxingName = list(data['房屋户型'].value_counts().index)
huxingCountList = list(data['房屋户型'].value_counts())
# 户型数量较少的合并为其他户型
otherCount = sum(huxingCountList[12:])
huxingName = huxingName[:12]
huxingCountList = huxingCountList[:12]
huxingName.append("其他户型")
huxingCountList.append(otherCount)

plt.figure(figsize=(10,6))
plt.title("沈阳市二手房户型统计图")
g = sns.barplot(huxingName, huxingCountList, alpha=0.8, color="royalblue",edgecolor="k",hatch="..")
plt.xlabel("\n户型")
plt.ylabel("计\n数", rotation = 'horizontal', verticalalignment = 'center', horizontalalignment = 'right')
for a,b in zip(range(len(huxingName)),huxingCountList):   #柱子上的数字显示
    plt.text(a,b+3,'%.f' % b,ha='center',va='bottom',fontsize=10);
plt.xticks(rotation = 45)
plt.show()

7、沈阳市二手房建筑面积直方图
plt.figure(figsize=(10,6))
plt.title("沈阳市二手房建筑面积直方图")
sns.distplot(data['建筑面积'], color="royalblue",bins=25, kde=False, hist_kws={"edgecolor":"w"})
plt.xlabel("\n房屋面积")
plt.ylabel("频\n率", rotation = 'horizontal', verticalalignment = 'center', horizontalalignment = 'right')
plt.xlim(0,400)
plt.show()

8、沈阳市二手房面积-单位价格散点图
plt.figure(figsize=(10,6))
plt.title("沈阳市二手房面积-单位价格散点图")
plt.scatter(data['建筑面积'], data['单位价格'],color="royalblue")
plt.xlabel("\n房屋面积")
plt.ylabel("单位\n价格", rotation = 'horizontal', verticalalignment = 'center', horizontalalignment = 'right')
plt.show()

9、沈阳市二手房面积-总价散点图
plt.figure(figsize=(10,6))
plt.title("沈阳市二手房面积-总价散点图")
plt.scatter(data['建筑面积'], data['总价'],color="royalblue")
plt.xlabel("\n房屋面积")
plt.ylabel("总\n价", rotation = 'horizontal', verticalalignment = 'center', horizontalalignment = 'right')
plt.show()

10、沈阳市二手房楼层-单位价格箱线图
louceng = [list(data[ data['所在楼层'] == "低楼层" ]["单位价格"]),
           list(data[ data['所在楼层'] == "中楼层" ]["单位价格"]),
           list(data[ data['所在楼层'] == "高楼层" ]["单位价格"])]

plt.figure(figsize=(10,6))
plt.title("沈阳市二手房楼层-单位价格箱线图")
dd = plt.boxplot(louceng, labels = ['低楼层','中楼层','高楼层'],patch_artist=True,boxprops={'facecolor':'cornflowerblue'})
plt.xlabel("\n所在楼层")
plt.ylabel("单位价格", rotation = 'horizontal', verticalalignment = 'center', horizontalalignment = 'right')
plt.show()

11、沈阳市二手房楼层-总价箱线图
louceng1 = [list(data[ data['所在楼层'] == "低楼层" ]["总价"]),
           list(data[ data['所在楼层'] == "中楼层" ]["总价"]),
           list(data[ data['所在楼层'] == "高楼层" ]["总价"])]

plt.figure(figsize=(10,6))
plt.title("沈阳市二手房楼层-总价箱线图")
dd = plt.boxplot(louceng1, labels = ['低楼层','中楼层','高楼层'],patch_artist=True,boxprops={'facecolor':'cornflowerblue'})
plt.xlabel("\n所在楼层")
plt.ylabel("总价", rotation = 'horizontal', verticalalignment = 'center', horizontalalignment = 'right')
plt.show()

12、沈阳市二手房装修-单位价格箱线图
zhuangxiu = [list(data[ data['装修情况'] == "精装" ]["单位价格"]),
           list(data[ data['装修情况'] == "简装" ]["单位价格"]),
           list(data[ data['装修情况'] == "毛坯" ]["单位价格"]),
           list(data[ data['装修情况'] == "其他" ]["单位价格"])]

plt.figure(figsize=(10,6))
plt.title("沈阳市二手房装修-单位价格箱线图")
dd = plt.boxplot(zhuangxiu, labels = [' 精装', ' 简装', ' 毛坯',' 其他'],patch_artist=True,boxprops={'facecolor':'cornflowerblue'})
plt.xlabel("\n装修")
plt.ylabel("单位价格", rotation = 'horizontal', verticalalignment = 'center', horizontalalignment = 'right')
plt.show()

13、沈阳市二手房装修-总价箱线图
zhuangxiu1 = [list(data[ data['装修情况'] == "精装" ]["总价"]),
           list(data[ data['装修情况'] == "简装" ]["总价"]),
           list(data[ data['装修情况'] == "毛坯" ]["总价"]),
           list(data[ data['装修情况'] == "其他" ]["总价"])]

plt.figure(figsize=(10,6))
plt.title("沈阳市二手房装修-总价箱线图")
dd = plt.boxplot(zhuangxiu1, labels = [' 精装', ' 简装', ' 毛坯',' 其他'],patch_artist=True,boxprops={'facecolor':'cornflowerblue'})
plt.xlabel("\n装修")
plt.ylabel("总价", rotation = 'horizontal', verticalalignment = 'center', horizontalalignment = 'right')
plt.show()

14、沈阳市二手房朝向-单位价格箱线图
chaoxiang = []

for c in data['房屋朝向'].value_counts().index:
    chaoxiang.append(list(data[ data['房屋朝向'] == c ]["单位价格"]))

plt.figure(figsize=(15,10))
plt.title("沈阳市二手房朝向-单位价格箱线图")
dd = plt.boxplot(chaoxiang, labels = data['房屋朝向'].value_counts().index, patch_artist=True,boxprops={'facecolor':'cornflowerblue'})
plt.xlabel("朝向")
plt.ylabel("单位价格", rotation = 'horizontal', verticalalignment = 'center', horizontalalignment = 'right')
plt.xticks(rotation=90)
plt.show()

15、沈阳市二手房朝向-总价箱线图
chaoxiang1 = []

for c in data['房屋朝向'].value_counts().index:
    chaoxiang1.append(list(data[ data['房屋朝向'] == c ]["总价"]))

plt.figure(figsize=(15,10))
plt.title("沈阳市二手房朝向-总价箱线图")
dd = plt.boxplot(chaoxiang1, labels = data['房屋朝向'].value_counts().index, patch_artist=True,boxprops={'facecolor':'cornflowerblue'})
plt.xlabel("朝向")
plt.ylabel("总价", rotation = 'horizontal', verticalalignment = 'center', horizontalalignment = 'right')
plt.xticks(rotation=90)
plt.show()

16、沈阳市二手房所在楼层饼状图
plt.figure(figsize=(12,10))
plt.title("沈阳市二手房所在楼层饼状图")
louceng2 = data['所在楼层'].value_counts()
plt.pie(louceng2, labels = louceng2.index, autopct='%.2f%%', # 设置百分比的格式,这里保留一位小数
        pctdistance=0.8,  # 设置百分比标签与圆心的距离
        labeldistance = 1.1, # 设置教育水平标签与圆心的距离
        startangle = 180, # 设置饼图的初始角度
        counterclock = False, # 是否逆时针,这里设置为顺时针方向
        wedgeprops = {'linewidth': 1.5, 'edgecolor':'w'},# 设置饼图内外边界的属性值
        textprops = {'fontsize':12, 'color':'black'}, # 设置文本标签的属性值
       )
plt.show()

17、沈阳市各区域二手房单位价格折线图
meanValue = []
sumValue = []

for i in range(len(areaName)):
    cur_data = data[ data['所属区县'] == areaName[i] ]
    meanValue.append(round(cur_data['单位价格'].mean(),2))
    sumValue.append(round(cur_data['总价'].mean(),2))


plt.figure(figsize=(10,6))
plt.title("沈阳市各区域二手房单位价格折线图")
plt.plot(range(len(areaName)), meanValue, '--^', label="单位价格")
# 总价折线图
# plt.plot(range(len(areaName)), sumValue)
plt.xticks(range(len(areaName)), labels = areaName)
plt.legend()
plt.show()

18、相关系数热力图
corrColName = list(data.dtypes[ data.dtypes != 'object' ].index)
corrDf = data[corrColName]
data_corr = corrDf.corr()
price_corr = dict(data_corr.iloc[0])
price_corr = sorted(price_corr.items(), key=lambda x: abs(x[1]), reverse=True)
price_corr_cols = [ r[0] for r in price_corr ]
price_data = data_corr[price_corr_cols].loc[price_corr_cols]
plt.figure(figsize=(12, 8))
plt.title("相关系数热力图")
ax = sns.heatmap(price_data, linewidths=0.5, cmap='OrRd', cbar=True)
plt.show()

输出相关系数数值:
print(price_corr)
'''
输出:
[('总价', 1.0),
 ('单位价格', 0.8222981290702119),
 ('建筑面积', 0.7251709920087407),
 ('套内面积', 0.7204559353359031),
 ('房屋户型_卫', 0.6312862646749),
 ('房屋户型_室', 0.5902144343661491),
 ('房屋户型_厅', 0.39760899920810316),
 ('梯户比例_比例', -0.3133978158118177),
 ('梯户比例_户', -0.27384128491689264),
 ('楼房信息', 0.2288081405819666),
 ('梯户比例_梯', -0.06639533403491238),
 ('房屋户型_厨', 0.04939490040354267)]
'''
总结
对获取的原始二手房数据进行数据清洗,缺失数据填充,随后对数据进行可视化分析。完成了部分数值型数据的转换,同时还存在一些Object类型数据,这一部分数据后续可以进行独热编码处理。可视化的最后用相关系数分析绘制了热力图(这部分数据还可以进行扩充,原始数据中还有几个维度没有进行处理),可以进行下一步的特征选择,为后续的建模提供支撑。
下一部分将出一篇建模,采用常用的机器学习模型进行二手房价格预测baseline部分。

华为开发者空间,是为全球开发者打造的专属开发空间,汇聚了华为优质开发资源及工具,致力于让每一位开发者拥有一台云主机,基于华为根生态开发、创新。
更多推荐


 30
30 1
1- 0


 已为社区贡献4条内容

所有评论(0)