pandas之apply函数简介及用法详解
1.基本信息Pandas 的 apply() 方法是用来调用一个函数(Python method),让此函数对数据对象进行批量处理。Pandas 的很多对象都可以使用 apply() 来调用函数,如 Dataframe、Series、分组对象、各种时间序列等。2.语法结构apply() 使用时,通常放入一个 lambda 函数表达式、或一个函数作为操作运算,官方上给出DataFrame的 a
1.基本信息
Pandas 的 apply() 方法是用来调用一个函数(Python method),让此函数对数据对象进行批量处理。Pandas 的很多对象都可以使用 apply() 来调用函数,如 Dataframe、Series、分组对象、各种时间序列等。
2.语法结构
apply() 使用时,通常放入一个 lambda 函数表达式、或一个函数作为操作运算,官方上给出DataFrame的 apply() 用法:
DataFrame.apply(self, func, axis=0, raw=False, result_type=None, args=(), **kwargs)
参数:
func:函数或 lambda 表达式,应用于每行或者每列
axis:{0 or ‘index’, 1 or ‘columns’}, 默认为0
- 0 or ‘index’: 表示函数处理的是每一列
- 1 or ‘columns’: 表示函数处理的是每一行
raw:bool 类型,默认为 False;
- False ,表示把每一行或列作为 Series 传入函数中;
- True,表示接受的是 ndarray 数据类型;
result_type:{‘expand’, ‘reduce’, ‘broadcast’, None}, default None
These only act when
axis=1(columns):
- ‘expand’ : 列表式的结果将被转化为列。
- ‘reduce’ : 如果可能的话,返回一个 Series,而不是展开类似列表的结果。这与
expand相反。- ‘broadcast’ : 结果将被广播到
DataFrame的原始形状,原始索引和列将被保留。
args:func 的位置参数
**kwargs:要作为关键字参数传递给 func 的其他关键字参数,1.3.0 开始支持返回值:
- Series 或者 DataFrame:沿数据的给定轴应用 func 的结果
	Objects passed to the function are Series objects whose index is either the DataFrame's index (``axis=0``) or the DataFrame's columns(``axis=1``).
	传递给函数的对象是Series对象,其索引是DataFrame的索引(axis=0)或DataFrame的列(axis=1)。
	By default (``result_type=None``), the final return type is inferred from the return type of the applied function. Otherwise,it depends on the `result_type` argument.
	默认情况下( result_type=None),最终的返回类型是从应用函数的返回类型推断出来的。否则,它取决于' result_type '参数。
注:DataFrame与Series的区别与联系:
区别:
- series,只是一个一维结构,它由index和value组成。
- dataframe,是一个二维结构,除了拥有index和value之外,还拥有column。
联系:
- dataframe由多个series组成,无论是行还是列,单独拆分出来都是一个series。
3.使用案例
3.1 DataFrame使用apply
官方使用案例
import pandas as pd
import numpy as np

df = pd.DataFrame([[4, 9]] * 3, columns=['A', 'B'])
df
   A  B
0  4  9
1  4  9
2  4  9


# 使用numpy通用函数 (如 np.sqrt(df)),
df.apply(np.sqrt)
'''
     A    B
0  2.0  3.0
1  2.0  3.0
2  2.0  3.0
'''

# 使用聚合功能
df.apply(np.sum, axis=0)
'''
A    12
B    27
dtype: int64
'''

df.apply(np.sum, axis=1)
'''
0    13
1    13
2    13
dtype: int64
'''

# 在每行上返回类似列表的内容
df.apply(lambda x: [1, 2], axis=1)
'''
0    [1, 2]
1    [1, 2]
2    [1, 2]
dtype: object
'''

# result_type='expand' 将类似列表的结果扩展到数据的列
df.apply(lambda x: [1, 2], axis=1, result_type='expand')

'''
   0  1
0  1  2
1  1  2
2  1  2
'''

# 在函数中返回一个序列,生成的列名将是序列索引。
df.apply(lambda x: pd.Series([1, 2], index=['foo', 'bar']), axis=1)

'''
   foo  bar
0    1    2
1    1    2
2    1    2
'''

# result_type='broadcast' 将确保函数返回相同的形状结果
# 无论是 list-like 还是 scalar,并沿轴进行广播
# 生成的列名将是原始列名。
df.apply(lambda x: [1, 2], axis=1, result_type='broadcast')
'''
A  B
0  1  2
1  1  2
2  1  2
'''
其他案例:
import numpy as np
import pandas as pd

df = pd.DataFrame({'A': [1, 2, 3],
                   'B': [4, 5, 6],
                   'C': [7, 8, 9]},
                  index=['a', 'b', 'c'])
df
	A	B	C
a	1	4	7
b	2	5	8
c	3	6	9

# 对各列应用函数 axis=0
df.apply(lambda x: np.sum(x))
A     6
B    15
C    24
dtype: int64

# 对各行应用函数
df.apply(lambda x: np.sum(x), axis=1)
a    12
b    15
c    18
dtype: int64
3.2 Series使用apply
官网案例
s = pd.Series([20, 21, 12],index=['London', 'New York', 'Helsinki'])
s
'''
London      20
New York    21
Helsinki    12
dtype: int64
'''

# 定义函数并将其作为参数传递给 apply,求值平方化。
def square(x):
     return x ** 2

s.apply(square)
'''
London      400
New York    441
Helsinki    144
dtype: int64
'''

# 通过将匿名函数作为参数传递给 apply
s.apply(lambda x: x ** 2)
'''
London      400
New York    441
Helsinki    144
dtype: int64
'''

# 定义一个需要附加位置参数的自定义函数
# 并使用args关键字传递这些附加参数。
def subtract_custom_value(x, custom_value):
     return x - custom_value

s.apply(subtract_custom_value, args=(5,))
'''
London      15
New York    16
Helsinki     7
dtype: int64
'''

# 定义一个接受关键字参数并将这些参数传递
# 给 apply 的自定义函数。
def add_custom_values(x, **kwargs):
     for month in kwargs:
         x += kwargs[month]
     return x

s.apply(add_custom_values, june=30, july=20, august=25)
'''
London      95
New York    96
Helsinki    87
dtype: int64
'''

# 使用Numpy库中的函数
s.apply(np.log)
'''
London      2.995732
New York    3.044522
Helsinki    2.484907
dtype: float64
'''
3.3 其他案例
import pandas as pd

# 显示所有列
pd.set_option('display.max_columns', None)
# 显示所有行
pd.set_option('display.max_rows', None)
# 设置value的显示长度为100,默认为50
pd.set_option('max_colwidth', 100)
# 用来计算日期差的包
import datetime


def dataInterval(data1, data2):
    """
    Args:
    :param data1: datetime
    :param data2: datetime
    :return: delta days
    """
    d1 = datetime.datetime.strptime(data1, '%Y-%m-%d')
    d2 = datetime.datetime.strptime(data2, '%Y-%m-%d')
    delta = d1 - d2
    return delta.days


def getInterval(arrLike):
    """
    Args:
    :param arrLike: DataFrame
    :return: delta days
    """
    PublishedTime = arrLike['PublishedTime']
    ReceivedTime = arrLike['ReceivedTime']
    days = dataInterval(PublishedTime.strip(), ReceivedTime.strip())
    return days


def getInterval_new(arrLike, before, after):
    """
    Args:
    :param arrLike: DataFrame
    :param before: forward time
    :param after: backwar time
    :return: delta days
    """
    before = arrLike[before]
    after = arrLike[after]
    days = dataInterval(after.strip(), before.strip())
    return days
if __name__ == '__main__':
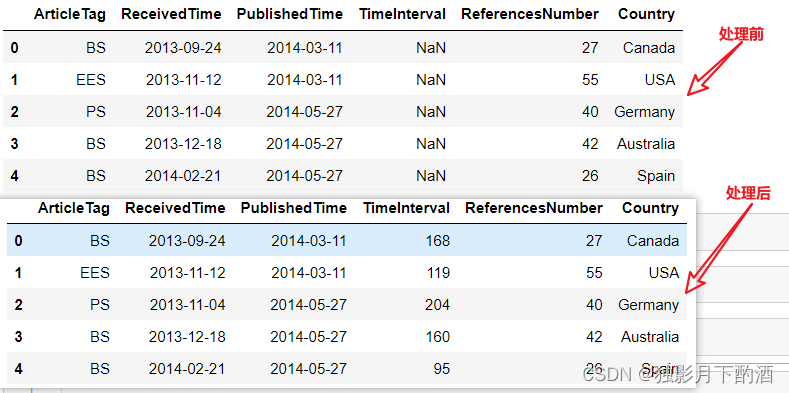
df = pd.read_excel('./data/NS_info.xls')
print(df.head())
# method 1
df['TimeInterval'] = df.apply(getInterval, axis=1)
print(df.head())
# method 2
df['TimeInterval'] = df.apply(getInterval_new,axis=1,
args=('ReceivedTime', 'PublishedTime'))
# method 3
df['TimeInterval'] = df.apply(getInterval_new,axis=1,
**{'before': 'ReceivedTime', 'after': 'PublishedTime'})
# method 4
df['TimeInterval'] = df.apply(getInterval_new,axis=1, before='ReceivedTime', after='PublishedTime')
4.总结
1.apply方法都是通过传入一个函数或者lambda表达式对数据进行批量处理
2.apply方法处理的都是一个Series对象
参考链接:
1.https://blog.csdn.net/missyougoon/article/details/83301712
2.https://blog.csdn.net/qq_19528953/article/details/79348929

为开发者提供学习成长、分享交流、生态实践、资源工具等服务,帮助开发者快速成长。
更多推荐


 55
55 0
0- 0


 已为社区贡献6条内容

所有评论(0)