Linux安装Prometheus、node_exporter、redis_exporter、Grafana监控运行状态
Grafana的安装卸载、Prometheus、node_exporter、mysql_exporter、redis_exporter安装
目录
将node_exporter通过systemd方式管理开机自启
将redis_exporter通过systemd方式管理开机自启
安装Prometheus
下载
官网下载地址 进入下载
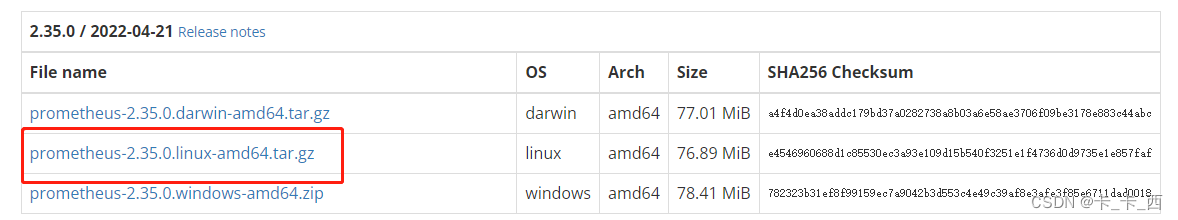
下载后上传到自己的安装目录,我上传到了 /usr/local/software 目录下。
解压
tar xvfz prometheus-*.tar.gz重命名一下解压包:
mv prometheus-2.35.0.linux-amd64 prometheus启动
进入prometheus目录
cd /usr/local/software/prometheus执行以下命令启动
./prometheus --config.file=prometheus.ymlprometheus 默认端口为9090,如果想切换一个端口,可以在启动的时候直接指定,如下:
./prometheus --config.file=prometheus.yml --web.listen-address=:9091 &访问
访问前先在阿里云安全组配置中开放prometheus默认端口9090。
访问 http://your ip:9090/graph 进入prometheus界面:

查看监控实例
点击Status-Targets,如下图:

可以看到现在只是对自身进行了监控。
将Prometheus通过systemd方式管理开机自启
创建一个data目录保存prometheus数据:
mkdir /usr/local/software/prometheus/data编写systemctl启动脚本:
cat > /usr/lib/systemd/system/prometheus.service <<EOF
[Unit]
Description=https://prometheus.io
[Service]
Restart=on-failure
ExecStart=/usr/local/software/prometheus/prometheus --storage.tsdb.path=/usr/local/software/prometheus/data --config.file=/usr/local/software/prometheus/prometheus.yml
[Install]
WantedBy=multi-user.target

EOF
添加开机启动项:
systemctl enable prometheus至此prometheus就完成了开机自启动配置!
安装node_exporter
下载
官网下载地址 进入下载

下载后上传到自己的安装目录,我上传到了 /usr/local/software 目录下。
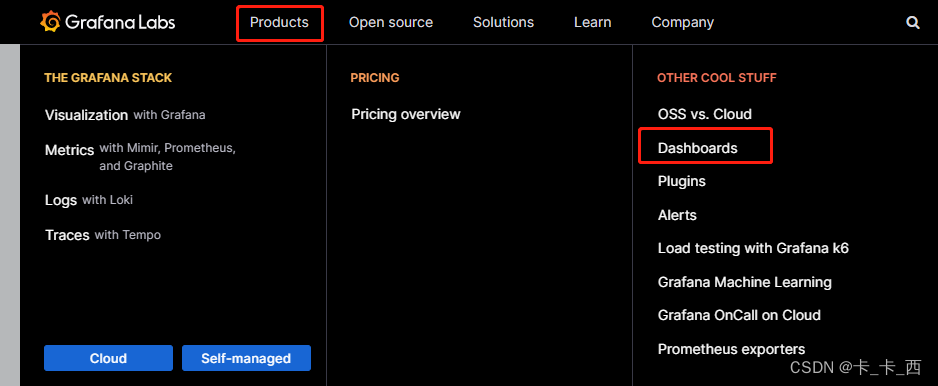
也可以到grafana官网去下载,可以选择自己喜欢的样式,之后所有的插件我都将在这下载。
地址:Grafana官网

解压
tar -xf node_exporter-1.3.1.linux-amd64.tar.gz重命名一下解压包:
mv node_exporter-1.3.1.linux-amd64 node_exporter配置prometheus监控
在prometheus.yml文件中追加监控node_exporter的配置,node_exporter的默认端口为9100:
编辑prometheus.yml:
vim /usr/local/software/prometheus/prometheus.yml添加如下配置:
  - job_name: "node"
    static_configs:
      - targets: ['localhost:9100']
此时完整的配置如下:
# my global config
global:
  scrape_interval: 15s # Set the scrape interval to every 15 seconds. Default is every 1 minute.
  evaluation_interval: 15s # Evaluate rules every 15 seconds. The default is every 1 minute.
  # scrape_timeout is set to the global default (10s).

# Alertmanager configuration
alerting:
  alertmanagers:
    - static_configs:
        - targets:
          # - alertmanager:9093

# Load rules once and periodically evaluate them according to the global 'evaluation_interval'.
rule_files:
  # - "first_rules.yml"
  # - "second_rules.yml"

# A scrape configuration containing exactly one endpoint to scrape:
# Here it's Prometheus itself.
scrape_configs:
  # The job name is added as a label `job=<job_name>` to any timeseries scraped from this config.
  - job_name: "prometheus"

    # metrics_path defaults to '/metrics'
    # scheme defaults to 'http'.

    static_configs:
      - targets: ["localhost:9090"]
  - job_name: "node"
    static_configs:
      - targets: ['localhost:9100']
启动
进入node_exporter安装目录启动:
cd /usr/local/software/node_exporter
./node_exporter
查看监控实例
配置完prometheus.yml后,需要重启prometheus,点击Status-Targets,如下图:

将node_exporter通过systemd方式管理开机自启
执行以下指令:
cat >/usr/lib/systemd/system/node_exporter.service <<EOF

[Unit]
Description=Prometheus node_exporter
[Service]
User=nobody
ExecStart=/usr/local/software/node_exporter/node_exporter --log.level=error
ExecStop=/usr/bin/killall node_exporter
[Install]
WantedBy=default.target

EOF
这时候你就可以通过 systemctl start node_exporter 命令来启动服务,不用先进入到安装目录下启动服务啦。
systemctl start node_exporter如果想添加开机自启,执行如下命令:
systemctl enable node_exporter禁用开机自启,执行如下命令:
systemctl disable node_exporter安装redis_exporter
下载安装
地址:Grafana官网
下载后上传到自己的安装目录,我上传到了 /usr/local/software 目录下。
解压
tar -zxvf redis_exporter-v0.30.0.linux-amd64.tar.gz配置prometheus监控
在prometheus.yml文件中追加监控redis_exporter的配置,redis_exporter的默认端口为9121:
编辑prometheus.yml:
vim /usr/local/software/prometheus/prometheus.yml添加如下配置:
  - job_name: "redis"
    static_configs:
      - targets: ['localhost:9121']
此时完整的配置如下:
# my global config
global:
  scrape_interval: 15s # Set the scrape interval to every 15 seconds. Default is every 1 minute.
  evaluation_interval: 15s # Evaluate rules every 15 seconds. The default is every 1 minute.
  # scrape_timeout is set to the global default (10s).

# Alertmanager configuration
alerting:
  alertmanagers:
    - static_configs:
        - targets:
          # - alertmanager:9093

# Load rules once and periodically evaluate them according to the global 'evaluation_interval'.
rule_files:
  # - "first_rules.yml"
  # - "second_rules.yml"

# A scrape configuration containing exactly one endpoint to scrape:
# Here it's Prometheus itself.
scrape_configs:
  # The job name is added as a label `job=<job_name>` to any timeseries scraped from this config.
  - job_name: "prometheus"

    # metrics_path defaults to '/metrics'
    # scheme defaults to 'http'.

    static_configs:
      - targets: ["localhost:9090"]
  - job_name: "node"
    static_configs:
      - targets: ['localhost:9100']
  - job_name: "redis"
    static_configs:
      - targets: ['localhost:9121']
启动
在当前目录(/usr/local/software)目录启动:
./redis_exporter redis//127.0.0.1:6379 &将redis_exporter通过systemd方式管理开机自启
执行以下指令:
cat /usr/lib/systemd/system/redis_exporter.service <<EOF

[Unit]
Description=redis_exporter
After=network.target
[Service]
Type=simple
User=prometheus
ExecStart=/usr/local/software/redis_exporter -redis.addr localhost:6379
Restart=on-failure
[Install]
WantedBy=multi-user.target

EOF
这时候你就可以通过 systemctl start redis_exporter 命令来启动服务,不用先进入到安装目录下启动服务啦。
安装Grafana
下载安装
进入官网,下载对应的版本,官网下载地址 进入redis下载

下载:
wget https://dl.grafana.com/enterprise/release/grafana-enterprise-8.5.2-1.x86_64.rpm安装:
yum install grafana-enterprise-8.5.2-1.x86_64.rpm配置
grafana的配置文件在 /etc/grafana/grafana.ini 文件中进行配置,可以更改默认管理员密码、http 端口、grafana 数据库(sqlite3、mysql、postgres)等选项。
启动
systemctl start grafana-server访问
访问前先在阿里云安全组配置中开放grafana默认端口3000。
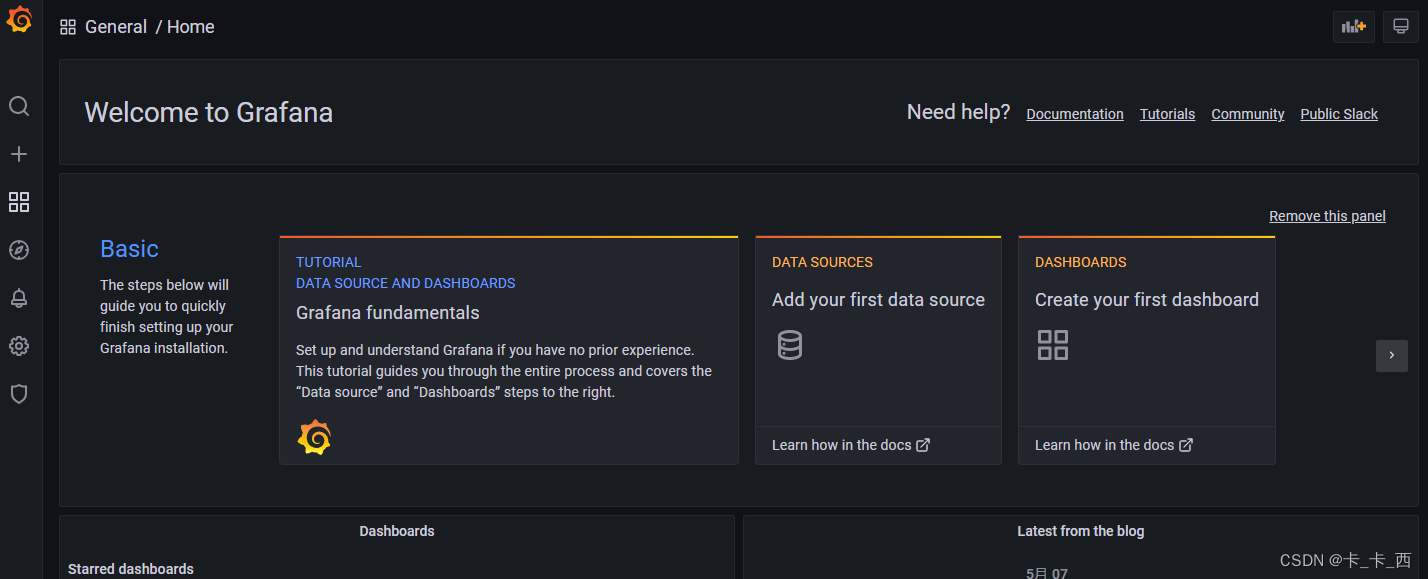
访问 http://your ip:3000/graph 进入grafana界面:
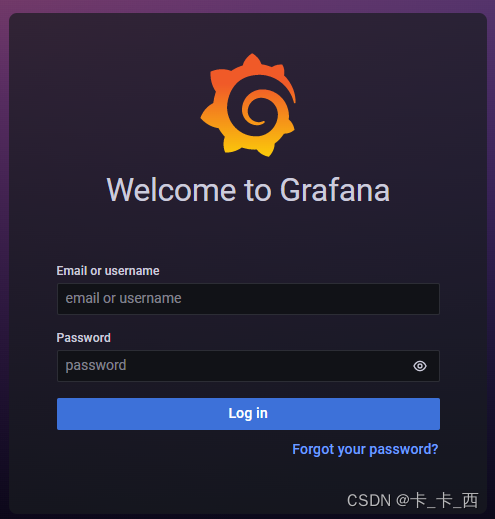
默认登录用户名密码都为admin,使用它们登录的时候会提示让你设置新密码,如果不想设置可以点击skip跳过。

登录后界面如下:
卸载
使用yum安装完程序包之后,程序的名字跟安装包的名字不一样,卸载时需要先查看要卸载程序的实际名字,再进行卸载。
查看要卸载程序的名字:
yum list installed我在列表中找到如下程序,截图如下:
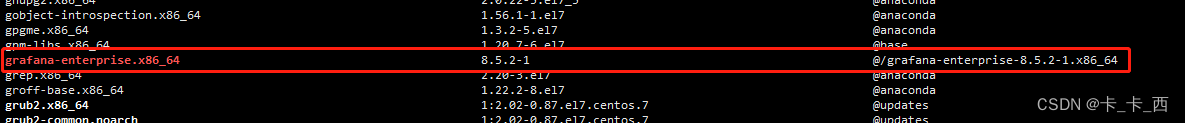
使用如下命令进行卸载:
yum remove grafana-enterprise.x86_64配置Grafana从Prometheus拉取监控数据
配置prometheus数据源
点击 DATA SOURCES 去配置数据源
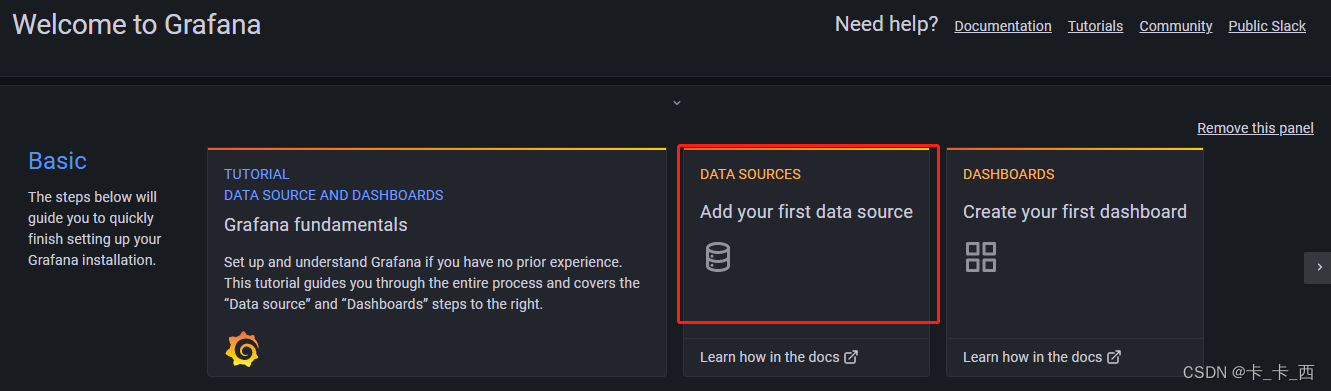
添加数据源的页面有很多可选数据源,我们选择prometheus:
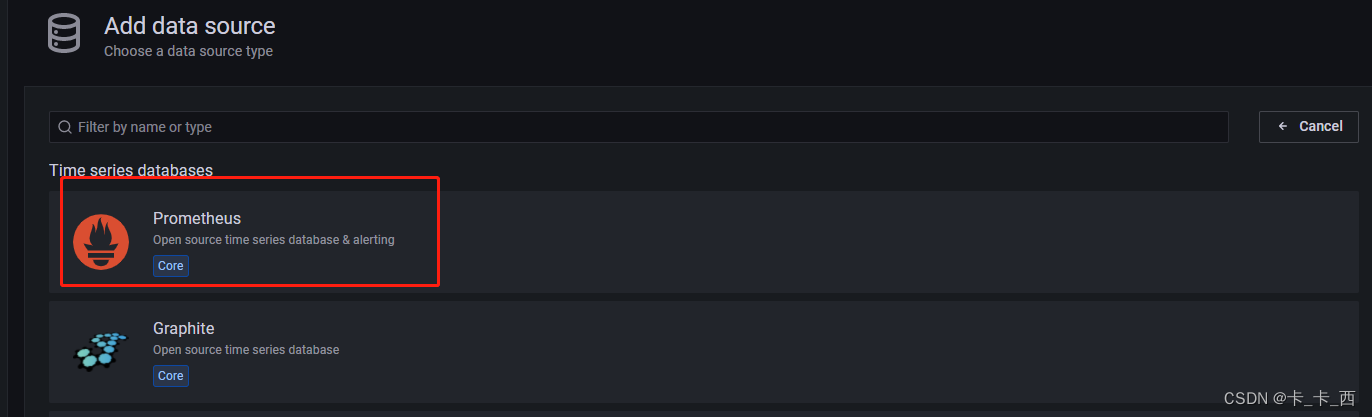 这里面有很多可设置的选项,这里我只是改了下名字,和配置了一下prometheus的url:
http://localhost:9090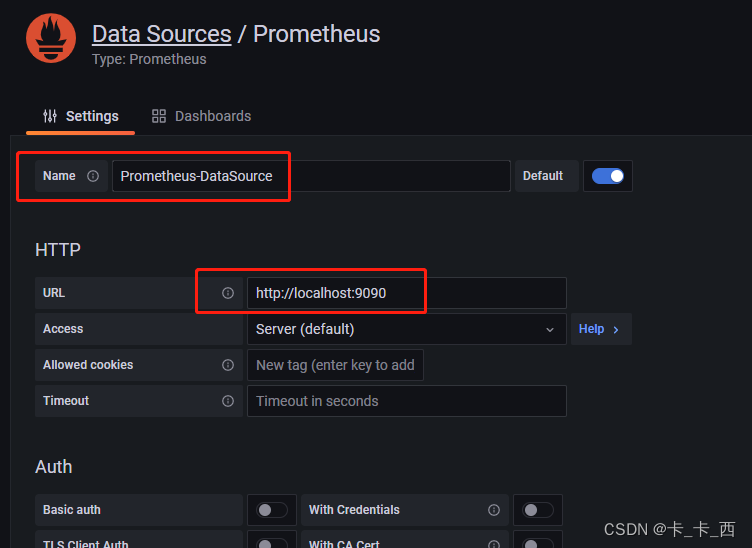
更多的配置具体使用的时候再进行配置,配置完成后点击下方的 Save & test ,当出现 Data source is working的提示时说明已经配置好了。

配置DASHBOARDS - 创建panel方式
接下来配置dashboards,之前配置过得DATA SOURCES 此时已经提示 COMPLETE ,并且颜色也变化了。
 我们进入页面后,点击Add a new panel进入设置监控的页面,你也可以通过侧边栏进入:


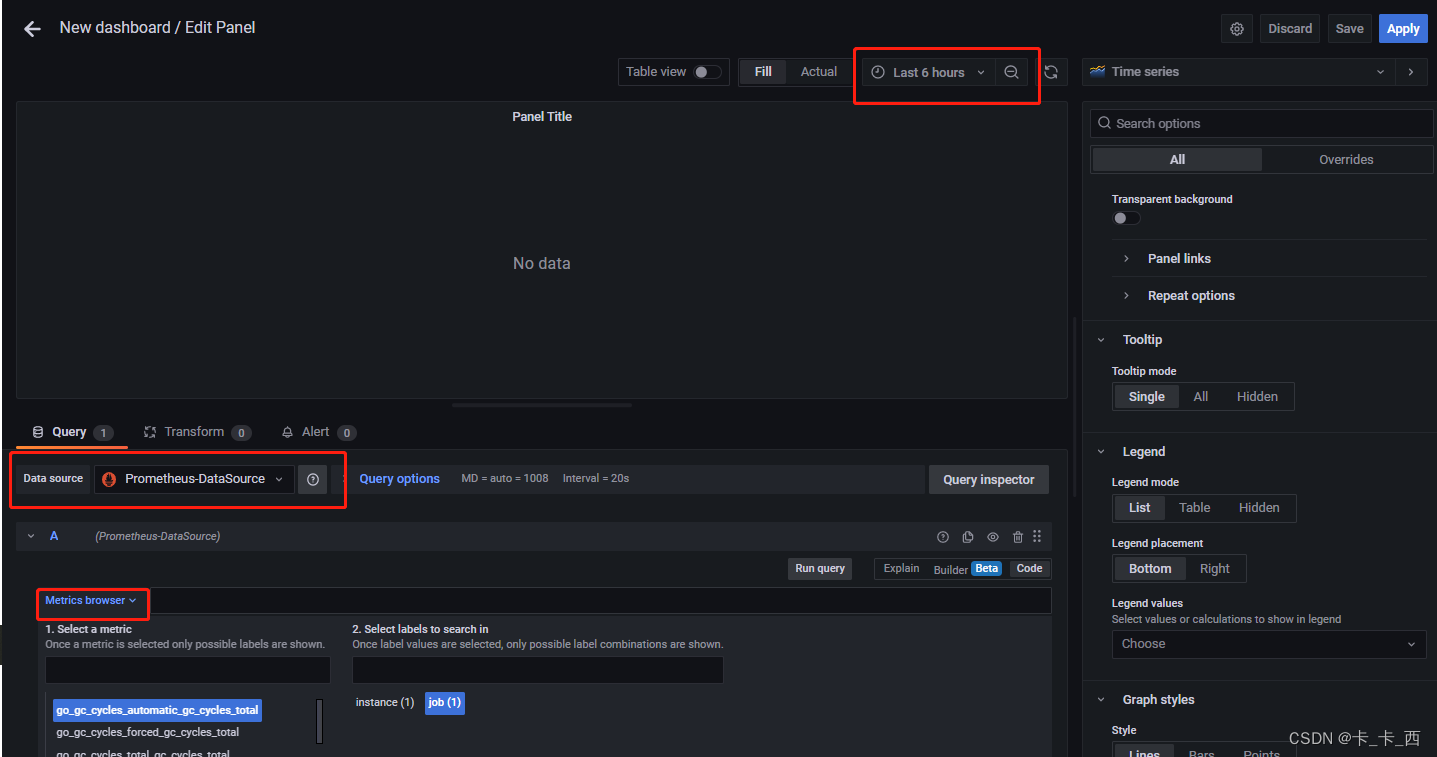
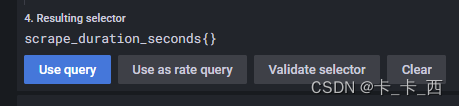
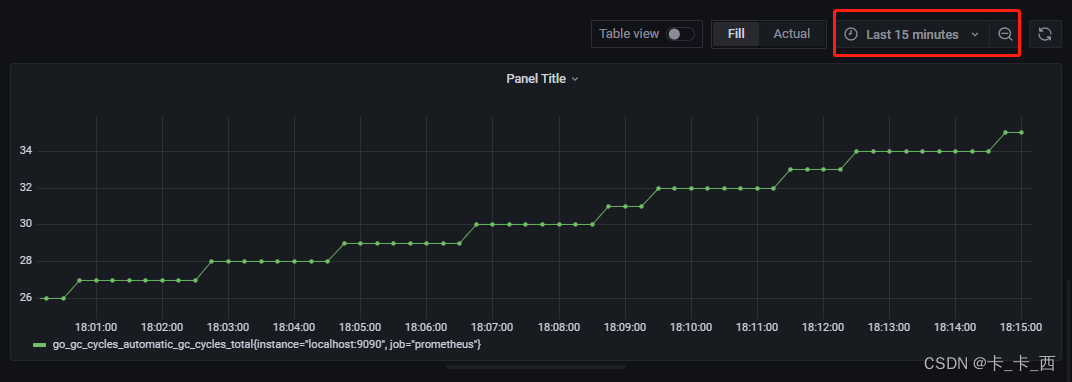
数据源我们选择前面配置的Prometheus-DataSource, Metrics browser选择想要监控的指标参数,然后点击下方的 Use query 即可添加监控图像,并可以选择显示多长时间的监控图像。
这种方式每次只能添加一项监控指标,如果想要添加的指标太多就太麻烦了,通常我们使用下面这种方式添加监控。
配置DASHBOARDS - import方式
引入dashboards
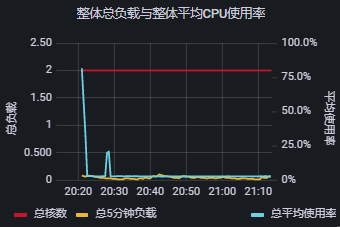
比如,我们想监控服务器的CPU、内存、磁盘等信息,我们可以从官网找到 node_export 组件并导入。
官网地址 进入

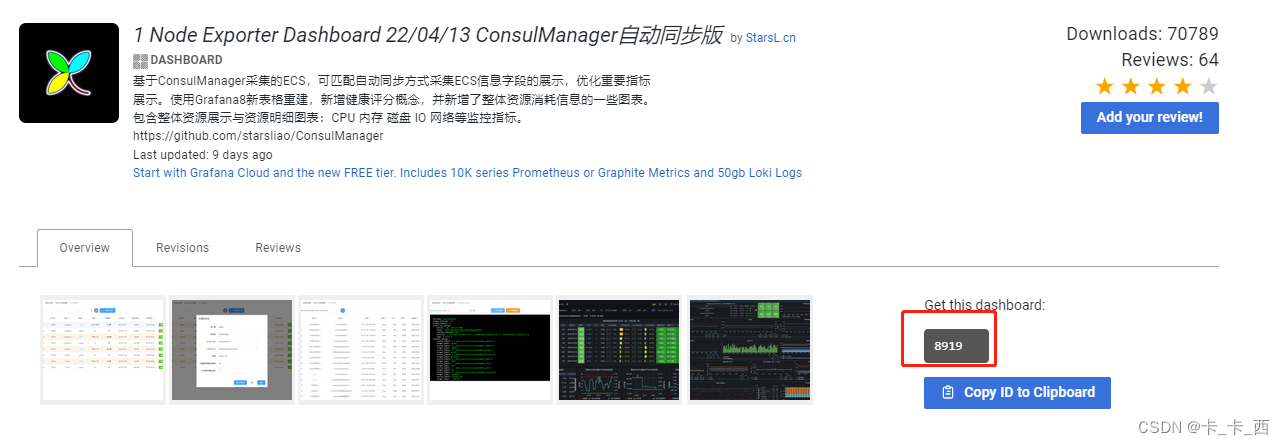
配置node-exporter


如上,需要填入以上信息,其中8919可以直接在Node Exporter Full 页面复制,点击load进入下一步配置,配置后点击import即可。
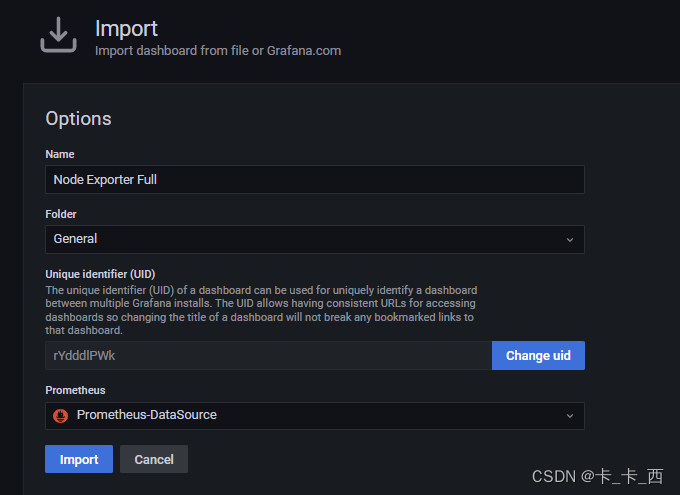
此时页面如下:
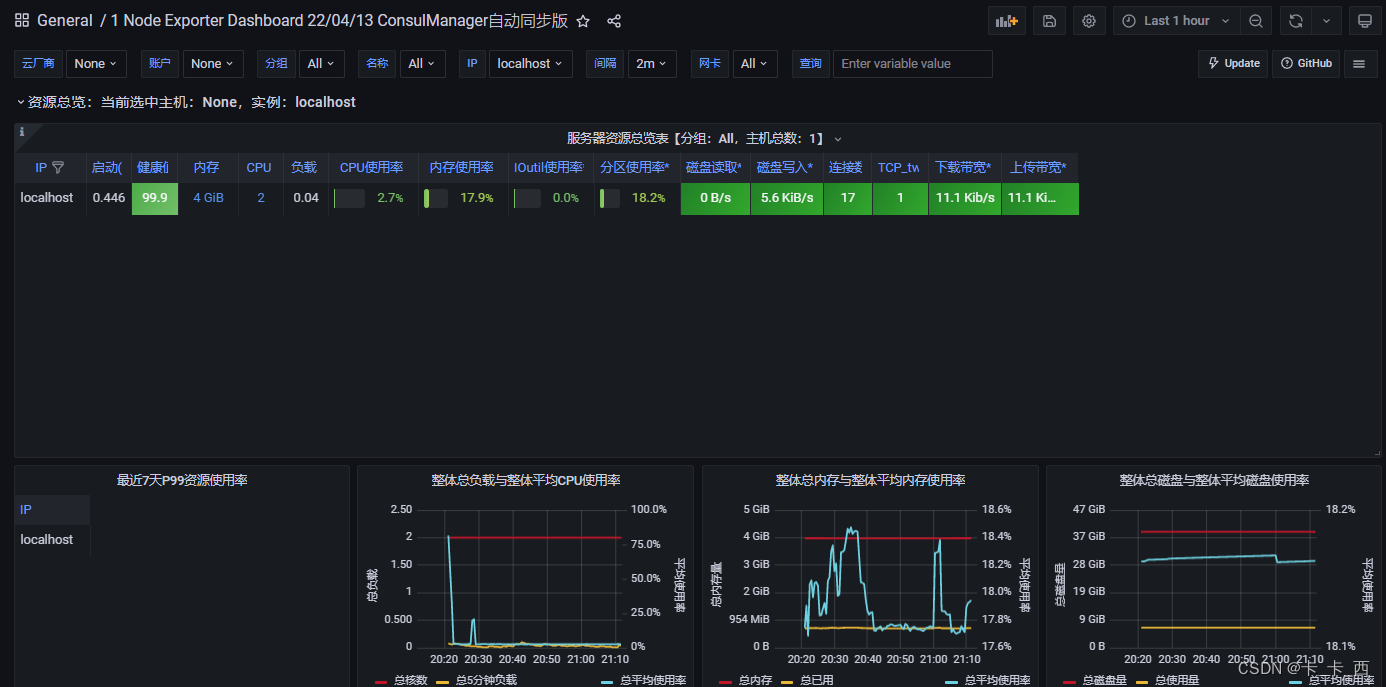
引入插件后,都可以使用import方式引入监控。

为开发者提供学习成长、分享交流、生态实践、资源工具等服务,帮助开发者快速成长。
更多推荐


 2
2 0
0- 0


 已为社区贡献11条内容

所有评论(0)