filebeat日志采集的一次流程记录
背景:公司采购的一套第三方应用,部署在阿里云上,因为第三方有权限登录该服务器,所以不能将该服务器与公司的内网生产服务器进行打通 ,不能直接接入公司内网的已有的日志采集功能中,现在要想办法将该应用的日志采集到公司的日志采集中。出于安全原因,公司的内网服务器的端口不能向阿里云服务器开放,google查了下文档,可以filebeat可以安装output.http插件,支持http请求的输出,公司的应用
背景:公司采购的一套第三方应用,部署在阿里云上,因为第三方有权限登录该服务器,所以不能将该服务器与公司的内网生产服务器进行打通 ,不能直接接入公司内网的已有的日志采集功能中,现在要想办法将该应用的日志采集到公司的日志采集中。
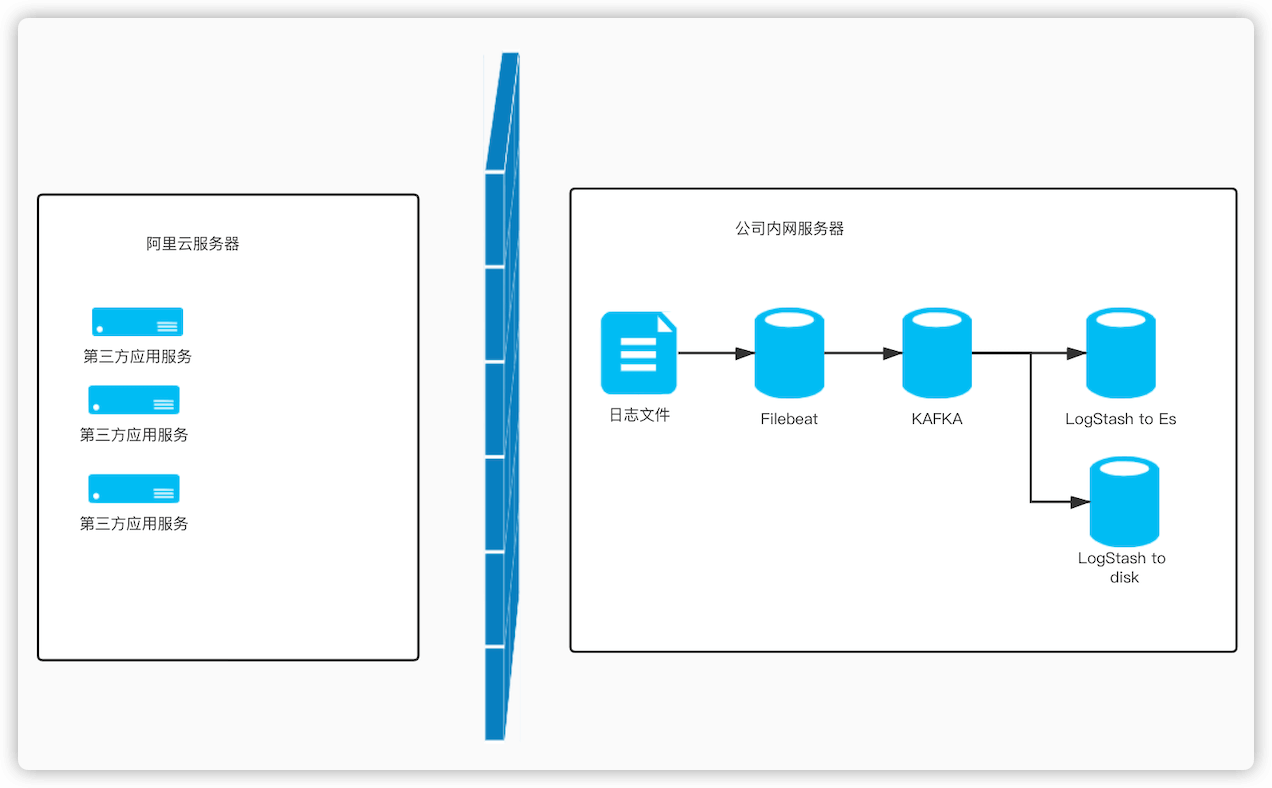
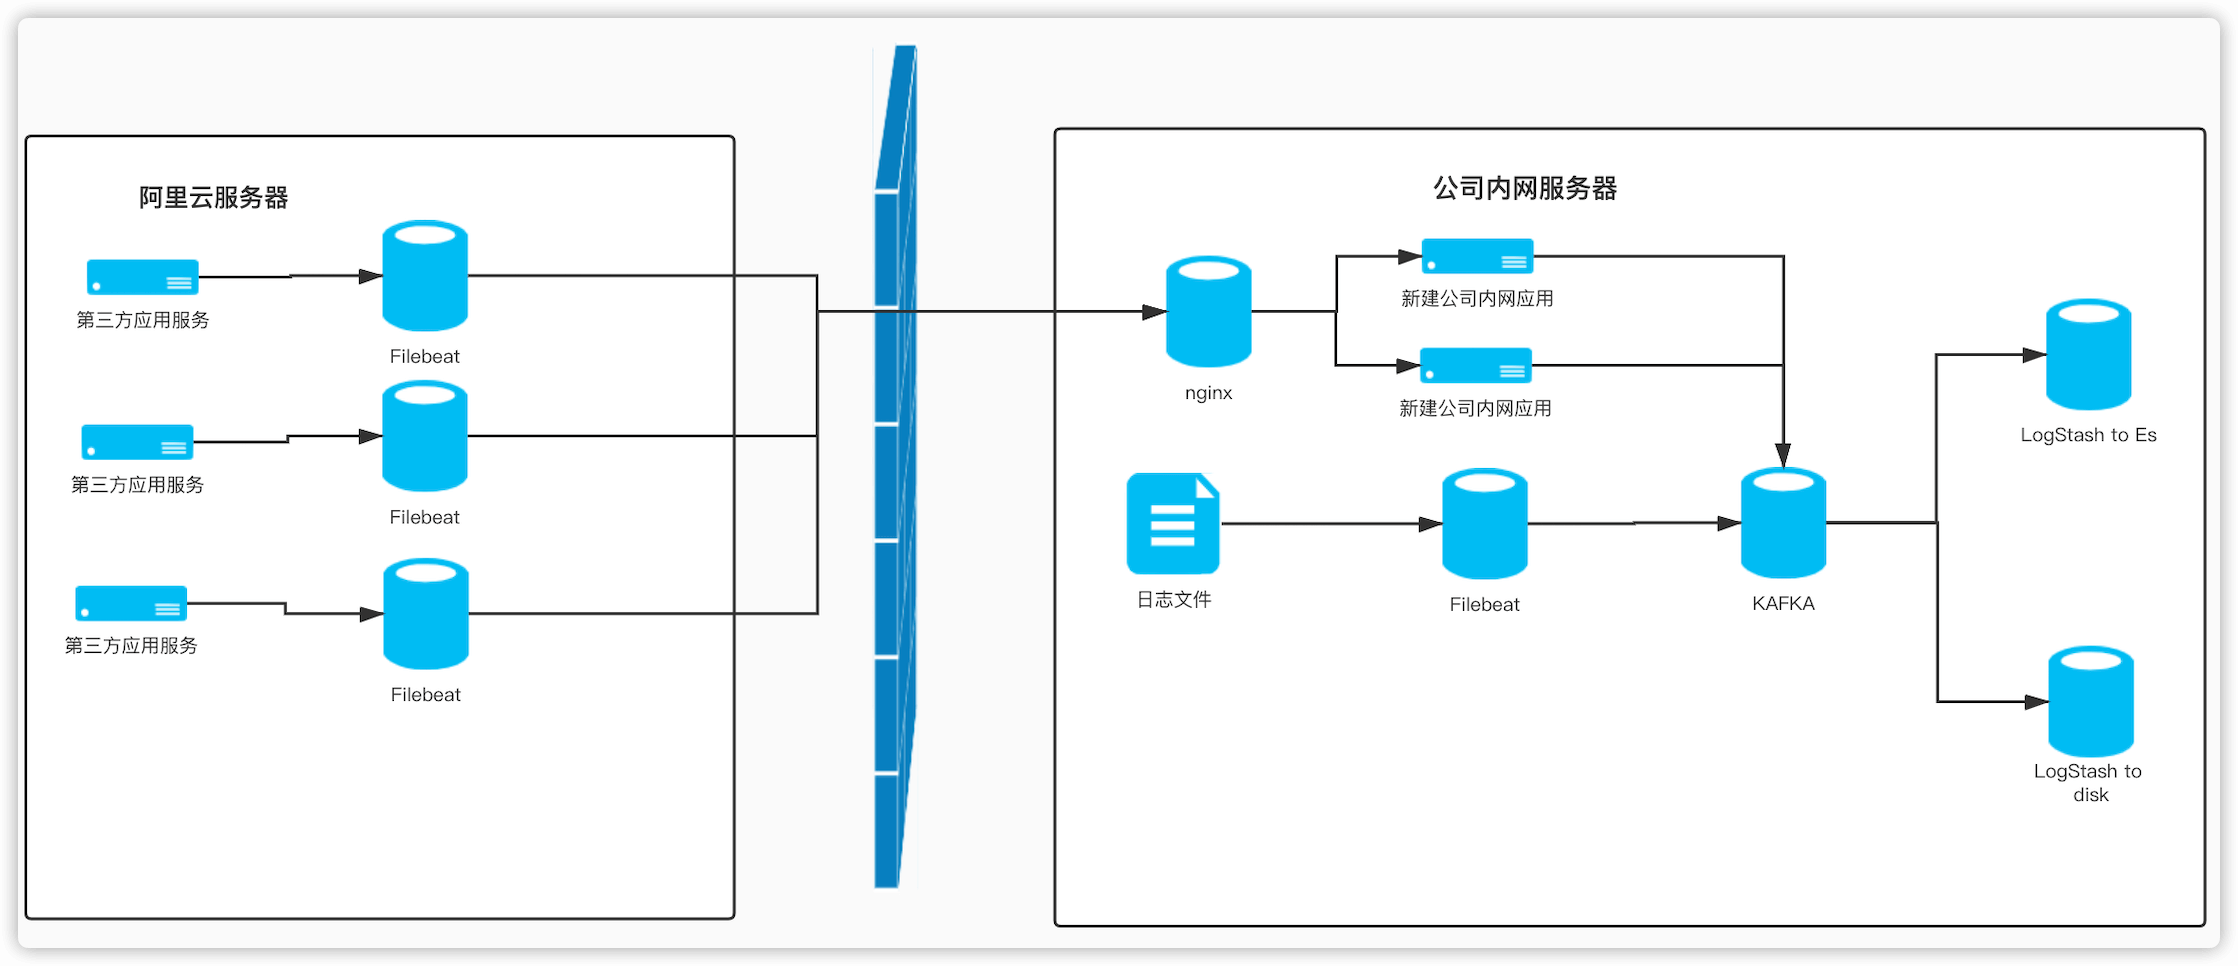
出于安全原因,公司的内网服务器的端口不能向阿里云服务器开放,google查了下文档,可以filebeat可以安装output.http插件,支持http请求的输出,公司的应用可以配置公网的域名,提供http接口给予阿里云上的filebeat进行调用 ,所以初步定的原型如下图。
这里需要将filebeat首先要安装一个插件,然后重新打包才行,因为原生的filebeat是不支持output.http的。filebeat的github地址是
beats % git remote -v
origin  https://github.com/elastic/beats (fetch)
origin  https://github.com/elastic/beats (push)
将项目下载到本地,切换版本到7.13版本的分支
参考文档 https://github.com/crazygreenpenguin/beats-output-http 进行插件的安装配置,这个项目的beats-output-http是针对filebeat v7以上版本的,虽然公司使用的filebeat版本是5.1.6,但是因为其相应的 https://github.com/raboof/beats-output-http beats-output-http插件配置好以后,使用go打包时,总是不成功。
package main

import (
	"os"
		//这里配置插件的github地址
    _ "github.com/crazygreenpenguin/beats-output-http"
	"github.com/elastic/beats/v7/filebeat/cmd"
	inputs "github.com/elastic/beats/v7/filebeat/input/default-inputs"
)

// The basic model of execution:
// - input: finds files in paths/globs to harvest, starts harvesters
// - harvester: reads a file, sends events to the spooler
// - spooler: buffers events until ready to flush to the publisher
// - publisher: writes to the network, notifies registrar
// - registrar: records positions of files read
// Finally, input uses the registrar information, on restart, to
// determine where in each file to restart a harvester.
func main() {
	if err := cmd.Filebeat(inputs.Init, cmd.FilebeatSettings()).Execute(); err != nil {
		os.Exit(1)
	}
}
配置好以后,执行go build命令进行打包,这里要注意,因为我打包的filebeat应用是要在CENTOS系统里运行的,所以打包的命令不能直接使用go build,而要使用如下命令指定运行环境。
env GOOS=linux GOARCH=amd64 go build -o 指定文件名 main.go
如果执行go build的过程中下载慢,则可以参考文档:https://blog.csdn.net/qq_43442524/article/details/104900180 配置go下载的代理。
	go env -w GO111MODULE=on
	go env -w GOPROXY=https://goproxy.cn,direct
执行后就会生成filebeat的执行文件了。接下来我们要在阿里云服务器上面运行这个filebeat的执行文件。将filebeat执行文件上传到阿里云服务器上的 filebeat 目录中。filebeat目录中至少应当有这些文件和目录。
data
fields.yml
filebeat
filebeat.reference.yml
filebeat.yml
kibana
logs
module
modules.d
然后可以配置filebeat的配置文件 filebeat.yml,filebeat配置官方文档,我的配置内容文件如下,要注意的一点是配置文件不要用tab 进行缩进,要老老实实的敲空格。
filebeat.inputs:
- type: log
  enabled: true
  paths:
  	# 需要采集的文件路径,支持 *匹配
    - /apps/srv/instance/my-app/logs/info.log
  multiline.pattern: ^\[
  multiline.negate: true
  multiline.match: after
  multiline.timeout: 10s
  ignore_older: 10m
  close_inactive: 3m
  close_renamed: true
  close_removed: true
  scan_frequency: 1m
  tail_files: true
  harvester_limit: 20480

processors:
  - drop_fields:
      fields: ["prospector"]

queue:
  mem:
    events: 10240
    flush.min_events: 2048
    flush.timeout: 5s

#真实使用配置参考地址 https://github.com/crazygreenpenguin/beats-output-http
output.http:
	# 输出的请求地址
  url: 'http://mydomain.com/info-direct'
  max_retries: 0
  # 请求超时时间,这个很重要,默认是100
  response_header_timeout: 2000

#调试用,可以看到filebeat输出的消息体
#output.console:
#  pretty: true
然后创建启动脚本和停止脚本
-
启动脚本
restart.sh启动filebeat的命令是 filebeat -e -c 配置文件
#!/bin/bash

ID=filebeat
ps -ef | grep yml | grep $ID | awk -F ' ' '{print $2}' | xargs kill -9 2>/dev/null;
echo "${ID}已终止,正在重启.."
nohup /usr/local/instance/filebeat-7/filebeat -e -c /usr/local/instance/filebeat-7/filebeat.yml >> /usr/local/instance/filebeat-7/logs/filebeat.log  2>&1 &
- 停止脚本
stop.sh
#!/bin/bash

ID=filebeat
ps -ef | grep yml | grep $ID | awk -F ' ' '{print $2}' | xargs kill -9 2>/dev/null;
echo "${ID}已终止"
为了获取接收http请求的消息体,就需要将filebeat.yml中的output.console 放开,其他的output 先注释掉,然后就能在日志文件 filebeat.log中看到发出的消息了。
output.console:
  pretty: true
可以看到,单条filebeat输出的消息的格式如下:
{
  "@timestamp": "2021-06-12T07:45:42.298Z",
  "@metadata": {
    "beat": "filebeat",
    "type": "_doc",
    "version": "7.13.2"
  },
  "ecs": {
    "version": "1.8.0"
  },
  "host": {
    "name": "dmn202106110726"
  },
  "agent": {
    "type": "filebeat",
    "version": "7.13.2",
    "hostname": "dmn202106110726",
    "ephemeral_id": "7d859dc2-8e0c-46df-91e0-b1094f284624",
    "id": "551dddd3-6a61-4fdb-a5b6-6ca0c8c0f7e7",
    "name": "dmn202106110726"
  },
  "log": {
    "file": {
      "path": "/usr/local/myapp/logs/threadPoolMonitorLog.log"
    },
    "offset": 410823
  },
  "message": "[2021-06-25 15:45:39.598] [INFO] [ThreadPoolMoniter-pool-17-thread-2] threadPoolMonitorLog 68 [151] - 线程池: ContactLabelUpdate-pool-22-thread-java.util.concurrent.ThreadPoolExecutor@2d32ac7f[Running, pool size = 0, active threads = 0, queued tasks = 0, completed tasks = 0]",
  "input": {
    "type": "log"
  }
}
也就是说,我们的接收filebeat的springboot项目要接收的消息就是上面代码这样的格式。在我们的接收filebeat消息的应用搭建跑起来以后,将output.console注释掉,改为output.http
output.http:
  url: 'http://mydomain.com/info-direct'
  max_retries: 0
配置好以后,重启filebeat,然后我的web应用就接收到 filebeat发送来的消息体了,然后转换为公司内部的日志采集流程中的kafka消息格式进行发送。然后日志采集到磁盘和es都可以正常了。本来觉得已经没问题了,然后就检查一下日志是否正常吧,不检查还好,一检查完蛋。过了一小时了,日志还是1小时前的,感觉是不是有延迟啊,然后就等到第二天,我的老天,日志在昨天的那个时间点转呢,就一分钟的消息怎么都转不出来了,而且消息的时间是乱的,就是有的在前面有的在后面。然后看filebeat的日志,就是一直有一个retries的消息,因为我的 output.http的配置已经配置了max_retires:0了,所以我感觉应该不会重试了吧,不会吧,不会吧。

然后我就排查了公司的日志采集的流程,很完美,没有瑕疵。难道是filebeat发消息的顺序是乱的?然后我有在阿里云服务器上面增加了一个springboot项目,来用http接收filebeat的http类型的output,结果也是顺序的。然后我就懵了,咋回事哦,filebeat的顺序也是对的,输出也很实时,为啥转发过来就延迟了那么长时间一致在1分钟那里转了呢?然后我就把阿里云服务器上面增加的springboot的日志和公司内网的springboot项目的日志都下载下来,从头按顺序往下翻,翻着翻着,您猜怎么着,感觉好多的日志都似曾相识,用sublimtext把似曾相识的日志给匹配一下,渥的老哥,您再猜怎么着,循环了,一看到循环,就联想到retry,他这个就是不断的retry了,所以就循环了。
然后我就排查为什么filebeat会retry,看到了一个文章,找不到链接了,filebeat的消息发送是顺序的,消息发送成功的判定很简单,只要请求返回的状态是200就可以了,返回值是什么无所谓(这个是看 beats-output-http源码了解的),其实这个问题看filebeat输出的日志就能看出来,日志里面有timeout的字样,因为一开始就把这个给排除掉了,所以因为这个绕了三天的弯路。那么既然超时了,我们就要设置超时时间,我将超时时间设置为2000ms,然后日志就正常能够往后输出了。
queue:
  mem:
    events: 10240
    flush.min_events: 2048
    flush.timeout: 5s
output.http:
	# 输出的请求地址
  url: 'http://mydomain.com/info-direct'
  max_retries: 0
  # 请求超时时间,这个很重要,默认是100
  response_header_timeout: 2000
  # Specifies the amount of time in milliseconds to wait for a server's response
  # headers after fully writing the request (including its body, if any).
  # This time does not include the time to read the response body.
  # default=100ms
完结散花~~~~ 开玩笑的,当然没有了。虽然日志能继续往后刷了,但是刷的很慢,于是我加了一个请求次数统计,一统计,不得了,每分钟才能处理三十多次,好家伙,filebeat的消息发送是顺序的,刚刚我们说过了,需要前一条发送acked了,然后才能接着处理下一条,这瓶颈不就卡在了我这个应用上面了吗,虽然平均请求时间也就20ms,还没算网络传输的时间,这样每秒也就能处理50条啊,一分钟也就3000条,课时我们阿里云上面的应用,每秒就能产生数百条的日志,这个http请求处理的效率肯定不够,怎么办,只能在阿里云再增加一个springboot应用,快速的处理filebeat发出的请求,将消息缓冲,凑够几百条以后,在批量发给公司的应用进行批量循环处理发送,以缩短网络传输的时间了。就这么一弄,果然ok了,日志刷新是准实时的了。这会是真的完结散花了。
参考文档:
Filebeat 采集日志到 Kafka 配置及使用
https://lihuimintu.github.io/2019/08/05/Filebeat-Kafka/Centos安装Filebeat
https://blog.csdn.net/jeikerxiao/article/details/84841792filebeat kafka配置整理
https://blog.csdn.net/qq_41926119/article/details/104510481filebeat官方文档
https://www.elastic.co/guide/en/beats/filebeat/current/configuring-howto-filebeat.htmllinux查看环境变量
https://www.php.cn/linux-416847.html
go下载慢问题
https://blog.csdn.net/qq_43442524/article/details/104900180
filebeat 源码编译安装
https://www.cnblogs.com/dyh004/p/9673615.htmlbeats-output-http
https://github.com/crazygreenpenguin/beats-output-httpmac生成linux下可执行的.go二进制文件
https://blog.csdn.net/qq_37133717/article/details/84030814使用KafkaMagic查看kafka的消息内容
https://blog.csdn.net/lwlfox/article/details/104625366java发送kafka消息
https://blog.csdn.net/wobuaizhi/article/details/80950337
https://blog.csdn.net/u013144287/article/details/76277295

为开发者提供学习成长、分享交流、生态实践、资源工具等服务,帮助开发者快速成长。
更多推荐


 2
2 0
0- 0


 已为社区贡献22条内容

所有评论(0)