ELK安装部署及使用
ELK 的搭建与使用。elasisearchlogstashkibanafilebeat
ELK 日志管理
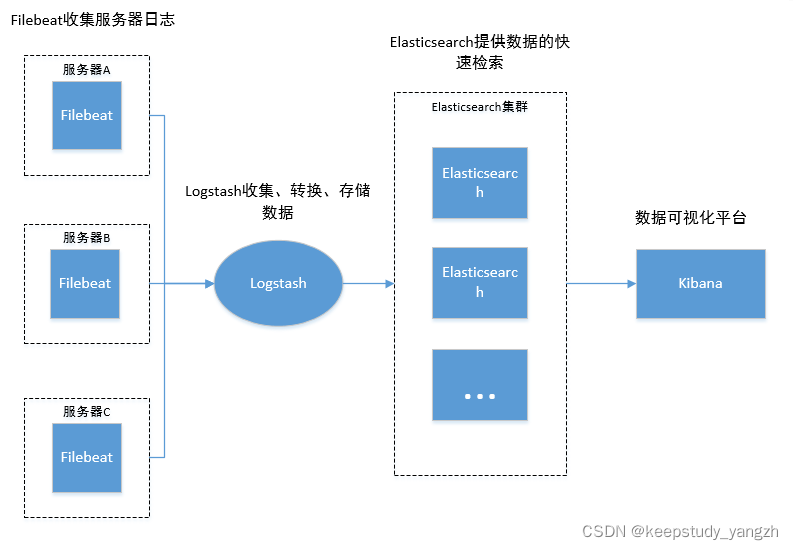
ELK是elastic公司提供的一套完整的日志收集及展示的解决方案,是三个开源软件的缩写,分别表示:Elasticsearch , Logstash, Kibana 。
部署elk的目的:
1.日志数据量大,查询起来慢
2.分布式或集群部署的项目,系统出现问题时无法快速定位哪台机器出现的问题。通过日志排查问题需要逐个去服务器去查看,排查问题。
3.能够将日志进行可视化分析。
4. …
简单elk架构
部署环境:centos7.6
Elasticsearch(7.16.2)
介绍:Elasticsearch是一个基于Lucene的搜索服务器。它提供了一个分布式多用户能力的全文搜索引擎,基于RESTful web接口。Elasticsearch是用Java语言开发的,并作为Apache许可条款下的开放源码发布,是一种流行的企业级搜索引擎。
版本:7.16.2
下载地址:
https://artifacts.elastic.co/downloads/elasticsearch/elasticsearch-7.16.2-linux-x86_64.tar.gz
1.1. 安装启动:
启动elasticsearch 不能使用root用户,首先创建用户 adduser es
需要安装java环境。
创建日志、数据文件夹并赋权限。
mkdir -p /data/elasticsearch/data
mkdir -p /data/elasticsearch/logs
chown -R es:es ${elasticsearchHome}
chown -R es:es /data/elasticsearch/data
chown -R es:es /data/elasticsearch/logs
修改配置文件:
vim ${elasticsearchHome}/config/elasticsearch.yml
cluster.name: my-application
node.name: node-1
path.data: /data/elasticsearch/data
path.logs: /data/elasticsearch/logs
network.host: 0.0.0.0
http.port: 9200
设置密码:
默认账号:elastic,apm_system,kibana,kibana_system,logstash_system,beats_system,remote_monitoring_user
修改配置文件 vim ${elasticsearchHome}/config/elasticsearch.yml
xpack.security.enabled: true
xpack.security.transport.ssl.enabled: true
./elasticsearch-setup-passwords interactive
注意:elasticsearch 配置密码后,kibana需要安装插件,设置账号密码,否则无法登录。
启动命令:
sudo -u es /usr/package/elasticsearch-7.16.2/bin/elasticsearch -d
实时打印启动日志:
tail -n 200 -f /data/elasticsearch/logs/my-application.log
验证:
直接访问:http://ip:9200/
1.2. 优化配置:
设置jvm堆大小:
默认情况下,Elasticsearch 会根据节点的角色和总内存自动设置 JVM 堆大小。我们建议大多数生产环境使用默认大小。
如需修改:
${elasticsearchHome}/config/jvm.options
-Xms2g
-Xmx2g
1.3. 常见问题:
max virtual memory areas vm.max_map_count [65530] is too low, increase to at
【修改一个进程可以拥有的VMA(虚拟内存区域)的数量】
解决办法:
vim /etc/sysctl.conf 最后增加:
vm.max_map_count=262144
执行 sysctl -p
2.bootstrap check failure [1] of [1]: max file descriptors [4096] for elasticsearch process is too low, increase to at least [65535]
【每个进程最大同时打开文件数太小,可通过下面2个命令查看当前数量】
ulimit -Hn
ulimit -Sn
解决办法:
vim /etc/security/limits.conf
  soft    nofile          65536
  hard    nofile          65536
Kibana(7.16.2)
介绍:Kibana 是一个免费且开放的用户界面,能够让您对 Elasticsearch 数据进行可视化,并让您在 Elastic Stack 中进行导航。您可以进行各种操作,从跟踪查询负载,到理解请求如何流经您的整个应用,都能轻松完成。
也可用于服务器资源的监控,跟Grafana功能类似。
结合metricbeat 可监测服务器资源
版本:7.16.2
下载地址:https://www.elastic.co/cn/downloads/kibana
2.1.安装
解压tar.gz
修改配置:
server.port: 5601
server.host: "0.0.0.0"
elasticsearch.hosts: ["http://127.0.0.1:9200"]
elasticsearch.username: "kibana_system" # 如果没有账号,则注释掉
elasticsearch.password: "123456" #
i18n.locale: "zh-CN"  # 管理界面中文,默认为英文
赋权限:
chown -R es:es ${kibanaHome}
创建日志目录:
mkdir -p /data/kibana/log
设置账号、密码(如果elasticsearch没有账号密码,可忽略):
安装插件:
启动:sudo -u es /usr/package/kibana-7.16.2-linux-x86_64/bin/kibana --allow-root > /data/kibana/log/kibana.log &
停止:
kill -9 `lsof -i :5601 -t`
2.2.kibana的使用
在elk+filebeat都搭建好并启动后登录kibana,如果没有,先忽略此章节,先完成elk的部署。
直接访问:http://ip:5601/
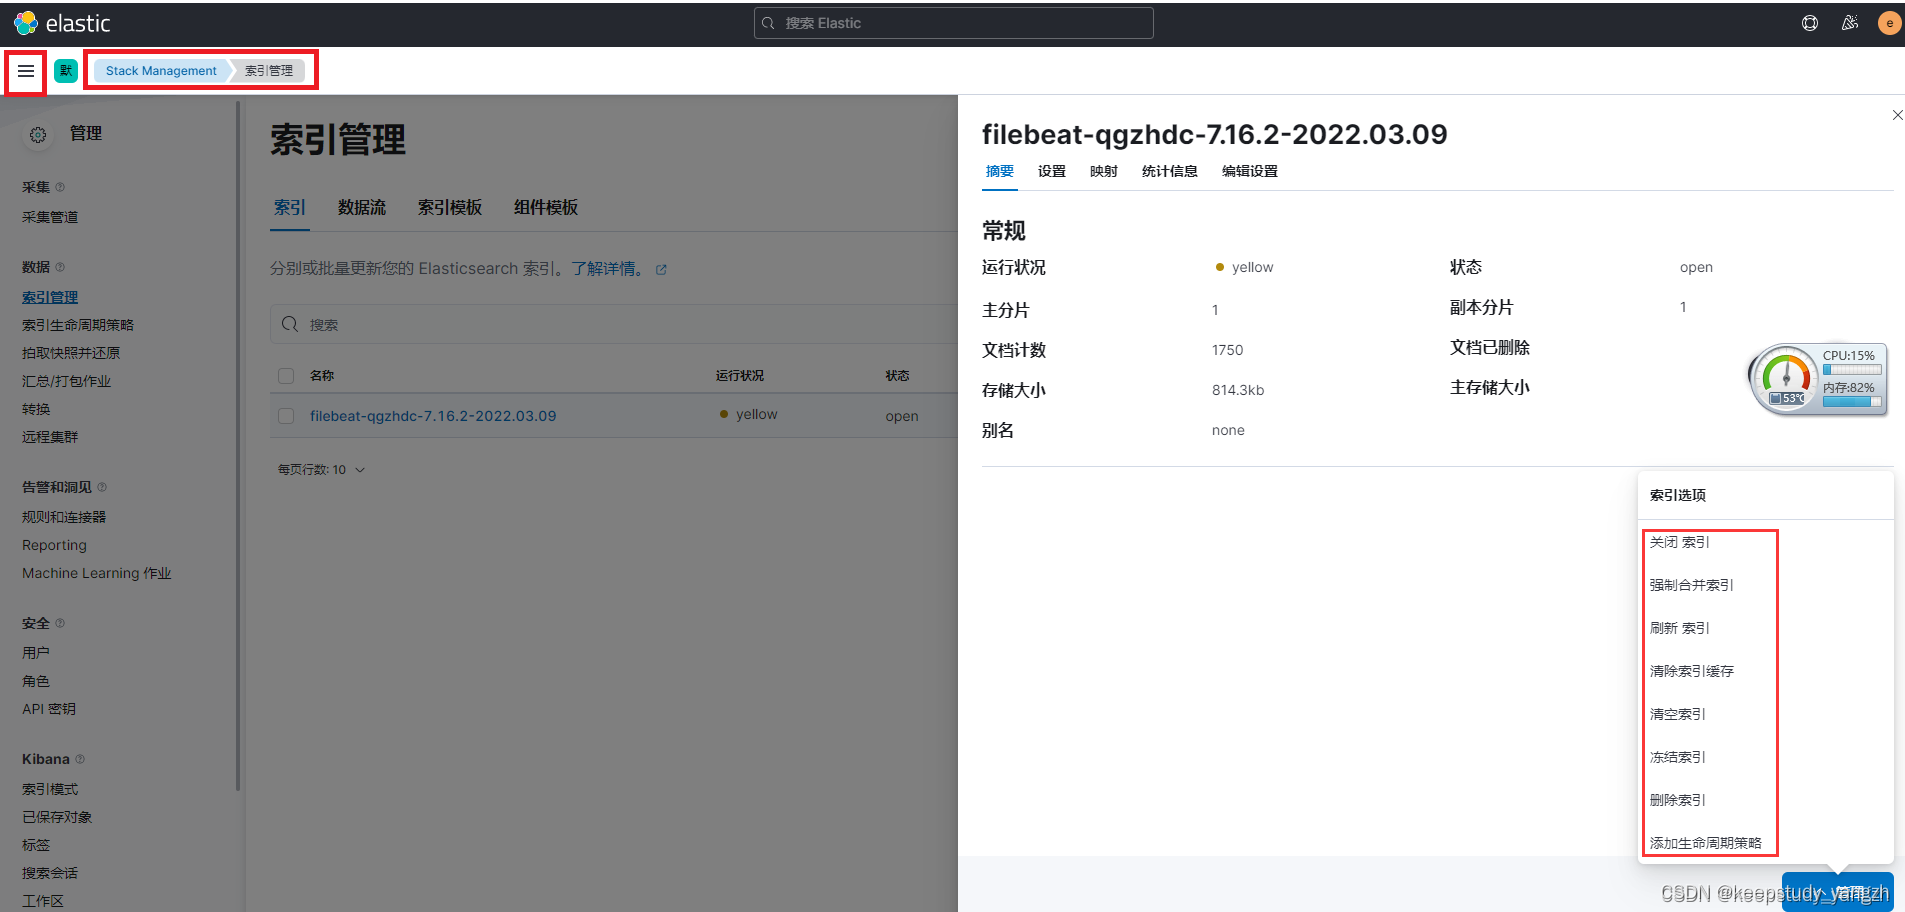
2.2.1索引管理
启动logstash、filebeat ,收集日志后输出到elasticsearch后, 在【Stack Management- 数据- 索引管理 】模块,可以看到已经创建的索引,并且可以对索引进行基本的删除,查看等操作。
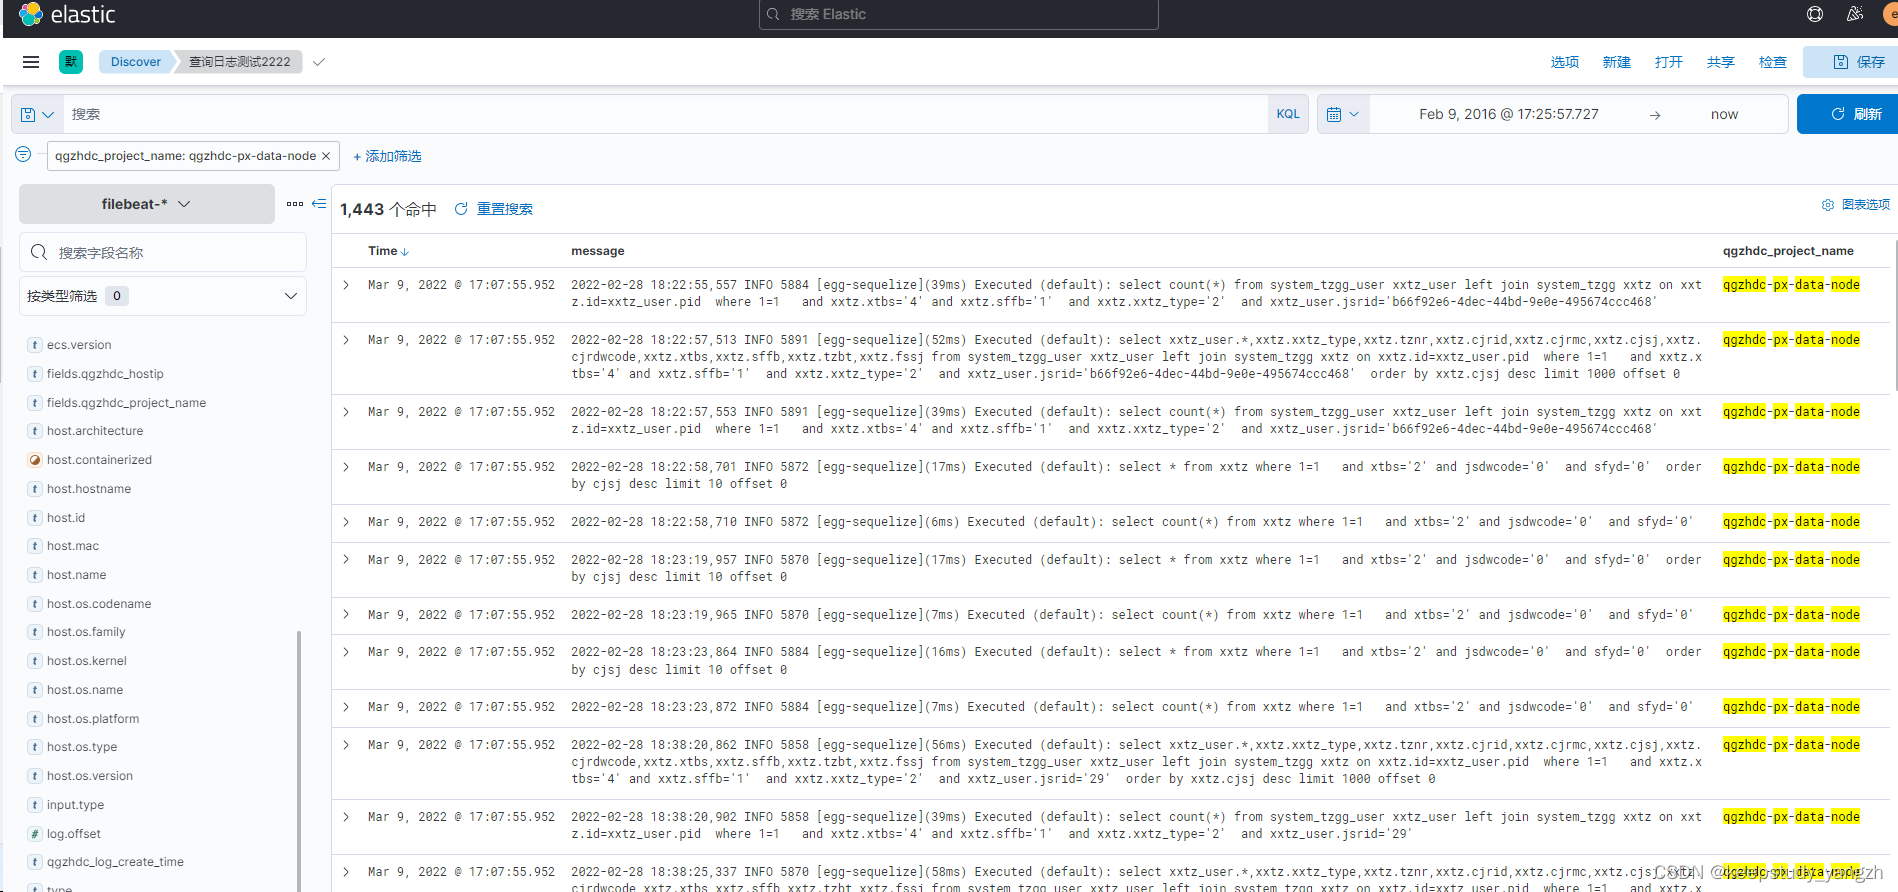
2.2.2 日志分析检索:
在 Elasticsearch 中有数据。Kibana 需要索引模式来识别您要浏览的数据链、索引和索引别名。索引模式可以指向特定索引(例如昨天的日志数据),或包含日志数据的所有索引。
1.在 【Management —— Stack Management —— kibana - 索引模式】 创建索引模式。
2.在 【Analytics-Discover】中可以针对不同的索引模式进行日志数据的检索,并可以设置不同的查询条件。
2.3.常见问题
1.启动时报错
TOO_MANY_REQUESTS/12/disk usage exceeded flood-stage watermark, index has read-only-allow-delete block
可能原因:Elasticsearch 所在服务器,磁盘空间不足,扩容后可解决。
Logstash(7.16.2)
介绍:
Logstash 是免费且开放的服务器端数据处理管道,能够从多个来源采集数据,转换数据,然后将数据发送到您最喜欢的“存储库”中。
Logstash事件处理有三个阶段:inputs→filters→outputs。
是一个接收,处理,转发日志的工具。支持系统日志,webserver日志,错误日志,应用日志,总之包括所有可以抛出来的日志类型。
版本:7.16.2
下载地址:https://www.elastic.co/cn/downloads/logstash
说明文档:https://www.elastic.co/guide/en/logstash/7.16/getting-started-with-logstash.html
3.1.安装
修改配置文件:
vim ${LogstashHome}/config/logstash.yml
vim ${LogstashHome}/config/logstash.conf
必须存在配置,不然启动报错。
配置参考:
使用logstash收集服务器日志文件配置:
input {
  file {
    path => "/root/logs/qgzhdc-px-data-node/common-error.log"
    type => "qgzhdc-common-error-data"
    start_position =>"beginning"
     # start_interval =>"2"
  }
  file {
    path => "/root/logs/qgzhdc-statistics-node/common-error.log"
    type => "qgzhdc-common-error-statistics"
    start_position =>"beginning"
  }
}
output {
  if [type] == "qgzhdc-common-error-data"{
    elasticsearch {
      hosts => ["172.16.100.156:9200"]
      index => "qgzhdc-common-error-data-%{+YYYY.MM.dd}"
    }
  }
  if [type] == "qgzhdc-common-error-statistics"{
    elasticsearch {
      hosts => ["172.16.100.156:9200"]
      index => "qgzhdc-common-error-statistics-%{+YYYY.MM.dd}"
    }
  }
}
使用filebeat收集日志,logstash处理日志
input {
 beats {
    port => 5044
    type => "filebeat"
    client_inactivity_timeout => 36000
  }
}
filter {
  # 拾取日志文件中的日期
  grok{
      match =>{"message"=>"%{TIMESTAMP_ISO8601:qgzhdc_log_create_time}"}
     }
}
output {
 if [type] == "filebeat"{
    elasticsearch {
      user => "elastic"
      password => "123456"
      hosts => ["172.16.100.156:9200"]
      index => "%{[@metadata][beat]}-%{[@metadata][version]}-%{+YYYY.MM.dd}"
    }
  }
}
3.2.启动
默认端口 9600
/usr/package/logstash-7.16.2/bin/logstash -f /usr/package/logstash-7.16.2/config/logstash.conf &
停止:ps -ef | grep logstash ,然后kill -9 [查询到的端口]
或者将logstash 安装为服务,使用 systemctl 去管理:
- 修改 /usr/package/logstash-7.16.2/config/startup.conf
配置: 详见 附录配置startup.conf
执行 ${logstashHome}/bin/system-install
systemctl 管理服务:
启动 :systemctl start logstash
停止:systemctl stop logstash
查看启动状态: systemctl status logstash -l
注意:
目前存在问题,使用systemctl 没有去使用指定的配置文件,可以去修改
vim /etc/systemd/system/logstash.service
中的 ExecStart参数。 完整的如下。
配置: 详见 附录配置logstash.service
Filebeats(7.16.2)
介绍:Filebeat 是一个用于转发和集中日志数据的轻量级传送器。作为代理安装在您的服务器上,Filebeat 监控您指定的日志文件或位置,收集日志事件,并将它们转发到Elasticsearch或 Logstash以进行索引。
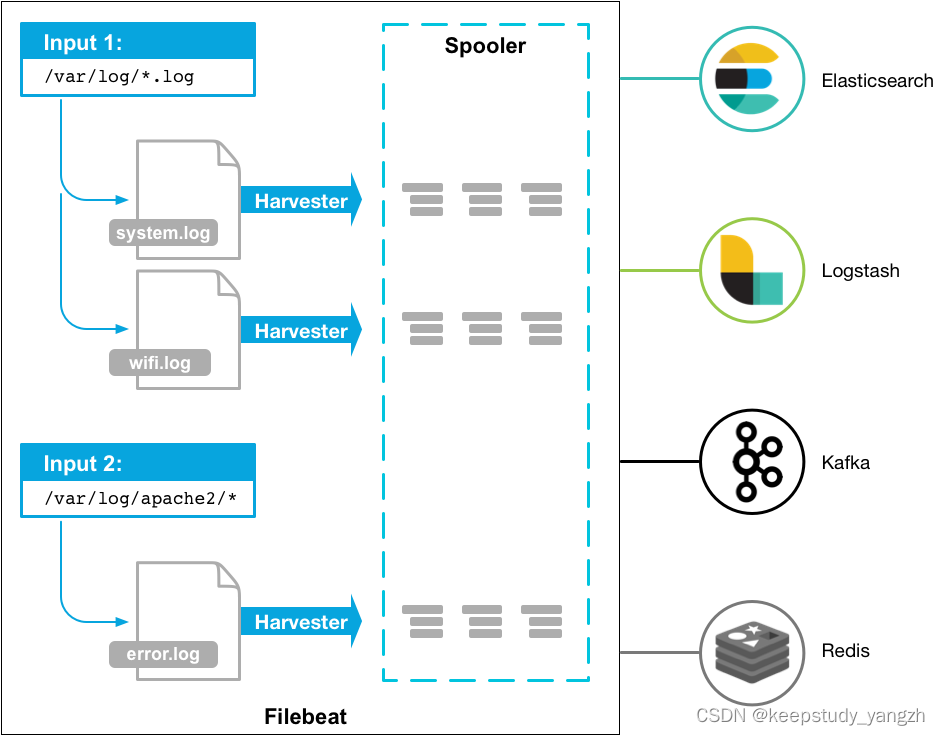
Filebeat包含两个主要的组件:inputs和harvesters。这些组件协同工作把变化的文件发送到指定的输出中。
工作原理:
https://www.elastic.co/guide/en/beats/filebeat/7.16/how-filebeat-works.html
当启动filebeat时,它会启动一个或多个inputs(输入),这些inputs会去您指定的目录中查询日志数据。对于 Filebeat 定位的每个日志,filebeat都会启动一个harvester(收割机)。每个harvester 读取单个日志以获取新内容并将新日志数据发送到libbeat,libbeat 聚合事件并将聚合数据发送到您为Filebeat 配置的输出。
4.1.安装
版本:7.16.2
下载地址:
详细配置参考: 详见 附录配置filebeat.yml
4.2.启动
./filebeat -e
4.3 配置:
https://www.elastic.co/guide/en/beats/filebeat/7.16/configuring-howto-filebeat.html
4.3.1 配置inputs
filebeats 可以配置多个输入,并且有许多输入方式,并且可以多次指定相同的输入类型。
可使用的type 有:
[AWS CloudWatch,AWS S3,Azure Event Hub,Cloud Foundry,Container,Docker,filestream,GCP Pub/Sub,HTTP Endpoint,HTTP JSON,journald,Kafka,Log,MQTT,NetFlow,Office 365 Management Activity API,Redis,Stdin,Syslog,TCP,UDP]
这里我们使用filestream,使用filebeats读取服务器中的日志文件。
filebeat.inputs:
# 第一个输入
- type: filestream
#是否启用
enabled: true
# 自定义标签
tags: ["qgzhdc-px-data-node"]
# 收集日志的文件路径,可以使用通配附*等
paths:
- /root/logs/qgzhdc-px-data-node/qgzhdc-px-data-node-web.log.2022-02-28
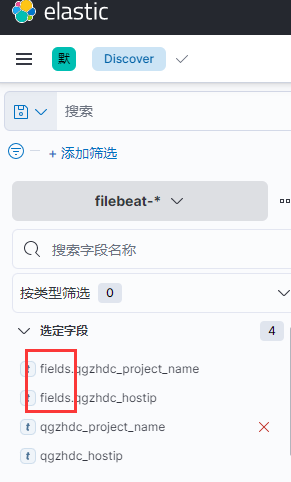
# fields 自定义字段与值,这个在检索日志时使用,会给每条日志增加此key与value,能够标识出日志来源。
fields:
qgzhdc_project_name: qgzhdc-px-data-node
qgzhdc_hostip: myiptest
# fields_under_root如果为false,则fields下的key会挂到fields下,true的话
fields_under_root: true
# 第二个输入
- type: filestream
enabled: true
tags: ["qgzhdc-px-import-node"]
paths:
- /root/logs/qgzhdc-px-import-node/common-error.log.2022-03-01
fields:
qgzhdc_project_name: qgzhdc-px-import-node
qgzhdc_hostip: myiptest
fields_under_root: false
多行日志合并
multiline.type
定义要使用的合并方法。默认值为pattern. 另一个选项是count让您合并固定数量的行。
multiline.pattern
指定要匹配的正则表达式模式。根据您配置其他多行选项的方式,与指定正则表达式匹配的行被视为前一行的延续或新多行事件的开始。您可以设置negate选项来否定模式。
multiline.negate
定义模式是否被否定。默认值为false.
multiline.match
指定 Filebeat 如何将匹配的行组合成一个事件。设置为after或before。这些设置的行为取决于您指定的内容negate:
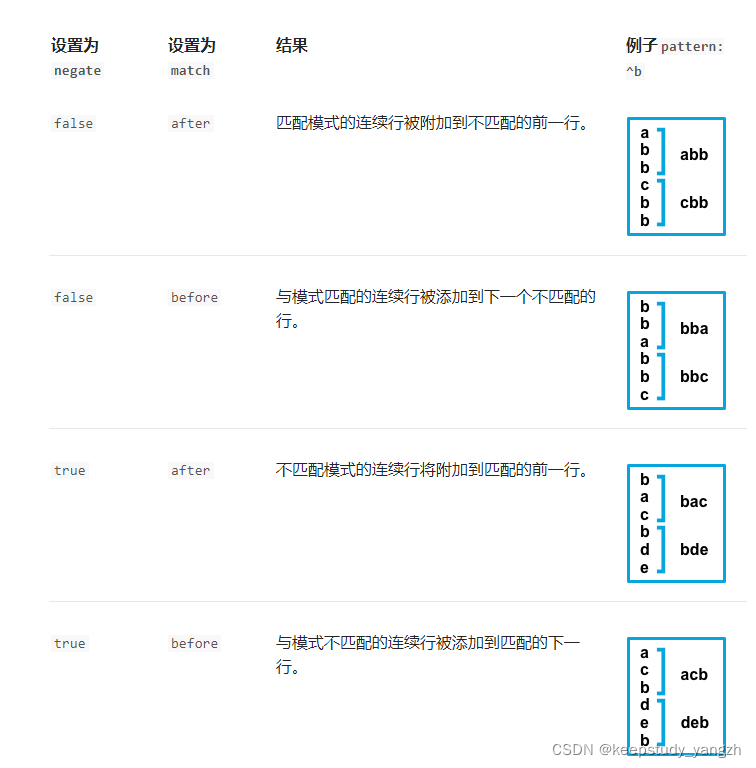
eg:
匹配不以时间开头的合并到以时间开头的日志之后。
filebeat.inputs:
   parsers:
      - multiline:
          type: pattern
          pattern: ^\[?[0-9]{4}-[0-9][0-9]?-[0-9][0-9]?
          negate: true
          match: after
          timeout: 10s
4.3.2 全局、常规配置General settings(tags,fields,fields_under_root…)
其分为全局配置与常规配置。
常规设置:
所有 Elastic Beat 都支持常规配置。由于它们是常用选项,因此它们不带命名空间。
常规配置会在整个启动的filebeat中生效。
# ================================== General ===================================
tags: ["nginx"]
fields:
  gxsn_project_name: nginx-157test
fields_under_root: true
fields_under_root:
fields_under_root为true时,字段直接为gxsn_project_name,否则是fields.gxsn_project_name
自定义标签 tags :
tags: ["qgzhdc-px-data-node"]
在logstash中可以通过此标签值去创建不同的索引名。下面是logstash的output配置。
eg:
output {
  if [type] == "filebeat"{
    if "qgzhdc-px-data-node" in [tags]{
    elasticsearch {
      user => "elastic"
      password => "123456"
      hosts => ["172.16.101.12:9200"]
      index => "%{[@metadata][beat]}-%{[@metadata][version]}-data-%{+YYYY.MM.dd}"
    }
   }
    if "qgzhdc-px-import-node" in [tags]{
     elasticsearch {
      user => "elastic"
      password => "123456"
      hosts => ["172.16.101.12:9200"]
      index => "%{[@metadata][beat]}-%{[@metadata][version]}-import-%{+YYYY.MM.dd}"
    }
   }
  }
}
4.3.3 配置modules
使用modules ,使用nginx测试。
查看所有modules filebeat modules list
启用某个模块: filebeat modules enable nginx
关闭某个模块: filebeat modules disable nginx
启用模块后,这里可以看到 ${filebeatHome}/modules.d 目录中nginx.yml.disabled 文件变为了 nginx.yml, 然后修改nginx.yml。
修改 filebeat.yml ,reload.enabled:true。
filebeat.config.modules:
  path: ${path.config}/modules.d/*.yml
  reload.enabled: true
setup.kibana:
   host: "ip:5601"
设置初始环境需要连接到elasticsearch (或 elasticsearch Service)
如果output为 elasticsearch,可直接执行 filebeat setup -e,执行成功后会自动生成一些 index template(索引模板)、dashboards(仪表板),ingest pipelines(摄取管道)可直接使用。
如果output是其他的输出(例如logstash ):
手动加载索引模板:./filebeat setup --index-management -E output.logstash.enabled=false -E 'output.elasticsearch.hosts=["localhost:9200"]'
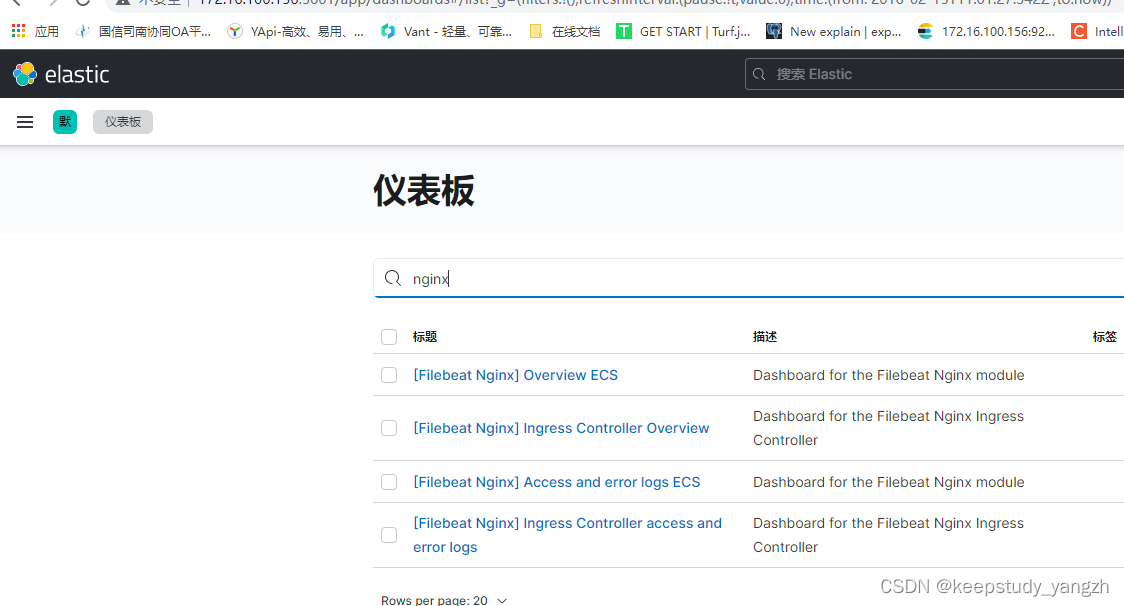
加载Kibana 仪表板:filebeat setup --dashboards
加载摄取管道:./filebeat setup --pipelines --modules system,nginx,mysql (注:执行这个时,需要将filebeat.yml中的output 先调整到elasticsearch,之后在调增回logstash)
在filebeat引入摄取管道(pipelines)时,并且配合logstash使用时,logstash需要特殊配置,logstash.yml:
input {
  beats {
    port => 5044
  }
}

output {
  if [@metadata][pipeline] {
    elasticsearch {
      hosts => "host"
      manage_template => false
      index => "%{[@metadata][beat]}-%{[@metadata][version]}-%{+YYYY.MM.dd}"
      pipeline => "%{[@metadata][pipeline]}"
      user => "elastic"
      password => "secret"
    }
  } else {
    elasticsearch {
      hosts => "host"
      manage_template => false
      index => "%{[@metadata][beat]}-%{[@metadata][version]}-%{+YYYY.MM.dd}"
      user => "elastic"
      password => "secret"
    }
  }
}

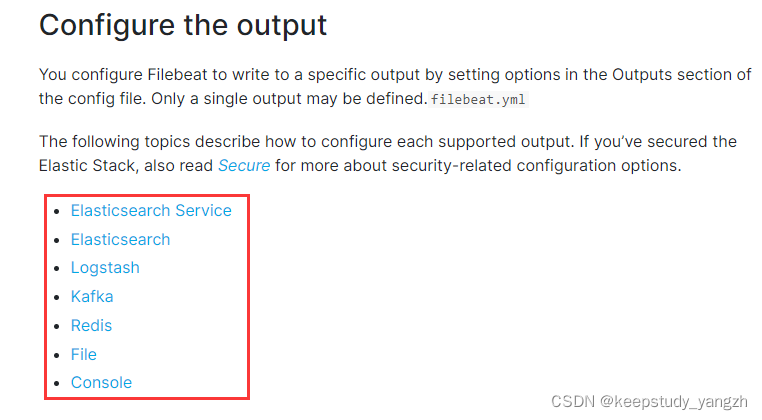
4.3.2 配置 output
只能设置一个输出。输出类型有
直接输出到logstash:
output.logstash:
  hosts: ["ip:5044"]
  index: filebeat-ip
输出到elasticsearch:
output.elasticsearch:
 hosts: ["ip:9200"]
  username: "elastic"
  password: "123456"
  indices:
    - index: "nginx157-warn-%{+yyyy.MM.dd}"
      when.contains:
        message: "WARN"
    - index: "nginx157-error-%{+yyyy.MM.dd}"
      when.contains:
        message: "ERR"
附录:
Elasticsearch:
Elasticsearch可视化工具
http://mobz.github.io/elasticsearch-head
elasticsearch-head:插件安装
0.x,1.x,2.x 支持在elasticsearch 中以插件形式安装:
./elasticsearch-plugin install -h  查看可以安装的插件

1.elasticsearch/bin/plugin -install mobz/elasticsearch-head
2.运行es
3.打开http://ip:9200/_plugin/head/
5.x 版本不支持插件安装,只能单独启动一个服务:
• git clone git://github.com/mobz/elasticsearch-head.git
• cd elasticsearch-head
• npm install
• npm run start
open http://localhost:9100/
`
Elasticsearch常用操作:
查询集群是否健康:
curl ‘ip:port/_cat/health?v’
查询所有节点:
curl ‘ip:port/_cat/nodes?v’
查询所有索引
curl ‘ip:port/_cat/health?v’
创建索引
curl -XPUT ‘ip:port/yangzhtest_index?pretty’
插入数据
插入数据为 {“name”:”yangzh”}
curl -XPUT ‘ip:port/yangzhtest_index/external/1?pretty’ -d ‘{“name”:”yangzh”}’
需要加上请求头,不然报错
curl -H “Content-Type:application/json” -XPUT ‘ip:port/yangzhtest_index/external/1?pretty’ -d ‘{“name”:“yangzh”}’
获取数据:
curl -XGET ‘ip:port/yangzhtest_index/external/1?pretty’
删除数据:
curl -XDELETE ‘ip:port/yangzhtest_index/external/1?pretty’
删除索引:
curl -XDELETE ip:port/qgzhdc-*
…
配置文件
logstash_startup.conf
startup.conf
# Set a home directory
LS_HOME=/usr/package/logstash-7.16.2

# logstash settings directory, the path which contains logstash.yml
LS_SETTINGS_DIR=/usr/package/logstash-7.16.2/config/

# Arguments to pass to logstash
LS_OPTS="--path.settings ${LS_SETTINGS_DIR}"

# Arguments to pass to java
LS_JAVA_OPTS=""

# pidfiles aren't used the same way for upstart and systemd; this is for sysv users.
LS_PIDFILE=/var/run/logstash.pid

# user and group id to be invoked as
LS_USER=root
LS_GROUP=root

# Enable GC logging by uncommenting the appropriate lines in the GC logging
# section in jvm.options
LS_GC_LOG_FILE=/var/log/logstash/gc.log

# Open file limit
LS_OPEN_FILES=16384

# Nice level
LS_NICE=19

# Change these to have the init script named and described differently
# This is useful when running multiple instances of Logstash on the same
# physical box or vm
SERVICE_NAME="logstash"
SERVICE_DESCRIPTION="logstash"

# If you need to run a command or script before launching Logstash, put it
# between the lines beginning with `read` and `EOM`, and uncomment those lines.
###
## read -r -d '' PRESTART << EOM
## EOM
logstash.service
logstash.service
[Unit]
Description=logstash

[Service]
Type=simple
User=root
Group=root
# Load env vars from /etc/default/ and /etc/sysconfig/ if they exist.
# Prefixing the path with '-' makes it try to load, but if the file doesn't
# exist, it continues onward.
EnvironmentFile=-/usr/package/logstash-7.16.2
EnvironmentFile=-/usr/package/logstash-7.16.2
ExecStart=/usr/package/logstash-7.16.2/bin/logstash "--path.settings" "/usr/package/logstash-7.16.2/config/" -f "/usr/package/logstash-7.16.2/config/logstash.conf"
Restart=always
WorkingDirectory=/usr/package/logstash-7.16.2
Nice=19
LimitNOFILE=16384

# When stopping, how long to wait before giving up and sending SIGKILL?
# Keep in mind that SIGKILL on a process can cause data loss.
TimeoutStopSec=infinity

[Install]
WantedBy=multi-user.target
filebeat.yml
filebeat.yml
# ============================== Filebeat inputs ===============================
filebeat.inputs:

# Each - is an input. Most options can be set at the input level, so
# you can use different inputs for various configurations.
# Below are the input specific configurations.

# filestream is an input for collecting log messages from files.
- type: filestream

  # Change to true to enable this input configuration.
  enabled: true

  # Paths that should be crawled and fetched. Glob based paths.
  paths:
    - /root/logs/qgzhdc-px-data-node/qgzhdc-px-data-node-web.log.2022-02-28
  # fields 自定义字段与值
  fields:
    qgzhdc_project_name: qgzhdc-px-data-node
    qgzhdc_hostip: myiptest

- type: filestream
  enabled: true
  paths:
    - /root/logs/qgzhdc-px-import-node/common-error.log.2022-03-01
  fields:
    qgzhdc_project_name: qgzhdc-px-import-node
    qgzhdc_hostip: myiptest
  # Exclude lines. A list of regular expressions to match. It drops the lines that are
  # matching any regular expression from the list.
  #exclude_lines: ['^DBG']

  # Include lines. A list of regular expressions to match. It exports the lines that are
  # matching any regular expression from the list.
  #include_lines: ['^ERR', '^WARN']

  # Exclude files. A list of regular expressions to match. Filebeat drops the files that
  # are matching any regular expression from the list. By default, no files are dropped.
#prospector.scanner.exclude_files: ['.gz$']

  # Optional additional fields. These fields can be freely picked
  # to add additional information to the crawled log files for filtering
  #fields:
  #  level: debug
  #  review: 1

# ============================== Filebeat modules ==============================

filebeat.config.modules:
  # Glob pattern for configuration loading
  path: ${path.config}/modules.d/*.yml

  # Set to true to enable config reloading
  reload.enabled: false

  # Period on which files under path should be checked for changes
  #reload.period: 10s

# ======================= Elasticsearch template setting =======================

setup.template.settings:
  index.number_of_shards: 1
  #index.codec: best_compression
  #_source.enabled: false


# ================================== General ===================================

# The name of the shipper that publishes the network data. It can be used to group
# all the transactions sent by a single shipper in the web interface.
#name:

# The tags of the shipper are included in their own field with each
# transaction published.
#tags: ["service-X", "web-tier"]

# Optional fields that you can specify to add additional information to the
# output.
#fields:
#  env: staging

# ================================= Dashboards =================================
# These settings control loading the sample dashboards to the Kibana index. Loading
# the dashboards is disabled by default and can be enabled either by setting the
# options here or by using the `setup` command.
#setup.dashboards.enabled: false

# The URL from where to download the dashboards archive. By default this URL
# has a value which is computed based on the Beat name and version. For released
# versions, this URL points to the dashboard archive on the artifacts.elastic.co
# website.
#setup.dashboards.url:
# =================================== Kibana ===================================

# Starting with Beats version 6.0.0, the dashboards are loaded via the Kibana API.
# This requires a Kibana endpoint configuration.
setup.kibana:

  # Kibana Host
  # Scheme and port can be left out and will be set to the default (http and 5601)
  # In case you specify and additional path, the scheme is required: http://localhost:5601/path
  # IPv6 addresses should always be defined as: https://[2001:db8::1]:5601
  #host: "localhost:5601"

  # Kibana Space ID
  # ID of the Kibana Space into which the dashboards should be loaded. By default,
  # the Default Space will be used.
  #space.id:

# =============================== Elastic Cloud ================================

# These settings simplify using Filebeat with the Elastic Cloud (https://cloud.elastic.co/).

# The cloud.id setting overwrites the `output.elasticsearch.hosts` and
# `setup.kibana.host` options.
# You can find the `cloud.id` in the Elastic Cloud web UI.
#cloud.id:

# The cloud.auth setting overwrites the `output.elasticsearch.username` and
# `output.elasticsearch.password` settings. The format is `<user>:<pass>`.
#cloud.auth:

# ================================== Outputs ===================================

# Configure what output to use when sending the data collected by the beat.

# ---------------------------- Elasticsearch Output ----------------------------
#output.elasticsearch:
  # Array of hosts to connect to.
# hosts: ["localhost:9200"]

  # Protocol - either `http` (default) or `https`.
  #protocol: "https"

  # Authentication credentials - either API key or username/password.
  #api_key: "id:api_key"
  #username: "elastic"
  #password: "changeme"

# ------------------------------ Logstash Output -------------------------------
output.logstash:
  # The Logstash hosts
  hosts: ["172.16.100.156:5044"]

  # Optional SSL. By default is off.
  # List of root certificates for HTTPS server verifications
  #ssl.certificate_authorities: ["/etc/pki/root/ca.pem"]

 # Certificate for SSL client authentication
  #ssl.certificate: "/etc/pki/client/cert.pem"

  # Client Certificate Key
  #ssl.key: "/etc/pki/client/cert.key"

# ================================= Processors =================================
processors:
  - add_host_metadata:
      when.not.contains.tags: forwarded
  - add_cloud_metadata: ~
  - add_docker_metadata: ~
  - add_kubernetes_metadata: ~

# ================================== Logging ===================================

# Sets log level. The default log level is info.
# Available log levels are: error, warning, info, debug
#logging.level: debug

# At debug level, you can selectively enable logging only for some components.
# To enable all selectors use ["*"]. Examples of other selectors are "beat",
# "publisher", "service".
#logging.selectors: ["*"]

# ============================= X-Pack Monitoring ==============================
# Filebeat can export internal metrics to a central Elasticsearch monitoring
# cluster.  This requires xpack monitoring to be enabled in Elasticsearch.  The
# reporting is disabled by default.

# Set to true to enable the monitoring reporter.
#monitoring.enabled: false

# Sets the UUID of the Elasticsearch cluster under which monitoring data for this
# Filebeat instance will appear in the Stack Monitoring UI. If output.elasticsearch
# is enabled, the UUID is derived from the Elasticsearch cluster referenced by output.elasticsearch.
#monitoring.cluster_uuid:

# Uncomment to send the metrics to Elasticsearch. Most settings from the
# Elasticsearch output are accepted here as well.
# Note that the settings should point to your Elasticsearch *monitoring* cluster.
# Any setting that is not set is automatically inherited from the Elasticsearch
# output configuration, so if you have the Elasticsearch output configured such
# that it is pointing to your Elasticsearch monitoring cluster, you can simply
# uncomment the following line.
#monitoring.elasticsearch:

# ============================== Instrumentation ===============================

# Instrumentation support for the filebeat.
#instrumentation:
    # Set to true to enable instrumentation of filebeat.
 #enabled: false

    # Environment in which filebeat is running on (eg: staging, production, etc.)
    #environment: ""

    # APM Server hosts to report instrumentation results to.
    #hosts:
    #  - http://localhost:8200

    # API Key for the APM Server(s).
    # If api_key is set then secret_token will be ignored.
    #api_key:

    # Secret token for the APM Server(s).
    #secret_token:


# ================================= Migration ==================================

# This allows to enable 6.7 migration aliases
#migration.6_to_7.enabled: true

为开发者提供学习成长、分享交流、生态实践、资源工具等服务,帮助开发者快速成长。
更多推荐


 0
0 0
0- 0


 已为社区贡献2条内容

所有评论(0)