ELK+filebeat日志系统搭建
一、ELK+filebeat系统介绍ELK是指Elasticsearch,Logstash 和 Kibana。集中式日志收集系统,将所有节点上的日志统一收集,管理,访问。ElasticSearch(简称ES),是一个实时的分布式搜索和分析引擎,它可以用于全文搜索,结构化搜索以及分析。Logstash,是一个数据收集引擎,主要用于进行数据收集、解析,并将数据发送给ES。Kibana,为 Elasti
一、ELK+filebeat系统介绍
ELK是指Elasticsearch,Logstash 和 Kibana。集中式日志收集系统,将所有节点上的日志统一收集,管理,访问。
ElasticSearch(简称ES),是一个实时的分布式搜索和分析引擎,它可以用于全文搜索,结构化搜索以及分析。
Logstash,是一个数据收集引擎,主要用于进行数据收集、解析,并将数据发送给ES。
Kibana,为 Elasticsearch 提供了分析和 Web 可视化界面,并生成各种维度表格、图。
Filebeat,一个轻量级日志传输Agent,可以将指定日志转发到Logstash、Elasticsearch、Kafka、Redis等中。Filebeat占用资源少,而且安装配置也比较简单,支持目前各类主流OS及Docker平台。
大致流程图如下: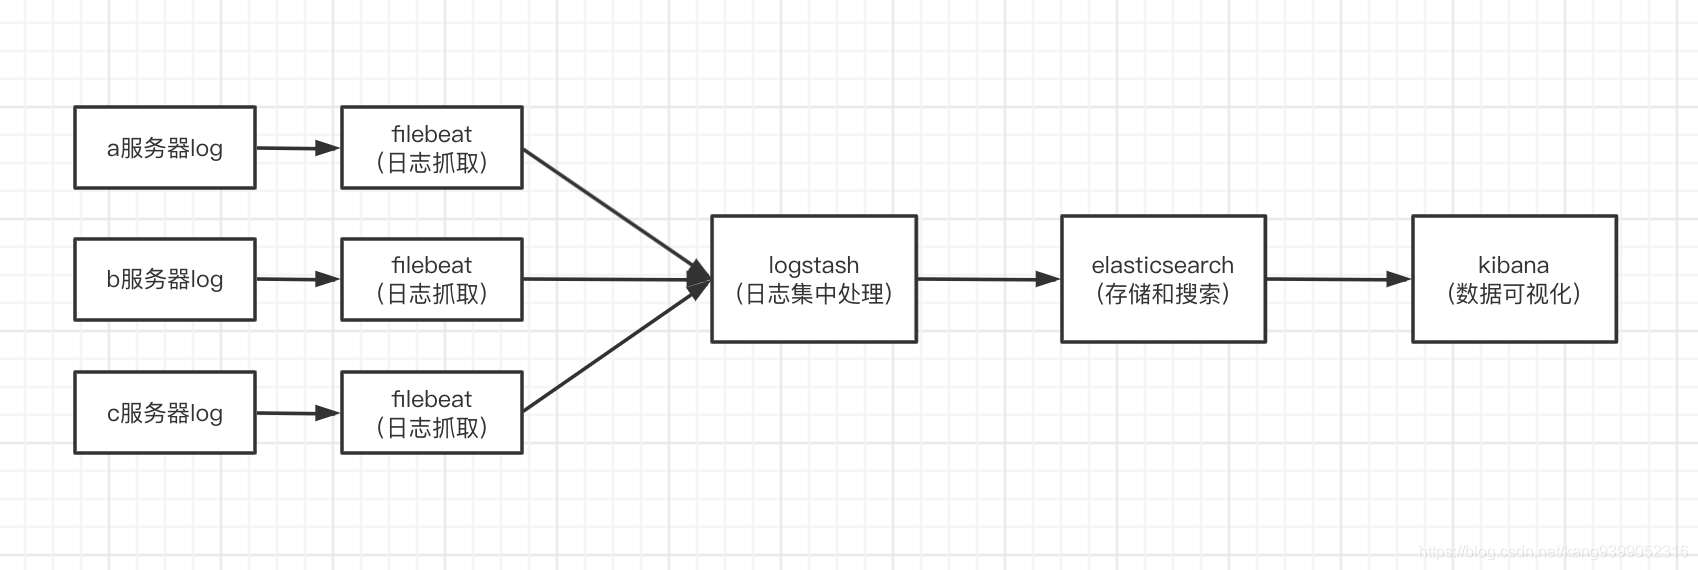
二、搭建
1、服务器环境:
CentOS7.5、JDK1.8、ElasticSearch7.13.2、Logstash 7.13.2、Kibana7.13.2、Filebeat7.13.2
2、安装包下载地址:
filebeat下载地址:
https://artifacts.elastic.co/downloads/beats/filebeat/filebeat-7.13.2-linux-x86_64.tar.gz
elasticsearch下载地址:
https://artifacts.elastic.co/downloads/elasticsearch/elasticsearch-7.13.2-linux-x86_64.tar.gz
logstash下载地址:
https://artifacts.elastic.co/downloads/logstash/logstash-7.13.2-linux-x86_64.tar.gz
kibana下载地址:
https://artifacts.elastic.co/downloads/kibana/kibana-7.13.2-linux-x86_64.tar.gz
3.安装以及配置文件修改
3.1 elasticsearch安装与配置
tar -zxvf lasticsearch-7.13.2-linux-x86_64.tar.gz -C /opt/elk(/opt/elk是我的安装目录,可自行更改)
解压完之后进入/config,编辑elasticsearch.yml
# ---------------------------------- Network -----------------------------------
#
# By default Elasticsearch is only accessible on localhost. Set a different
# address here to expose this node on the network:
#
#network.host: 192.168.0.1
#
# By default Elasticsearch listens for HTTP traffic on the first free port it
# finds starting at 9200. Set a specific HTTP port here:
#
#http.port: 9200
#
# For more information, consult the network module documentation.
#
配置文件里需要注意的是,network.host 默认设置是localhost,运行起来验证的时候外网是访问到不到的,为了方便验证这里可以取消注释,设置成0.0.0.0;http.port默认是9200,如果端口冲突可以取消注释自行修改。
另外,elasticsearch默认是不让root用户启动的,所以我们需要新建一个用户来专门启动elasticsearch,我这里举例创建一个es用户:
创建es用户组:groupadd es
在es用户组下创建es用户:useradd es -g es -p elasticsearch
切换到elk目录:cd /opt/elk
赋予es用户elasticsearch权限:chown -R es:es elasticsearch-7.13.2 chown es asticsearch-7.13.2 -R
后台运行elasticsearch:cd到bin目录,执行以下命令
./elasticsearch -d
3.2 logstash安装与配置
解压完之后进入/config,拷贝一份logstash-sample.conf到bin目录下,方便后面启动:cp logstash-sample.conf …/bin/logstash.conf
编辑刚拷贝到bin目录下的logstash.conf
# Sample Logstash configuration for creating a simple
# Beats -> Logstash -> Elasticsearch pipeline.

input {
  beats {
    port => 5044
  }
}

output {
  elasticsearch {
    hosts => ["http://localhost:9200"]
    index => "%{[@metadata][beat]}-%{[@metadata][version]}-%{+YYYY.MM.dd}"
    #user => "elastic"
    #password => "changeme"
  }
}
可以看到beats里有个port,这是给后面filebeat传输日志留的端口,冲突的话可以自行修改;output是日志输出相关,hosts是之前安装elasticsearch的地址和端口,index是索引名,后面kibana运行起来后我们就能看到输出的索引名,一般是用项目名+时间。
后台运行logstash:cd到bin目录,执行以下命令
nohup ./logstash -f logstash.conf &
3.3kibana安装与配置
一样还是先解压,cd到confi目录,然后编辑配置文件kibana.yml
# Kibana is served by a back end server. This setting specifies the port to use.
#server.port: 5601

# Specifies the address to which the Kibana server will bind. IP addresses and host names are both valid values.
# The default is 'localhost', which usually means remote machines will not be able to connect.
# To allow connections from remote users, set this parameter to a non-loopback address.
server.host: "0.0.0.0"


# Specifies locale to be used for all localizable strings, dates and number formats.
# Supported languages are the following: English - en , by default , Chinese - zh-CN .
i18n.locale: "zh-CN"
可以看到我这里用的是默认端口5601,这里serverhost不能用localhost,不然外网访问不到,在配置文件的最后一行,还可以将系统设置为中文。
kibana也不能使用root用户启动,但是我发现加上–allow-root就可以用root用户启动,elasticsearch适不适用我没有尝试,有试过的小伙伴可以评论交流一下。
启动kibana:cd到kibana/bin目录,执行以下命令
nohup ./kibana --allow-root &
3.4filbeat安装与配置
解压,然后编辑配置文件filebeat.yml
这里配置选择test所有的log文件,并将enable设为true
filebeat.inputs:

# Each - is an input. Most options can be set at the input level, so
# you can use different inputs for various configurations.
# Below are the input specific configurations.

- type: log

  # Change to true to enable this input configuration.
  enabled: true

  # Paths that should be crawled and fetched. Glob based paths.
  paths:
    - /Users/guapikang/logback/test/*.log
    #- c:\programdata\elasticsearch\logs\*
因为解决方案是将日志交给logstash集中处理而不是elesticsearch,所以这里注释掉elesticsearch的配置
# ---------------------------- Elasticsearch Output ----------------------------
# output.elasticsearch:
#   # Array of hosts to connect to.
#   hosts: ["localhost:9200"]

  # Protocol - either `http` (default) or `https`.
  #protocol: "https"

  # Authentication credentials - either API key or username/password.
  #api_key: "id:api_key"
  #username: "elastic"
  #password: "changeme"
配置logstash的地址与端口
# ------------------------------ Logstash Output -------------------------------
output.logstash:
  #The Logstash hosts
  hosts: ["localhost:5044"]

  # Optional SSL. By default is off.
  # List of root certificates for HTTPS server verifications
  #ssl.certificate_authorities: ["/etc/pki/root/ca.pem"]

  # Certificate for SSL client authentication
  #ssl.certificate: "/etc/pki/client/cert.pem"

  # Client Certificate Key
  #ssl.key: "/etc/pki/client/cert.key"
三、启动
1、启动顺序
es=>logstash=>kibana=>filebeat
2、效果展示
配置好kibana索引之后,就可以查看日志了

华为开发者空间,是为全球开发者打造的专属开发空间,汇聚了华为优质开发资源及工具,致力于让每一位开发者拥有一台云主机,基于华为根生态开发、创新。
更多推荐


 2
2 0
0- 0


 已为社区贡献1条内容

所有评论(0)