Prometheus(普罗米修斯)
Prometheus(普罗米修斯)一. Prometheus简介Prometheus是最初在SoundCloud上构建的开源系统监视和警报工具包 。自2012年成立以来,许多公司和组织都采用了Prometheus,该项目拥有非常活跃的开发人员和用户社区。现在,它是一个独立的开源项目,并且独立于任何公司进行维护。为了强调这一点并阐明项目的治理结构,Prometheus 于2016年加入了 Cloud
Prometheus(普罗米修斯)
一. Prometheus简介
Prometheus是最初在SoundCloud上构建的开源系统监视和警报工具包 。自2012年成立以来,许多公司和组织都采用了Prometheus,该项目拥有非常活跃的开发人员和用户社区。现在,它是一个独立的开源项目,并且独立于任何公司进行维护。为了强调这一点并阐明项目的治理结构,Prometheus 于2016年加入了 Cloud Native Computing Foundation,这是继Kubernetes之后的第二个托管项目。
Prometheus 的优点
- 非常少的外部依赖,安装使用超简单
- 已经有非常多的系统集成 例如:docker HAProxy Nginx JMX等等
- 服务自动化发现
- 直接集成到代码
- 设计思想是按照分布式、微服务架构来实现的
Prometheus 的特性
- 一个多维数据模型,其中包含通过度量标准名称和键/值对标识的时间序列数据
- PromQL,一种灵活的查询语言 ,可利用此维度
- 不依赖分布式存储;单服务器节点是自治的
- 时间序列收集通过HTTP上的拉模型进行
- 通过中间网关支持推送时间序列
- 通过服务发现或静态配置发现目标
- 多种图形和仪表板支持模式
组件
Prometheus生态系统包含多个组件,其中许多是可选的:
- Prometheus server ,它会抓取并存储时间序列数据
- client libraries,用于检测应用程序代码
- push gateway,一个支持短期工作的推送网关
- 诸如HAProxy,StatsD,Graphite等服务的专用输出端
- 一个alertmanager处理警报
- 各种支持工具
- the main Prometheus server which scrapes and stores time series data
- client libraries for instrumenting application code
- a push gateway for supporting short-lived jobs
- special-purpose exporters for services like HAProxy, StatsD, Graphite, etc.
- an alertmanager to handle alerts
- various support tools
大多数Prometheus组件都是用Go编写的,因此易于构建和部署为静态二进制文件。
Prometheus原理架构图
下图说明了Prometheus的体系结构及其某些生态系统组件: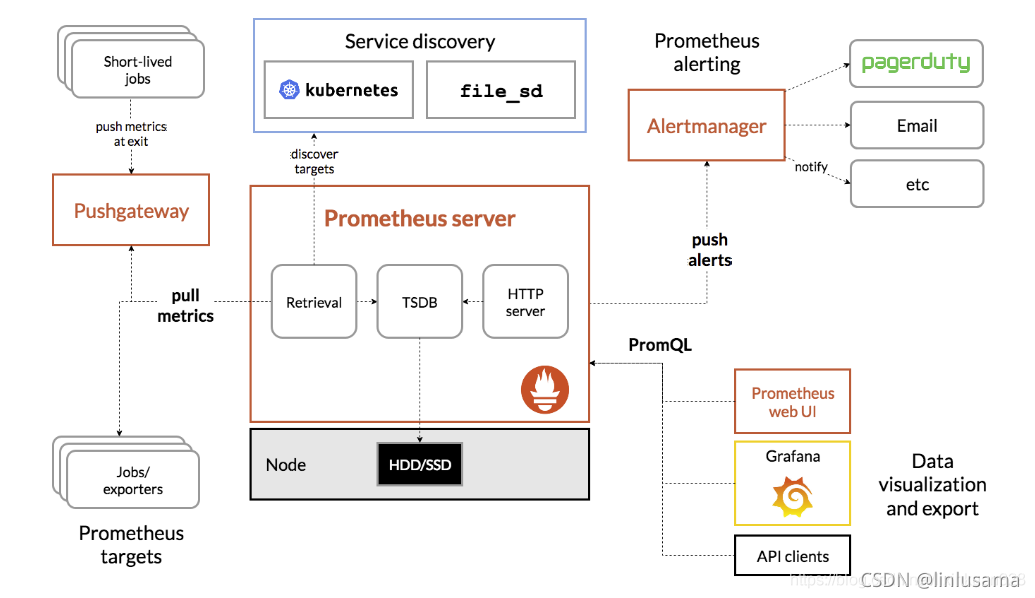
Prometheus直接或通过中介推送网关从已检测作业中删除指标,以处理短暂的作业。它在本地存储所有报废的样本,并对这些数据运行规则,以汇总和记录现有数据中的新时间序列,或生成警报。Grafana或其他API使用者可以用来可视化收集的数据。
什么时候适合?
Prometheus可以很好地记录任何纯数字时间序列。它既适用于以机器为中心的监视,也适用于高度动态的面向服务的体系结构的监视。在微服务世界中,它对多维数据收集和查询的支持是一种特别的优势。
Prometheus的设计旨在提高可靠性,使其成为中断期间要使用的系统,以使您能够快速诊断问题。每个Prometheus服务器都是独立的,而不依赖于网络存储或其他远程服务。当基础结构的其他部分损坏时,您可以依靠它,并且无需设置广泛的基础结构即可使用它。
什么时候不适合?
普罗米修斯重视可靠性。即使在故障情况下,您始终可以查看有关系统的可用统计信息。如果您需要100%的准确性(例如按请求计费),则Prometheus并不是一个好的选择,因为所收集的数据可能不够详细和完整。在这种情况下,最好使用其他系统来收集和分析数据以进行计费,并使用Prometheus进行其余的监视。
二. 安装prometheus
实验环境
| master | 192.168.200.142 | prometheus |
|---|---|---|
| node1 | 192.168.200.147 | node_exporter |
//关闭防火墙
[root@master ~]# systemctl stop firewalld
[root@master ~]# systemctl disable firewalld
[root@master ~]# setenforce 0

//下载软件包
[root@master ~]# wget https://github.com/prometheus/prometheus/releases/download/v2.31.1/prometheus-2.31.1.linux-amd64.tar.gz

//解压
[root@master ~]# tar xf prometheus-2.31.1.linux-amd64.tar.gz -C /usr/local/
[root@master ~]# cd /usr/local/
[root@master local]# mv prometheus-2.31.1.linux-amd64/ prometheus/

//启动 \\9090端口
[root@master prometheus]# /usr/local/prometheus/prometheus --config.file="/usr/local/prometheus/prometheus.yml"
[root@master prod]# ss -antl
State   Recv-Q  Send-Q   Local Address:Port    Peer Address:Port
LISTEN  0       128            0.0.0.0:22           0.0.0.0:*
LISTEN  0       128            0.0.0.0:4505         0.0.0.0:*
LISTEN  0       128            0.0.0.0:4506         0.0.0.0:*
LISTEN  0       128               [::]:22              [::]:*
LISTEN  0       128                  *:9090               *:*
web访问
查看监控主机 默认本机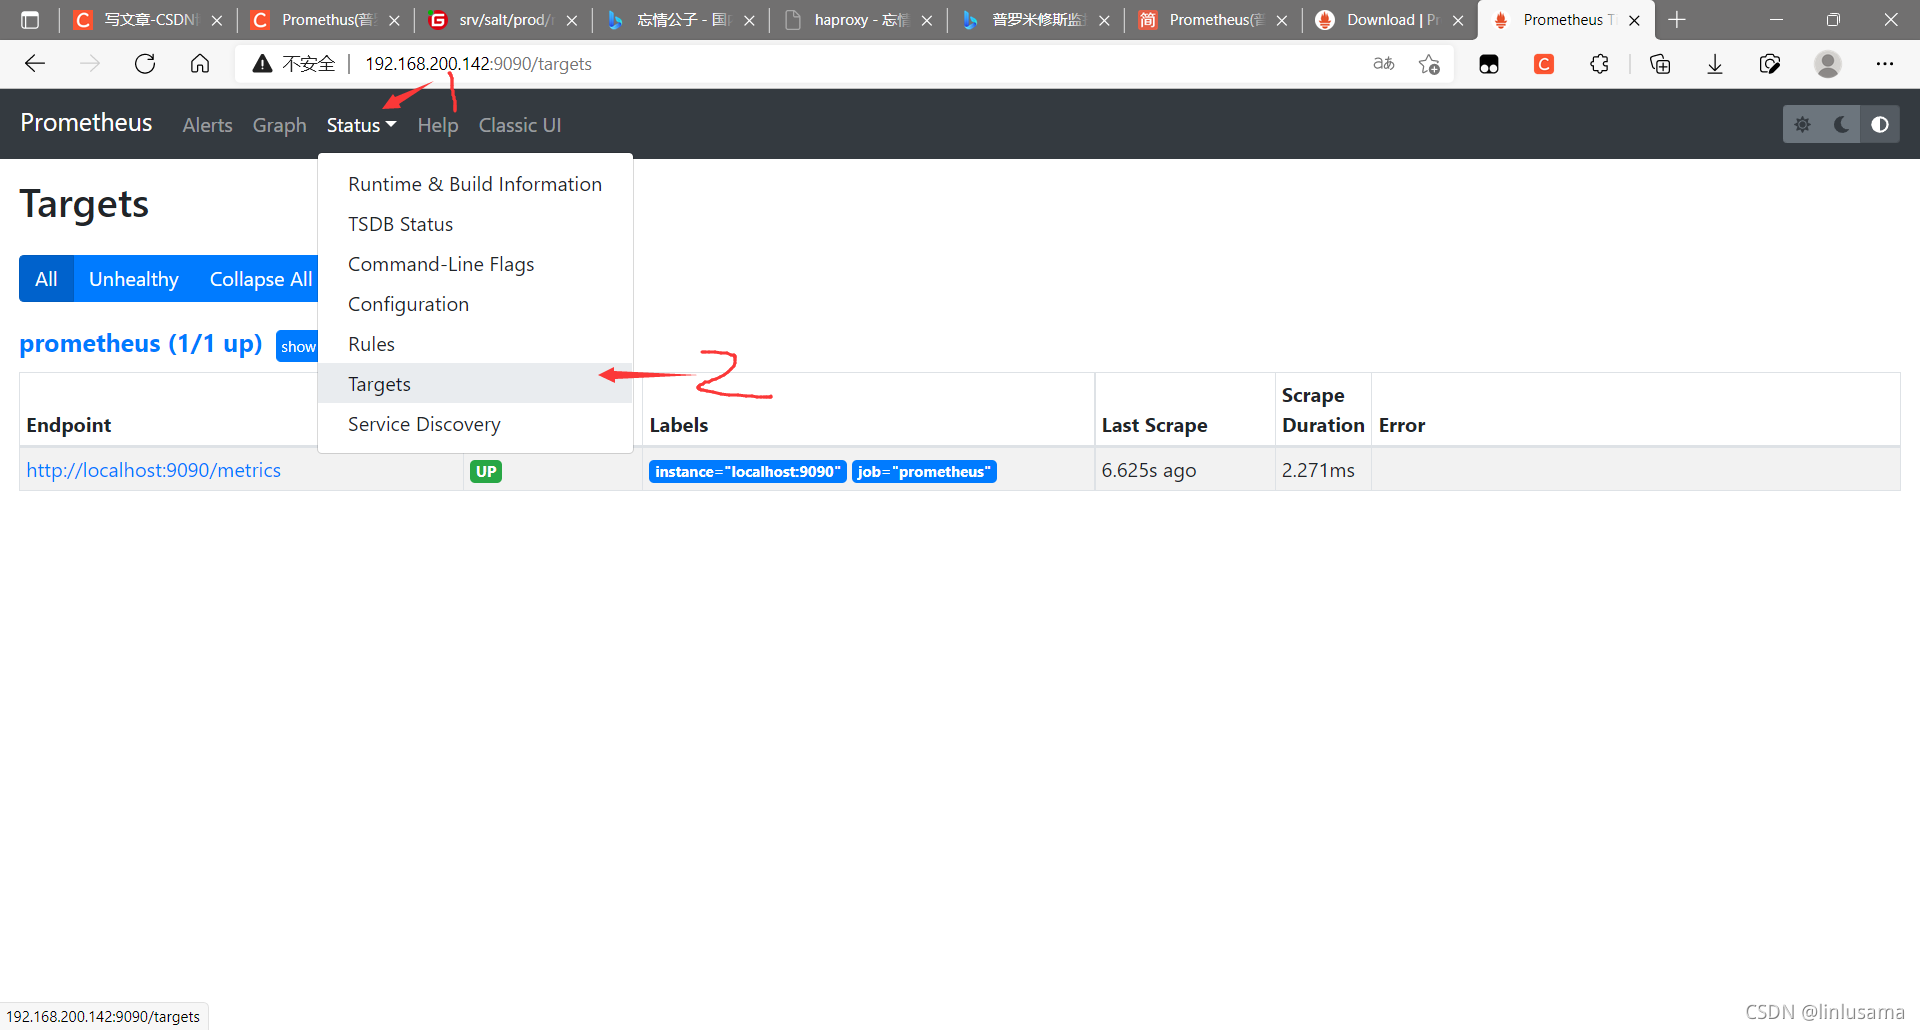
http://192.168.200.142:9090/metrics 查看监控数据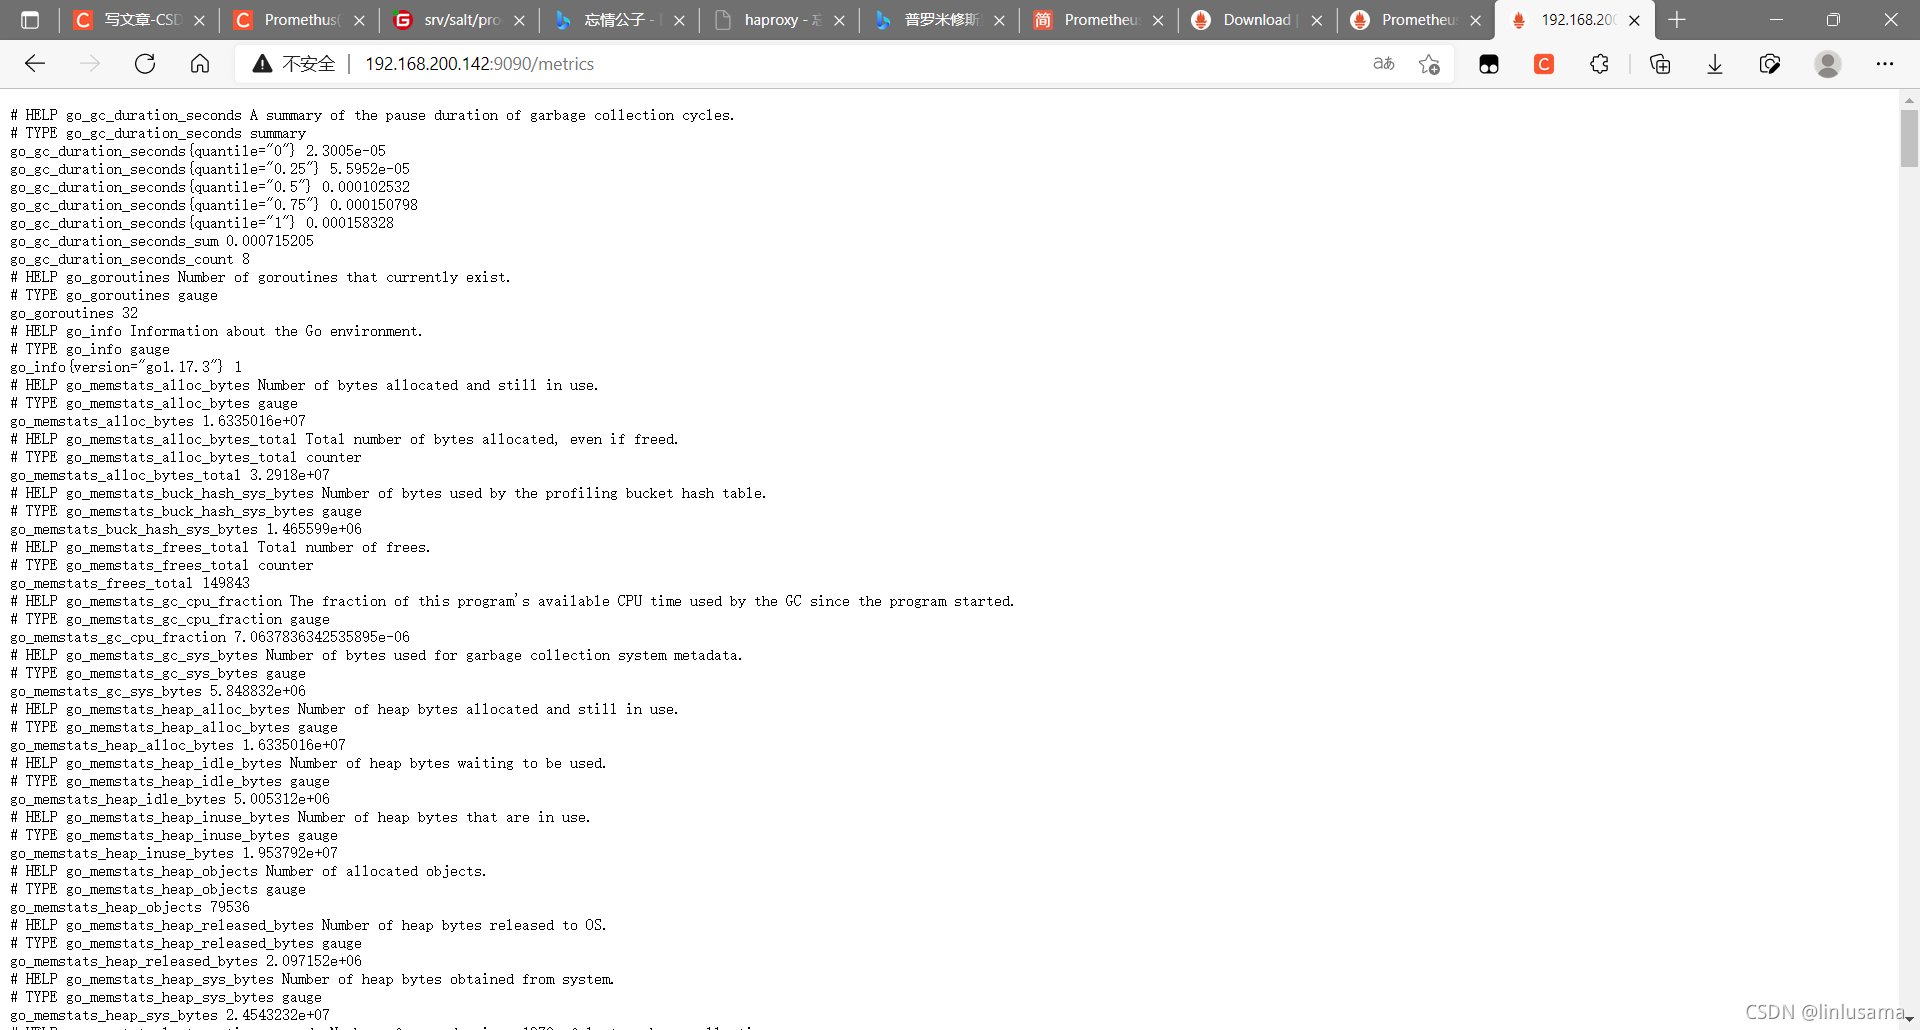
三. 监控远程主机
//安装node_exporter
[root@minion ~]# cd /usr/src/
[root@minion src]# wget https://github.com/prometheus/node_exporter/releases/download/v1.3.0/node_exporter-1.3.0.linux-amd64.tar.gz

//解压
[root@minion src]# tar xf node_exporter-1.3.0.linux-amd64.tar.gz -C /usr/local/
[root@minion src]# cd /usr/local/
[root@minion local]# mv node_exporter-1.3.0.linux-amd64/ node_exporter/

//启动 \\9100端口
[root@minion node_exporter]# nohup /usr/local/node_exporter/node_exporter
[root@minion ~]# ss -antl
State   Recv-Q  Send-Q   Local Address:Port    Peer Address:Port
LISTEN  0       128            0.0.0.0:22           0.0.0.0:*
LISTEN  0       25             0.0.0.0:514          0.0.0.0:*
LISTEN  0       128          127.0.0.1:9000         0.0.0.0:*
LISTEN  0       128            0.0.0.0:6379         0.0.0.0:*
LISTEN  0       128            0.0.0.0:80           0.0.0.0:*
LISTEN  0       128               [::]:22              [::]:*
LISTEN  0       25                [::]:514             [::]:*
LISTEN  0       80                   *:3306               *:*
LISTEN  0       128                  *:9100               *:*
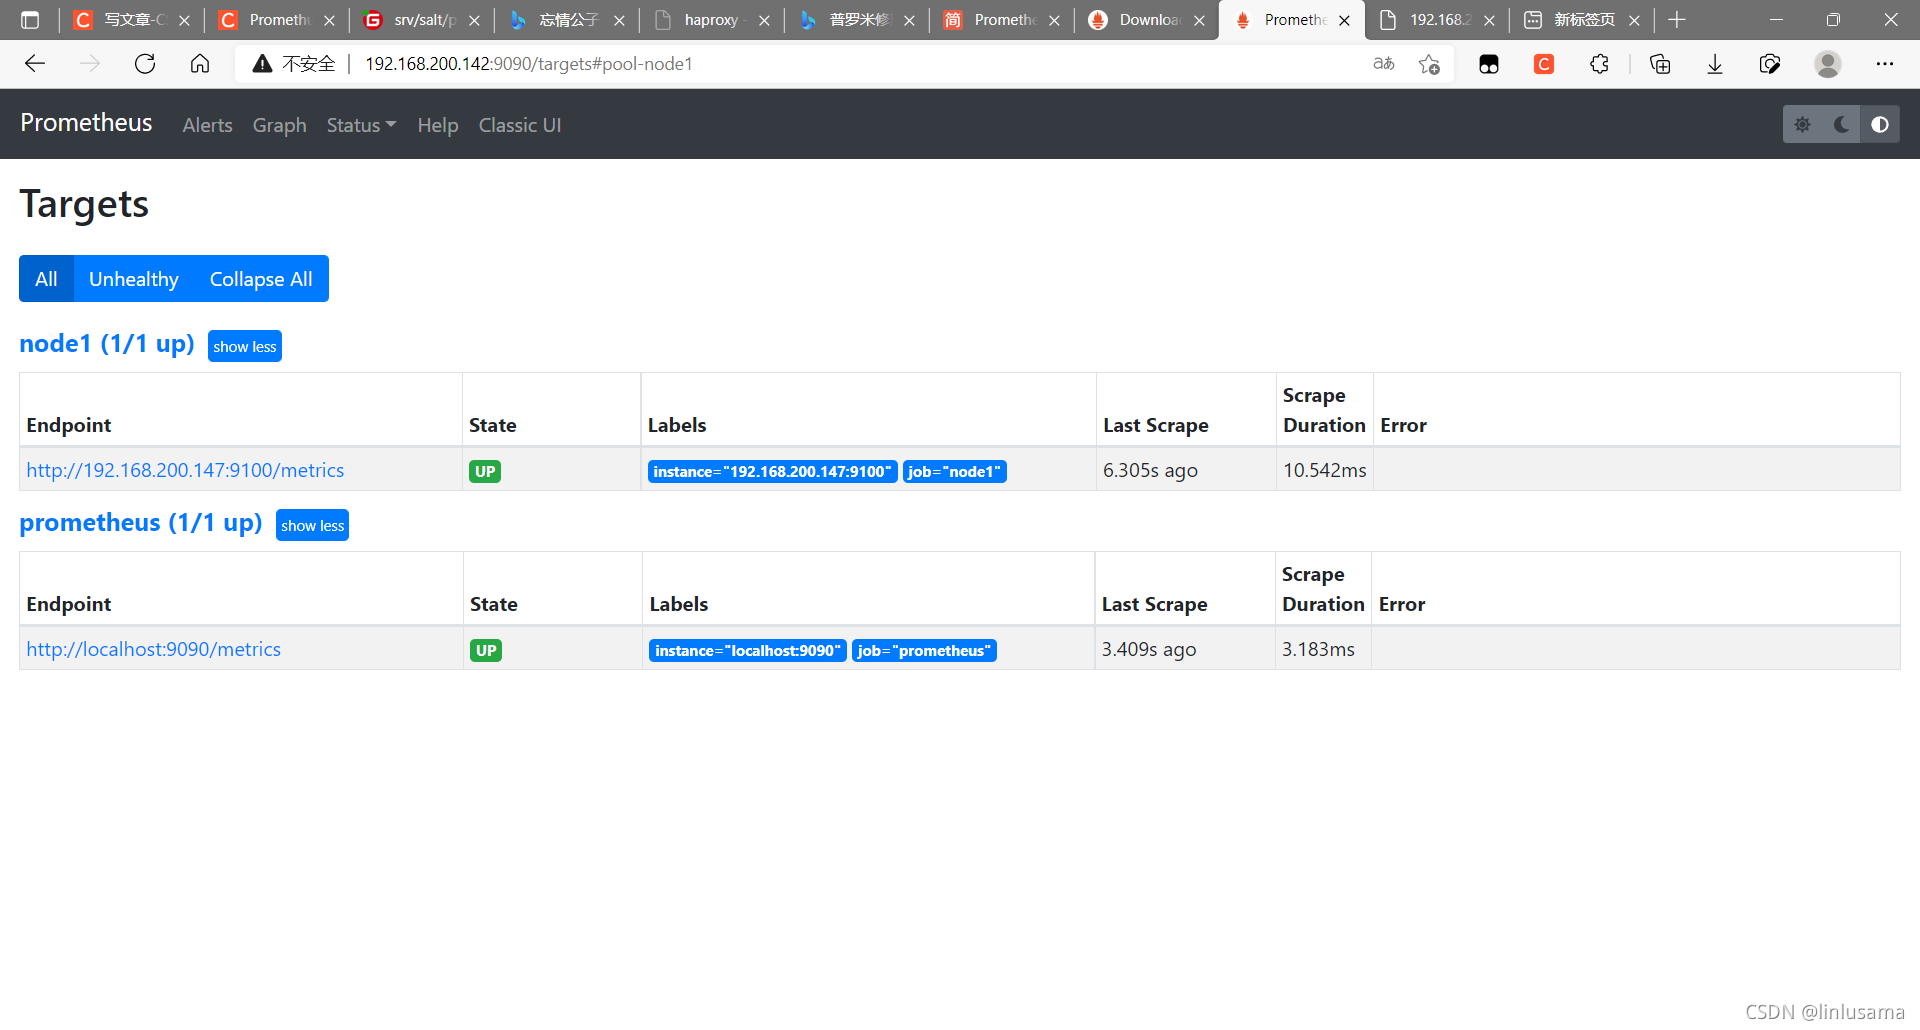
在prometheus配置文件添加受控主机
# The job name is added as a label `job=<job_name>` to any timeseries scraped from this config.
  - job_name: "prometheus"

    # metrics_path defaults to '/metrics'
    # scheme defaults to 'http'.

    static_configs:
      - targets: ["localhost:9090"]

  - job_name: "node1"
    static_configs:
      - targets: ["192.168.200.147:9100"]

//重启服务
[root@master prometheus]# pkill prometheus
[root@master prometheus]# /usr/local/prometheus/prometheus --config.file="/usr/local/prometheus/prometheus.yml"

华为开发者空间,是为全球开发者打造的专属开发空间,汇聚了华为优质开发资源及工具,致力于让每一位开发者拥有一台云主机,基于华为根生态开发、创新。
更多推荐


 0
0 0
0- 0


 已为社区贡献1条内容

所有评论(0)