
elk(Elasticsearch、Kibana、Logstash )有这篇就够了,超级详细,包教会
1、elk介绍elastic中文官网:https://www.elastic.co/cnElasticsearch是一个基于Lucene的搜索服务器。它提供了一个分布式多用户能力的全文搜索引擎,基于RESTful web接口。Elasticsearch是用Java语言开发的,并作为Apache许可条款下的开放源码发布,是一种流行的企业级搜索引擎。Elasticsearch用于云计算中,能够达到实时
目录
1. elk介绍
elastic中文官网:
免费且开放的搜索:Elasticsearch、ELK 和 Kibana 的开发者 | Elastic

Elasticsearch
是一个基于Lucene的搜索服务器。它提供了一个分布式多用户能力的全文搜索引擎,基于RESTful web接口。Elasticsearch是用Java语言开发的,并作为Apache许可条款下的开放源码发布,是一种流行的企业级搜索引擎。Elasticsearch用于云计算中,能够达到实时搜索,稳定,可靠,快速,安装使用方便。官方客户端在Java、.NET(C#)、PHP、Python、Apache Groovy、Ruby和许多其他语言中都是可用的。根据DB-Engines的排名显示,Elasticsearch是最受欢迎的企业搜索引擎,其次是Apache Solr,也是基于Lucene。
Kibana
是一款免费开源的前端应用程序,其基础是 Elastic Stack,可以为 Elasticsearch 中索引的数据提供搜索和数据可视化功能。尽管人们通常将 Kibana 视作 Elastic Stack(之前称作 ELK Stack,分别表示 Elasticsearch、Logstash 和 Kibana)的制图工具,但也可将 Kibana 作为用户界面来监测和管理 Elastic Stack 集群并确保集群安全性,还可将其作为基于 Elastic Stack 所开发内置解决方案的汇集中心。Elasticsearch 社区于 2013 年开发出了 Kibana,现在 Kibana 已发展成为 Elastic Stack 的窗口,是用户和公司的一个门户。
Logstash
是一个轻量级、开源的服务器端数据处理管道,允许您从各种来源收集数据,进行动态转换,并将数据发送到您希望的目标。它最常用作 Elasticsearch 的数据管道,Elasticsearch 是一个开源分析和搜索引擎。由于它与 Elasticsearch 紧密集成,具备强大的日志处理功能并提供 200 多个预构建的开源插件来帮助您轻松地索引数据,因此 Logstash 是将数据加载到 Elasticsearch 的常用工具。
网上的说都太官方了,我用大白话来描述一下这三个是主要的作用是什么,学一个东西首先要记住这几点:
Elasticsearch
1、它是什么东西?
首先介绍一下它是什么东西,Elasticsearch是现在目前最流行的搜索引擎技术,BAT等很多大厂都在使用;
2、它能做什么?
搜索引擎就是把数据放到缓存中,在搜索时能够给快速的检索出来数据;
3、它怎么用?
需要安装和简单的配置上就可以了;
logstash
1、它是什么东西?
是一个数据同步的脚本;
2、它能做什么?
帮我们同步数据,例如:把日志收集到es中
3、它怎么用?
需要安装和简单的配置上就可以了;
kibana
1、它是什么东西?
展示数据,资源监控的程序;拥有很漂亮的ui;
2、它能做什么?
帮我们展示数据;
3、它怎么用?
需要安装和简单的配置上就可以了;
别嫌我啰嗦,学一个东西之前必须要知道这三点,什么东西、能做什么、怎么用,知道清楚这三点之后后面就比较容易理解了。
2. elk安装(windows版)
1、下载地址:下载 Elastic 产品 | Elastic

主要需要下载下面这个三个:

点击下载

选择下载的版本

2、如果下载速度过慢,可以选择国内镜像,中文社区 下载中心 - Elastic 中文社区
点击需要的版本进行下载,可以下翻选择需要的版本;

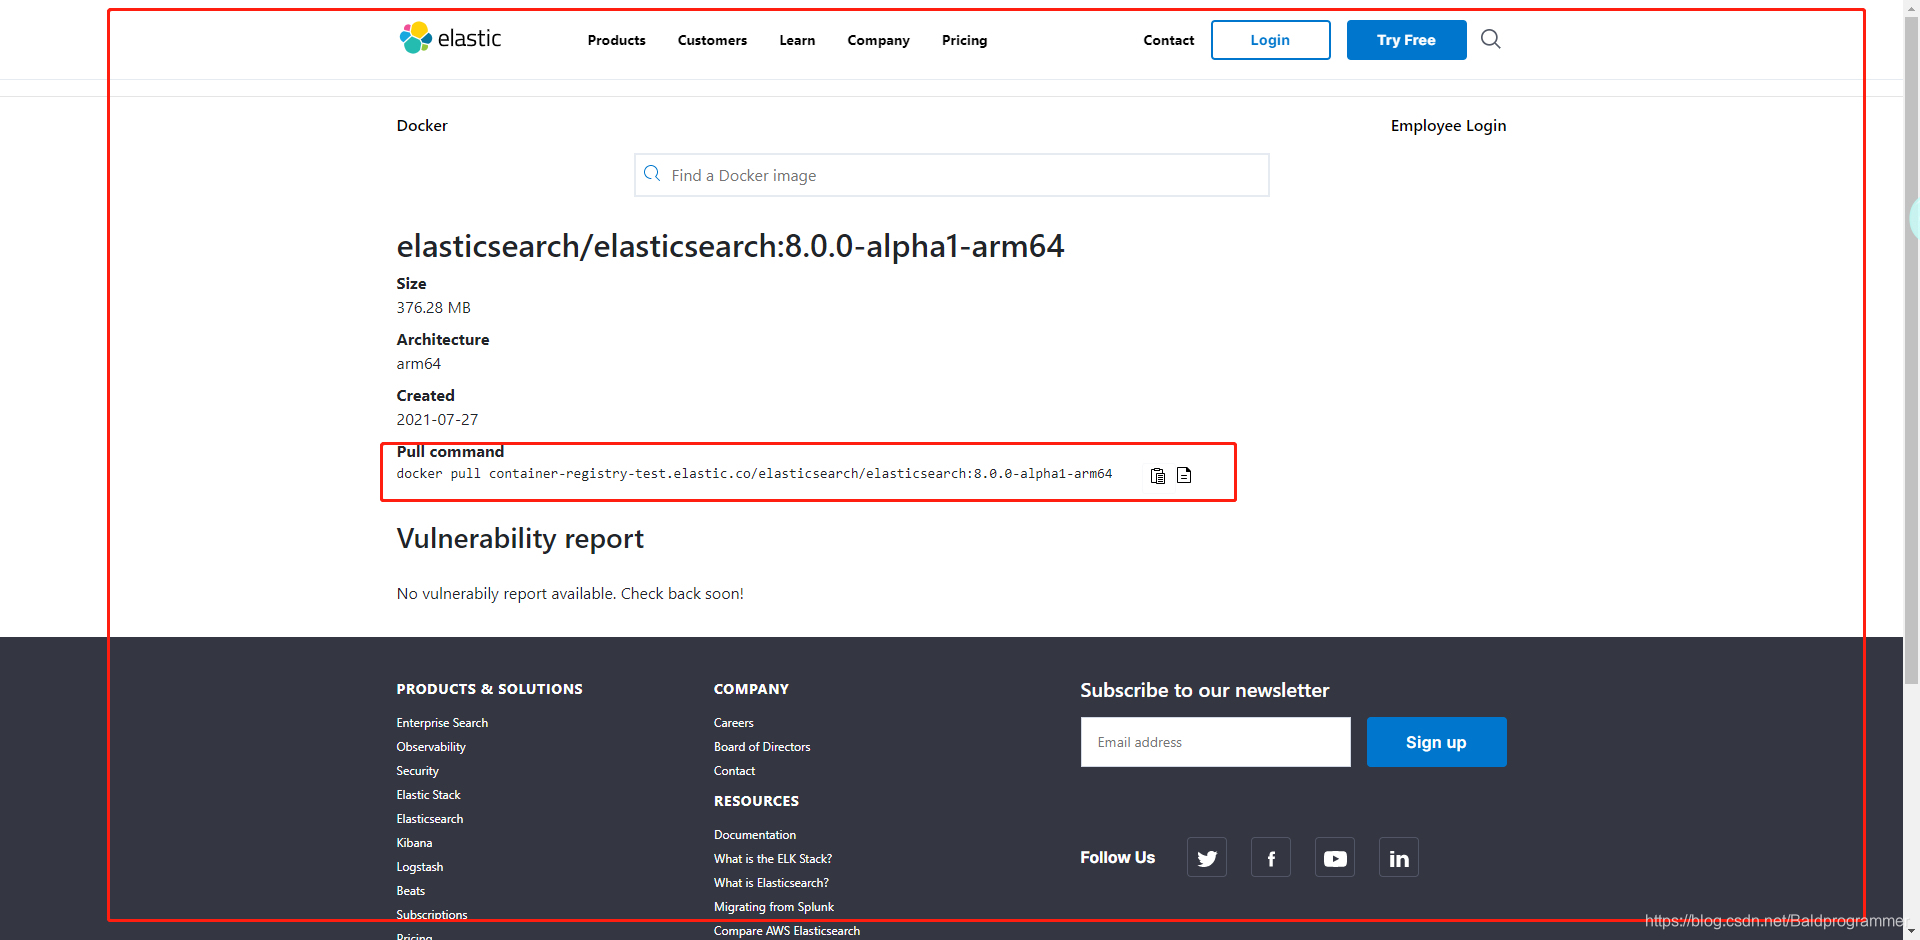
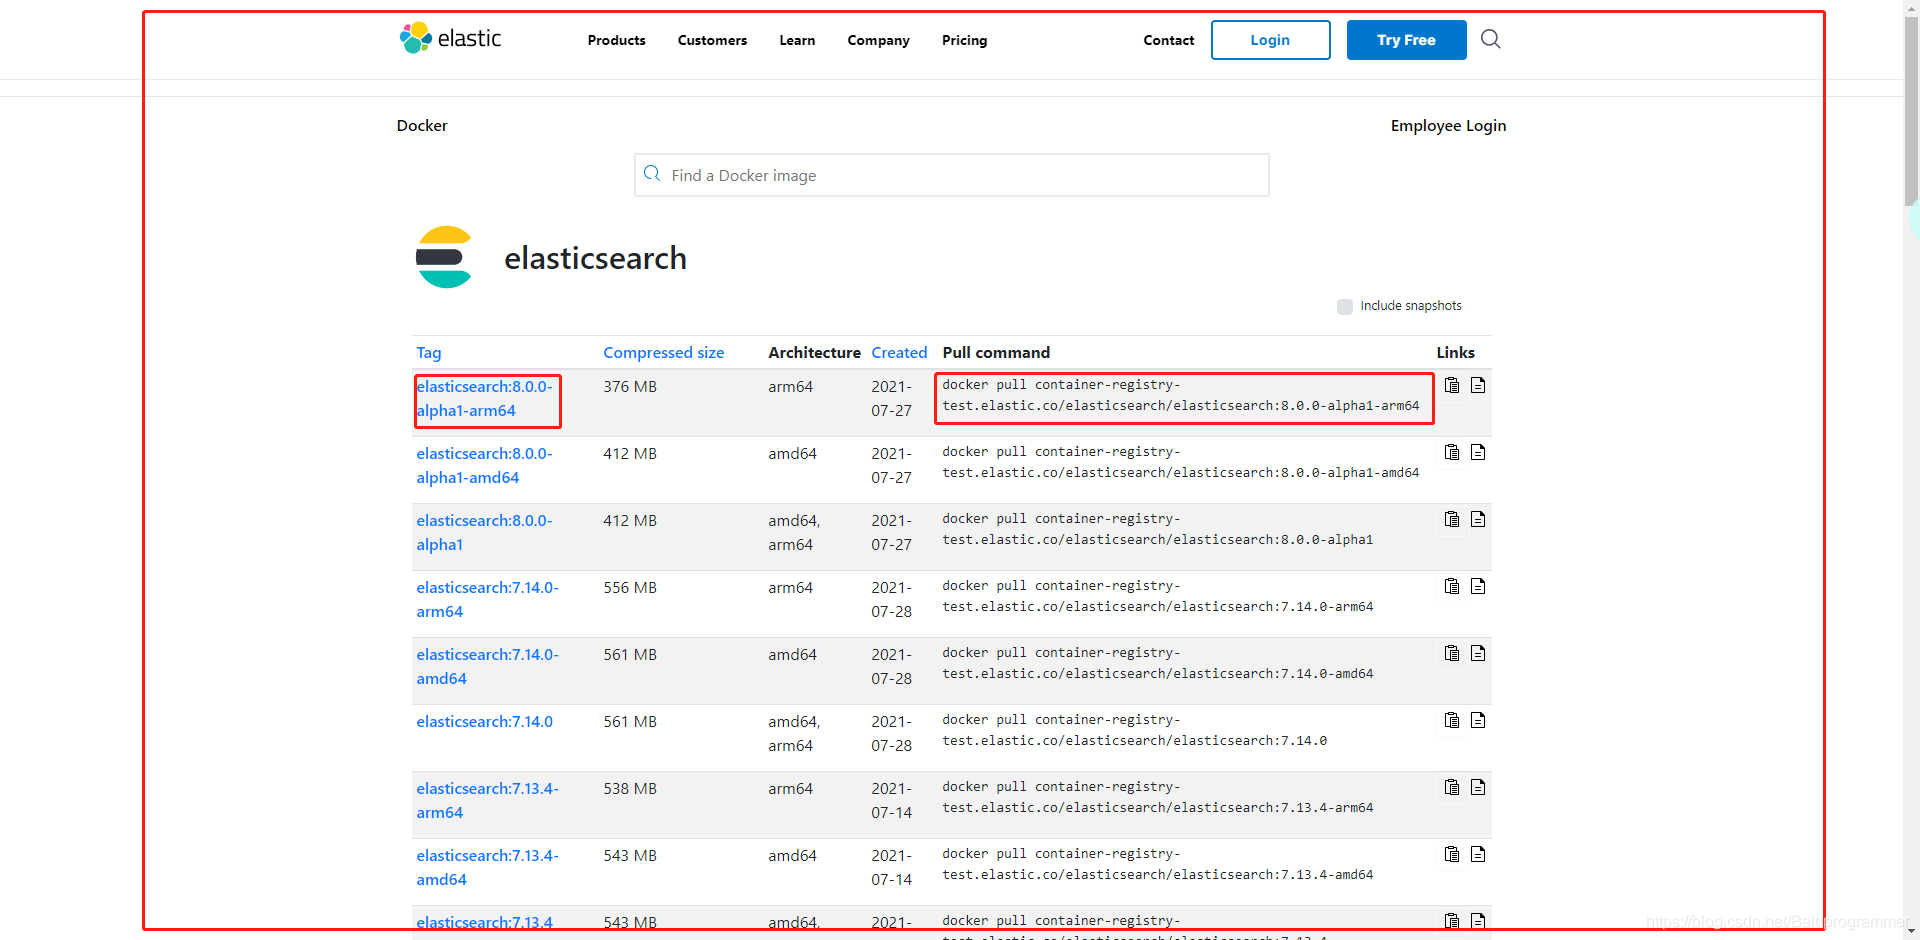
3、如果想要使用docker运行,打开:Docker @ Elastic
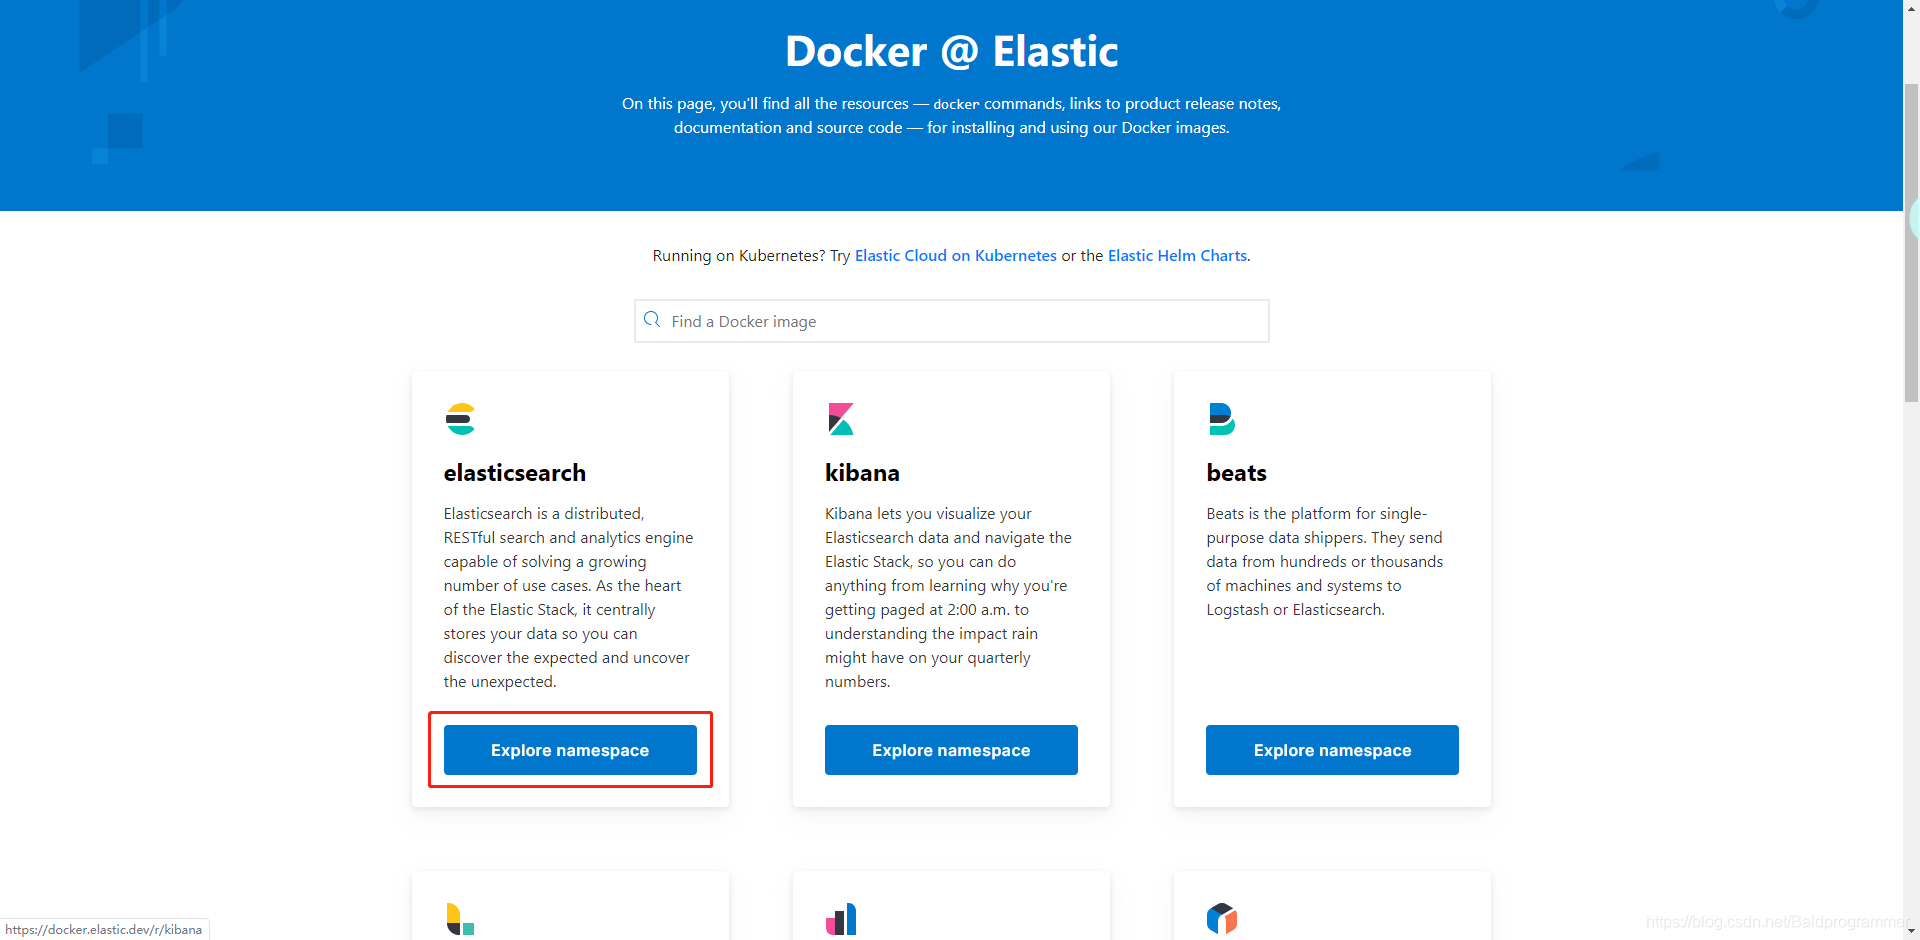
点击蓝色字进去使用里面的命令,或者使用外面的命令拉取镜像

4、如果下载的不顺利或者懒,那就直接百度网盘下载:
```bash

windows版

链接:https://pan.baidu.com/s/1_frZlpRxLcuWC9KqUkgQdg

提取码:good

```
###### 5、安装elk
1、已经获取到了安装包,把安装包放到一个位置,然后解压;

2、修改配置文件,把elk进行关联起来
1)修改elasticsearch-7.13.4配置
目录结构:
看这些目录是不是很熟悉,没错es是用java写的
bin目录:存放批处理文件

cofig目录:存放配置文件

data目录:存放es的数据

jdk目录:存放的就是jdk,因为es会默认带一个jdk

lib目录:存放的就是一些jar包,相当于c或者python中的库

models目录:存放也是一些jar包依赖

plugins目录:存放的是插件,如果需要可以把插件放进去
编辑F:\elk7.13.4\elasticsearch-7.13.4\config\elasticsearch.yml文件

基础配置(也可以先不配置,使用默认的)
#IP

network.host: 192.168.0.101

#端口

http.port: 9200

#日志路径

path.logs: /path/to/logs

#数据路径

path.data: /path/to/data
详细配置
# ======================== Elasticsearch Configuration =========================

#

# NOTE: Elasticsearch comes with reasonable defaults for most settings.

# Before you set out to tweak and tune the configuration, make sure you

# understand what are you trying to accomplish and the consequences.

#

# The primary way of configuring a node is via this file. This template lists

# the most important settings you may want to configure for a production cluster.

#

# Please consult the documentation for further information on configuration options:

# https://www.elastic.co/guide/en/elasticsearch/reference/index.html

#

# ---------------------------------- 集群配置 -----------------------------------

# ---------------------------------- Cluster -----------------------------------

#

# Use a descriptive name for your cluster:

#

#cluster.name: my-application

#

# ------------------------------------ 节点 ------------------------------------

# ------------------------------------ Node ------------------------------------

#

# 为节点使用描述性名称:

# Use a descriptive name for the node:

#

#配置节点名

#node.name: n1

#node.name: n2

#node.name: node-1

#

# 将自定义属性添加到节点

# Add custom attributes to the node:

#

#node.attr.rack: r1

#

# ----------------------------------- 路径 ------------------------------------

# ----------------------------------- Paths ------------------------------------

# 存储数据的目录路径(多个目录用逗号分隔)

# Path to directory where to store the data (separate multiple locations by comma):

#

#数据路径

#path.data: /path/to/data

path.data: /path/to/data

#

# Path to log files:

#

#日志路径

#path.logs: /path/to/logs

path.logs: /path/to/logs

#

# ----------------------------------- 内存 -----------------------------------

# ----------------------------------- Memory -----------------------------------

# 启动时锁定内存

# Lock the memory on startup:

#

#bootstrap.memory_lock: true

# 确保堆大小设置为可用内存的一半左右,并且允许进程的所有者使用此限制。

# Make sure that the heap size is set to about half the memory available

# on the system and that the owner of the process is allowed to use this

# limit.

# 当系统交换内存时,Elasticsearch性能不佳。

# Elasticsearch performs poorly when the system is swapping the memory.

#

# ---------------------------------- 网络 -----------------------------------

# ---------------------------------- Network -----------------------------------

# 默认只能在本机使用,需要配置局域网ip(在内网环境中访问)

# By default Elasticsearch is only accessible on localhost. Set a different

# address here to expose this node on the network:

#

#IP

#network.host: 192.168.0.1

network.host: 192.168.0.101

#

# By default Elasticsearch listens for HTTP traffic on the first free port it

# finds starting at 9200. Set a specific HTTP port here:

#

#端口

#http.port: 9200

http.port: 9200

# For more information, consult the network module documentation.

#

# --------------------------------- 发现 ----------------------------------

# --------------------------------- Discovery ----------------------------------

# 在此节点启动时传递要执行查找的主机的初始列表:

# 主机的默认列表为[“127.0.0.1”、“[::1]”

# Pass an initial list of hosts to perform discovery when this node is started:

# The default list of hosts is ["127.0.0.1", "[::1]"]

#

#配置多个主机去发现

#discovery.seed_主机:[“主机1”、“主机2”]

#discovery.seed_hosts: ["192.168.1.1", "192.168.1.2"]

#discovery.seed_hosts: ["host1", "host2"]

#

# Bootstrap the cluster using an initial set of master-eligible nodes:

#使用初始节点引导集群

#cluster.initial_master_nodes: ["n1", "n2"]

#cluster.initial_master_nodes: ["node-1", "node-2"]

#

# For more information, consult the discovery and cluster formation module documentation.

#

# ---------------------------------- 其他 -----------------------------------

# ---------------------------------- Various -----------------------------------

# 删除索引时需要显式名称

# Require explicit names when deleting indices:

#

#action.destructive_requires_name: true
这里我使用默认配置,什么都不改,启动es(es为elasticsearch简称)

显示如下证明启动成功了

访问

2)修改kibana-7.13.4配置
目录介绍:
kibana是基于node写的,在运行的使用需要node,不过也可以打包html+js
bin目录:存放批处理文件

config目录:存放配置文件

data目录:存放数据文件

node目录:mode启动程序

plugins目录:存放插件

src目录:存放js文件

x-pack目录:作为kibana集成的监控安全共能
配置kibana的配置文件:F:\elk7.13.4\kibana-7.13.4-windows-x86_64\config\kibana.yml

基础配置
# 提供服务的IP

#server.host: "localhost"

# 提供服务的端口

#server.port: 5601

#es服务的地址

#elasticsearch.hosts: ["http://localhost:9200"]
详细配置
# 提供服务的端口

# Kibana is served by a back end server. This setting specifies the port to use.

#server.port: 5601

# 提供服务的IP

# Specifies the address to which the Kibana server will bind. IP addresses and host names are both valid values.

# The default is 'localhost', which usually means remote machines will not be able to connect.

# To allow connections from remote users, set this parameter to a non-loopback address.

#server.host: "localhost"

# 配置代理路径

# Enables you to specify a path to mount Kibana at if you are running behind a proxy.

# Use the `server.rewriteBasePath` setting to tell Kibana if it should remove the basePath

# from requests it receives, and to prevent a deprecation warning at startup.

# This setting cannot end in a slash.

#server.basePath: ""

# 指定Kibana是否应重写前缀为的请求,或要求它们由反向代理重写

# Specifies whether Kibana should rewrite requests that are prefixed with

# `server.basePath` or require that they are rewritten by your reverse proxy.

# This setting was effectively always `false` before Kibana 6.3 and will

# default to `true` starting in Kibana 7.0.

#server.rewriteBasePath: false

# 指定最终用户可以使用Kibana的公共URL。如果

# 已配置“server.basePath”。此URL应以相同的basePath结尾。

# Specifies the public URL at which Kibana is available for end users. If

# `server.basePath` is configured this URL should end with the same basePath.

#server.publicBaseUrl: ""

# 传入服务器请求的最大负载大小(以字节为单位)。

# The maximum payload size in bytes for incoming server requests.

#server.maxPayload: 1048576

# es服务的地址

# The URLs of the Elasticsearch instances to use for all your queries.

#elasticsearch.hosts: ["http://localhost:9200"]

# Kibana在Elasticsearch中使用索引来存储保存的搜索、可视化和仪表盘。如果索引不存在,Kibana将创建一个新索引。

# Kibana uses an index in Elasticsearch to store saved searches, visualizations and

# dashboards. Kibana creates a new index if the index doesn't already exist.

#kibana.index: ".kibana"

# 加载默认应用

# The default application to load.

#kibana.defaultAppId: "home"

# 如果es设置了账号和密码,在下面配置

# If your Elasticsearch is protected with basic authentication, these settings provide

# the username and password that the Kibana server uses to perform maintenance on the Kibana

# index at startup. Your Kibana users still need to authenticate with Elasticsearch, which

# is proxied through the Kibana server.

# 账号

#elasticsearch.username: "kibana_system"

# 密码

#elasticsearch.password: "pass"

# 配置ssl证书和ssl密钥

# Enables SSL and paths to the PEM-format SSL certificate and SSL key files, respectively.

# These settings enable SSL for outgoing requests from the Kibana server to the browser.

#server.ssl.enabled: false

#server.ssl.certificate: /path/to/your/server.crt

#server.ssl.key: /path/to/your/server.key

# 这些文件用于向Elasticsearch验证Kibana的身份,并且在以下情况下是必需的

# Optional settings that provide the paths to the PEM-format SSL certificate and key files.

# These files are used to verify the identity of Kibana to Elasticsearch and are required when

# xpack.security.http.ssl.client_authentication in Elasticsearch is set to required.

#elasticsearch.ssl.certificate: /path/to/your/client.crt

#elasticsearch.ssl.key: /path/to/your/client.key

# 可选设置,允许您为证书指定PEM文件的路径

# Optional setting that enables you to specify a path to the PEM file for the certificate

# authority for your Elasticsearch instance.

#elasticsearch.ssl.certificateAuthorities: [ "/path/to/your/CA.pem" ]

#若要忽略SSL证书的有效性,请将此设置的值更改为“无”。

# To disregard the validity of SSL certificates, change this setting's value to 'none'.

#elasticsearch.ssl.verificationMode: full

#等待Elasticsearch响应ping的时间(毫秒)。默认为的值

# Time in milliseconds to wait for Elasticsearch to respond to pings. Defaults to the value of

# the elasticsearch.requestTimeout setting.

#elasticsearch.pingTimeout: 1500

#等待后端或Elasticsearch响应的时间(毫秒)。此值

#必须是正整数。

# Time in milliseconds to wait for responses from the back end or Elasticsearch. This value

# must be a positive integer.

#elasticsearch.requestTimeout: 30000

#要发送到Elasticsearch的Kibana客户端头列表。发送*否*客户端

#标题,将此值设置为[](空列表)。

# List of Kibana client-side headers to send to Elasticsearch. To send *no* client-side

# headers, set this value to [] (an empty list).

#elasticsearch.requestHeadersWhitelist: [ authorization ]

#发送到Elasticsearch的标题名称和值。无法覆盖任何自定义标题

#通过客户端头,而不考虑elasticsearch.requestHeadersWhitelist配置。

# Header names and values that are sent to Elasticsearch. Any custom headers cannot be overwritten

# by client-side headers, regardless of the elasticsearch.requestHeadersWhitelist configuration.

#elasticsearch.customHeaders: {}

#Elasticsearch等待碎片响应的时间(毫秒)。设置为0以禁用。

#elasticsearch.shardTimeout:30000

# Time in milliseconds for Elasticsearch to wait for responses from shards. Set to 0 to disable.

#elasticsearch.shardTimeout: 30000

#记录发送到Elasticsearch的查询。需要将logging.verbose设置为true

# Logs queries sent to Elasticsearch. Requires logging.verbose set to true.

#elasticsearch.logQueries: false

#指定Kibana创建进程ID文件的路径

# Specifies the path where Kibana creates the process ID file.

#pid.file: /run/kibana/kibana.pid

#允许您指定Kibana存储日志输出的文件

# Enables you to specify a file where Kibana stores log output.

#logging.dest: stdout

#将此设置的值设置为true以抑制所有日志记录输出。

# Set the value of this setting to true to suppress all logging output.

#logging.silent: false

#将此设置的值设置为true以抑制除错误消息以外的所有日志输出。

# Set the value of this setting to true to suppress all logging output other than error messages.

#logging.quiet: false

#将此设置的值设置为true以记录所有事件,包括系统使用信息以及所有的请求。

# Set the value of this setting to true to log all events, including system usage information

# and all requests.

#logging.verbose: false

#设置采样系统和进程性能的间隔(以毫秒为单位)

# Set the interval in milliseconds to sample system and process performance

# metrics. Minimum is 100ms. Defaults to 5000.

#ops.interval: 5000

#指定用于所有可本地化字符串、日期和数字格式的区域设置。

#支持的语言如下:英语-en,默认情况下为中文-zh-CN。

# Specifies locale to be used for all localizable strings, dates and number formats.

# Supported languages are the following: English - en , by default , Chinese - zh-CN .

#i18n.locale: "en"
这里我使用默认配置,然后启动kibana,访问

访问http://localhost:5601/ 显示如下,表示成功

点击 add data添加一些数据

可以看出来支持很多服务日志的收集

为了看起来方便,改配置:i18n.locale: "zh-CN"
重启kibana ctrl+c关闭,然后启动

现在访问就是中文的了

添加数据,感受一下kibana的界面


3)修改logstash-7.13.4配置
目录介绍:
bin目录:存放批处理脚本
目录结构:
看这些目录是不是很熟悉,没错es是用java写的
bin目录:存放批处理文件

cofig目录:存放配置文件

data目录:存放es的数据

jdk目录:存放的就是jdk,因为es会默认带一个jdk

lib目录:存放的就是一些jar包,相当于c或者python中的库

models目录:存放也是一些jar包依赖

plugins目录:存放的是插件,如果需要可以把插件放进去

tools目录:存放自带的工具jar包
编辑F:\elk7.13.4\logstash-7.13.4\config\logstash.yml文件
基础配置
# IP

# http.host: 127.0.0.1

# 端口

# http.port: 9600
详细配置
#可以使用分层形式进行设置

# Settings file in YAML

#

# Settings can be specified either in hierarchical form, e.g.:

#通道

# pipeline:

#批次

# batch:

#大小

# size: 125

#延时

# delay: 5

#

# Or as flat keys:

# #一行一行的配置属性值

# pipeline.batch.size: 125

# pipeline.batch.delay: 5

#

# ------------ 节点标识 ------------

# ------------ Node identity ------------

#

# Use a descriptive name for the node:

# 节点名称

# node.name: test

# 如果省略,节点名称将默认为计算机的主机名

# If omitted the node name will default to the machine's host name

#

# ------------ 数据路径 ------------------

# ------------ Data path ------------------

#

#logstash及其插件应该使用哪个目录对于任何持续的需求。默认为LOGSTASH_HOME/data

# Which directory should be used by logstash and its plugins

# for any persistent needs. Defaults to LOGSTASH_HOME/data

#

# path.data:

#

# ------------ 管道设置 --------------

# ------------ Pipeline Settings --------------

# 管道的ID。

# The ID of the pipeline.

# 管道id:main

# pipeline.id: main

# 设置并行执行过滤器+输出的工作人员数量 管道阶段。

# Set the number of workers that will, in parallel, execute the filters+outputs

# stage of the pipeline.

# 这默认为主机的CPU核心数。

# This defaults to the number of the host's CPU cores.

# 管道工人:2名

# pipeline.workers: 2

# 在发送到筛选器+工作者之前,要从输入中检索多少事件

# How many events to retrieve from inputs before sending to filters+workers

# 管道.批次.尺寸:125

# pipeline.batch.size: 125

# 轮询下一个事件时等待的时间(毫秒)

# How long to wait in milliseconds while polling for the next event

# 在将较小的批次分配到过滤器+输出之前

# before dispatching an undersized batch to filters+outputs

# 管道.批次.延迟:50

# pipeline.batch.delay: 50

# 在停机期间强制Logstash退出记忆中的事件

# 默认情况下,logstash将拒绝退出,直到所有已将接收到的事件推送到输出。

# Force Logstash to exit during shutdown even if there are still inflight

# events in memory. By default, logstash will refuse to quit until all

# received events have been pushed to the outputs.

# 警告:启用此选项可能会导致关机期间数据丢失

# WARNING: enabling this can lead to data loss during shutdown

# pipeline.unsafe_shutdown: false

# 设置管道事件顺序。选项有“自动”(默认)、“真”或“假”。

# Set the pipeline event ordering. Options are "auto" (the default), "true" or "false".

# "auto" will automatically enable ordering if the 'pipeline.workers' setting

# is also set to '1'.

# "true" will enforce ordering on the pipeline and prevent logstash from starting

# if there are multiple workers.

# "false" will disable any extra processing necessary for preserving ordering.

#

pipeline.ordered: auto

#

# ------------ Pipeline Configuration Settings --------------

# ------------ 管道配置设置 --------------

#

# Where to fetch the pipeline configuration for the main pipeline

# 从何处获取主管道的管道配置

# path.config:

# 主管道的管道配置字符串

# Pipeline configuration string for the main pipeline

#

# config.string:

# 启动时,测试配置是否有效并退出(干运行)

# At startup, test if the configuration is valid and exit (dry run)

#

# config.test_and_exit: false

# 定期检查配置是否已更改并重新加载管道这也可以通过SIGHUP信号手动触发

# Periodically check if the configuration has changed and reload the pipeline

# This can also be triggered manually through the SIGHUP signal

#

# config.reload.automatic: false

#

# 不建议以这种方式设置间隔,在以后的版本中可能会更改

# How often to check if the pipeline configuration has changed (in seconds)

# Note that the unit value (s) is required. Values without a qualifier (e.g. 60)

# are treated as nanoseconds.

# Setting the interval this way is not recommended and might change in later versions.

#

# config.reload.interval: 3s

# 将完全编译的配置显示为调试日志消息

# Show fully compiled configuration as debug log message

# NOTE: --log.level must be 'debug'

# 注意:--log.level必须为“调试”

# 是否启动debugger模式

# config.debug: false

#

# 启用时,处理中字符串中的转义字符,如\n和\“

# When enabled, process escaped characters such as \n and \" in strings in the

# pipeline configuration files.

#

# config.support_escapes: false

#

# ------------HTTP API设置 -------------

# ------------ HTTP API Settings -------------

# Define settings related to the HTTP API here.

#

# 默认情况下启用HTTP API。它可以被禁用,但功能依赖于它不会按预期工作。

# The HTTP API is enabled by default. It can be disabled, but features that rely

# on it will not work as intended.

# http.enabled: true

# 默认情况下,HTTP API仅绑定到主机的本地环回接口,确保网络的其余部分无法访问它。因为API

# 既不包括身份验证,也不包括授权,并且尚未加固或删除测试用作可公开访问的API,绑定到可公开访问的IP应尽可能避免。

# By default, the HTTP API is bound to only the host's local loopback interface,

# ensuring that it is not accessible to the rest of the network. Because the API

# includes neither authentication nor authorization and has not been hardened or

# tested for use as a publicly-reachable API, binding to publicly accessible IPs

# should be avoided where possible.

# IP

# http.host: 127.0.0.1

#

# The HTTP API web server will listen on an available port from the given range.

# Values can be specified as a single port (e.g., `9600`), or an inclusive range

# of ports (e.g., `9600-9700`).

# 端口

# http.port: 9600-9700

#

# ------------ 模块设置 ---------------

# ------------ Module Settings ---------------

#在这里定义模块。模块定义必须定义为数组。

#查看这一点的简单方法是在每个'name'前面加上一个'-',并保留

#与之关联的`name`下的所有关联变量,以及

#在下一个上面,像这样:

# Define modules here. Modules definitions must be defined as an array.

# The simple way to see this is to prepend each `name` with a `-`, and keep

# all associated variables under the `name` they are associated with, and

# above the next, like this:

#

# modules:

# - name: MODULE_NAME

# var.PLUGINTYPE1.PLUGINNAME1.KEY1: VALUE

# var.PLUGINTYPE1.PLUGINNAME1.KEY2: VALUE

# var.PLUGINTYPE2.PLUGINNAME1.KEY1: VALUE

# var.PLUGINTYPE3.PLUGINNAME3.KEY1: VALUE

#

# Module variable names must be in the format of

#

# var.PLUGIN_TYPE.PLUGIN_NAME.KEY

#

# modules:

#

# ------------ 云设置 ---------------

# ------------ Cloud Settings ---------------

# Define Elastic Cloud settings here.

# cloud.id的格式为base64值,例如dXMtZWFzdC0xLmF3cy5mb3VuZC5pbyRub3RhcmVhbCRpZGVudGlmaWVy

# Format of cloud.id is a base64 value e.g. dXMtZWFzdC0xLmF3cy5mb3VuZC5pbyRub3RhcmVhbCRpZGVudGlmaWVy

# and it may have an label prefix e.g. staging:dXMtZ...

# 它可能有一个标签前缀,例如staging:dXMtZ。。。

# This will overwrite 'var.elasticsearch.hosts' and 'var.kibana.host'

# cloud.id:

#

# Format of cloud.auth is: :

# This is optional

# 如果提供,这将覆盖“var.elasticsearch.username”和“var.elasticsearch.password”

# If supplied this will overwrite 'var.elasticsearch.username' and 'var.elasticsearch.password'

# If supplied this will overwrite 'var.kibana.username' and 'var.kibana.password'

# cloud.auth: elastic:

#

# ------------ 队列设置 --------------

# ------------ Queuing Settings --------------

# 可以配置在硬盘或者内存中执行,默认为内存

# Internal queuing model, "memory" for legacy in-memory based queuing and

# "persisted" for disk-based acked queueing. Defaults is memory

#

# queue.type: memory

#

# 如果类型(queue.type)使用硬盘,此路径(path.queue:)则为数据文件的目录

# If using queue.type: persisted, the directory path where the data files will be stored.

# Default is path.data/queue

#

# path.queue:

#

# If using queue.type: persisted, the page data files size. The queue data consists of

# append-only data files separated into pages. Default is 64mb

# 仅追加分隔为页面的数据文件。默认值为64mb

# queue.page_capacity: 64mb

# 如果使用queue.type:persistend,则为队列中未读事件的最大数量。

# If using queue.type: persisted, the maximum number of unread events in the queue.

# Default is 0 (unlimited)

#

# queue.max_events: 0

#

#

# If using queue.type: persisted, the total capacity of the queue in number of bytes.

# If you would like more unacked events to be buffered in Logstash, you can increase the

# capacity using this setting. Please make sure your disk drive has capacity greater than

# the size specified here. If both max_bytes and max_events are specified, Logstash will pick

# whichever criteria is reached first

# Default is 1024mb or 1gb

# 队列容量

# queue.max_bytes: 1024mb

#

# If using queue.type: persisted, the maximum number of acked events before forcing a checkpoint

# Default is 1024, 0 for unlimited

# 强制检查点之前已确认的最大事件数

# queue.checkpoint.acks: 1024

#

# If using queue.type: persisted, the maximum number of written events before forcing a checkpoint

# Default is 1024, 0 for unlimited

# 则为强制检查点之前写入的最大事件数 默认值为1024,0表示无限制

# queue.checkpoint.writes: 1024

#

# If using queue.type: persisted, the interval in milliseconds when a checkpoint is forced on the head page

# Default is 1000, 0 for no periodic checkpoint.

# 如果使用queue.type:persisted,则在头页上强制设置检查点的间隔(以毫秒为单位)默认值为1000,0表示无定期检查点。

# queue.checkpoint.interval: 1000

#

# ------------ 死信队列设置 --------------

# ------------ Dead-Letter Queue Settings --------------

# Flag to turn on dead-letter queue.

# 死信队列。启用:false

# dead_letter_queue.enable: false

# 如果使用死信队列。enable:true,每个死信队列的最大大小。条目

# If using dead_letter_queue.enable: true, the maximum size of each dead letter queue. Entries

# 如果将死信队列的大小增加到超出此设置,则将删除

# will be dropped if they would increase the size of the dead letter queue beyond this setting.

# #默认值为1024mb

# Default is 1024mb

# 死信队列。最大字节数:1024mb

# dead_letter_queue.max_bytes: 1024mb

# 如果使用dead_letter_queue.enable:true,如果没有符合DLQ条件的其他事件,则间隔(以毫秒为单位)

# 创建后,将写入死信队列文件。这里的值越低,意味着队列文件越多、越小

# 可以写入,而较大的值将在“写入”死信队列的项目之间引入更多延迟,并且

# 当项目不经常写入时,死信队列输入可以读取。

# 默认值为5000。

# If using dead_letter_queue.enable: true, the interval in milliseconds where if no further events eligible for the DLQ

# have been created, a dead letter queue file will be written. A low value here will mean that more, smaller, queue files

# may be written, while a larger value will introduce more latency between items being "written" to the dead letter queue, and

# being available to be read by the dead_letter_queue input when items are are written infrequently.

# Default is 5000.

# 死信队列。刷新间隔:5000

# dead_letter_queue.flush_interval: 5000

# 如果使用dead_letter_queue.enable:true,则为存储数据文件的目录路径。

# If using dead_letter_queue.enable: true, the directory path where the data files will be stored.

# Default is path.data/dead_letter_queue

#

# path.dead_letter_queue:

#

# ------------- 指标设置 --------------

# ------------ Metrics Settings --------------

#

# Bind address for the metrics REST endpoint

# IP

# http.host: "127.0.0.1"

#

# Bind port for the metrics REST endpoint, this option also accept a range

# (9600-9700) and logstash will pick up the first available ports.

# 端口

# http.port: 9600-9700

#

# ------------ 调试设置 --------------

# ------------ Debugging Settings --------------

# 启动模式

# Options for log.level:

# * fatal

# * error

# * warn

# * info (default)

# * debug

# * trace

# 日志级别

# log.level: info

# path.logs:

#

# ------------ 其他设置 --------------

# ------------ Other Settings --------------

# 在哪里可以找到自定义插件

# Where to find custom plugins

# path.plugins: []

#

# 在单独的日志文件中输出每个管道的日志行的标志。每个日志文件名都包含pipeline.name默认值为false

# Flag to output log lines of each pipeline in its separate log file. Each log filename contains the pipeline.name

# Default is false

# pipeline.separate_logs: false

#

# X-Pack设置(不适用于OSS构建)

# ------------ X-Pack Settings (not applicable for OSS build)--------------

# X-Pack监控

# X-Pack Monitoring

# https://www.elastic.co/guide/en/logstash/current/monitoring-logstash.html

#xpack.monitoring.enabled: false

#xpack.monitoring.elasticsearch.username: logstash_system

#xpack.monitoring.elasticsearch.password: password

#xpack.monitoring.elasticsearch.proxy: ["http://proxy:port"]

#xpack.monitoring.elasticsearch.hosts: ["https://es1:9200", "https://es2:9200"]

# 主机+用户名/密码设置的替代方法是使用

# an alternative to hosts + username/password settings is to use cloud_id/cloud_auth

#xpack.monitoring.elasticsearch.cloud_id: monitoring_cluster_id:xxxxxxxxxx

#xpack.monitoring.elasticsearch.cloud_auth: logstash_system:password

# 另一种身份验证方法是使用Elasticsearch API密钥

# another authentication alternative is to use an Elasticsearch API key

#xpack.monitoring.elasticsearch.api_key: "id:api_key"

#xpack.monitoring.elasticsearch.ssl.certificate_authority: [ "/path/to/ca.crt" ]

#xpack.monitoring.elasticsearch.ssl.truststore.path: path/to/file

#xpack.monitoring.elasticsearch.ssl.truststore.password: password

#xpack.monitoring.elasticsearch.ssl.keystore.path: /path/to/file

#xpack.monitoring.elasticsearch.ssl.keystore.password: password

#xpack.monitoring.elasticsearch.ssl.verification_mode: certificate

#xpack.monitoring.elasticsearch.sniffing: false

#xpack.monitoring.collection.interval: 10s

#xpack.monitoring.collection.pipeline.details.enabled: true

# X-Pack管理

# X-Pack Management

# https://www.elastic.co/guide/en/logstash/current/logstash-centralized-pipeline-management.html

#xpack.management.enabled: false

#xpack.management.pipeline.id: ["main", "apache_logs"]

#xpack.management.elasticsearch.username: logstash_admin_user

#xpack.management.elasticsearch.password: password

#xpack.management.elasticsearch.proxy: ["http://proxy:port"]

#xpack.management.elasticsearch.hosts: ["https://es1:9200", "https://es2:9200"]

# 主机+用户名/密码设置的替代方法是使用

# an alternative to hosts + username/password settings is to use cloud_id/cloud_auth

#xpack.management.elasticsearch.cloud_id: management_cluster_id:xxxxxxxxxx

#xpack.management.elasticsearch.cloud_auth: logstash_admin_user:password

# 另一种身份验证方法是使用Elasticsearch API密钥

# another authentication alternative is to use an Elasticsearch API key

#xpack.management.elasticsearch.api_key: "id:api_key"

#xpack.management.elasticsearch.ssl.certificate_authority: [ "/path/to/ca.crt" ]

#xpack.management.elasticsearch.ssl.truststore.path: /path/to/file

#xpack.management.elasticsearch.ssl.truststore.password: password

#xpack.management.elasticsearch.ssl.keystore.path: /path/to/file

#xpack.management.elasticsearch.ssl.keystore.password: password

#xpack.management.elasticsearch.ssl.verification_mode: certificate

#xpack.management.elasticsearch.sniffing: false

#xpack.management.logstash.poll_interval: 5s
3、需要注意注意启动顺序:
es ——》 logstash ——》 kibana
3. elk安装(linux版)
1、下载地址:下载 Elastic 产品 | Elastic

主要需要下载下面这个三个:

点击下载

选择下载的版本

2、如果下载速度过慢,可以选择国内镜像,中文社区 下载中心 - Elastic 中文社区
点击需要的版本进行下载,可以下翻选择需要的版本;

3、如果想要使用docker运行,打开:Docker @ Elastic

点击蓝色字进去使用里面的命令,或者使用外面的命令拉取镜像

4、如果下载的不顺利或者懒,那就直接百度网盘下载:
linux版

链接:https://pan.baidu.com/s/1K0946mrLk40aRsY7RtiIjg

提取码:good
5、安装elk
首先创建用户组和用户(因为es不可以使用root用户启动)
groupadd es
useradd es -g es
passwd es
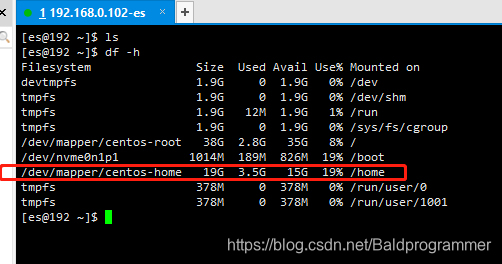
![]()

1、df -h #查看是否可用的位置,或者是否有足够的空间
2、 创建elk目录,进入elk目录
mkdir elk
cd elk
3、把下载下来的安装包放到elk目录

4、解压安装包 (或者使用for tar in *.tar.gz; do tar xvf $tar; done解压所有gz包)
tar -zvxf elasticsearch-7.13.4-linux-x86_64.tar.gz
tar -zvxf kibana-7.13.4-linux-x86_64.tar.gz
tar -zvxf logstash-7.13.4-linux-x86_64.tar.gz
5、修改配置文件启动es
1)进入es目录
cd elasticsearch-7.13.4/config
vim elasticsearch.yml #如果没有vim命令可以使用vi命令或者yum install vim 安装
基础配置
#IP

network.host: 192.168.0.101

#端口

http.port: 9200

#日志路径

path.logs: /path/to/logs

#数据路径

path.data: /path/to/data
详细配置
# ======================== Elasticsearch Configuration =========================

#

# NOTE: Elasticsearch comes with reasonable defaults for most settings.

# Before you set out to tweak and tune the configuration, make sure you

# understand what are you trying to accomplish and the consequences.

#

# The primary way of configuring a node is via this file. This template lists

# the most important settings you may want to configure for a production cluster.

#

# Please consult the documentation for further information on configuration options:

# https://www.elastic.co/guide/en/elasticsearch/reference/index.html

#

# ---------------------------------- 集群配置 -----------------------------------

# ---------------------------------- Cluster -----------------------------------

#

# Use a descriptive name for your cluster:

#

#cluster.name: my-application

#

# ------------------------------------ 节点 ------------------------------------

# ------------------------------------ Node ------------------------------------

#

# 为节点使用描述性名称:

# Use a descriptive name for the node:

#

#配置节点名

#node.name: n1

#node.name: n2

#node.name: node-1

#

# 将自定义属性添加到节点

# Add custom attributes to the node:

#

#node.attr.rack: r1

#

# ----------------------------------- 路径 ------------------------------------

# ----------------------------------- Paths ------------------------------------

# 存储数据的目录路径(多个目录用逗号分隔)

# Path to directory where to store the data (separate multiple locations by comma):

#

#数据路径

#path.data: /path/to/data

path.data: /path/to/data

#

# Path to log files:

#

#日志路径

#path.logs: /path/to/logs

path.logs: /path/to/logs

#

# ----------------------------------- 内存 -----------------------------------

# ----------------------------------- Memory -----------------------------------

# 启动时锁定内存

# Lock the memory on startup:

#

#bootstrap.memory_lock: true

# 确保堆大小设置为可用内存的一半左右,并且允许进程的所有者使用此限制。

# Make sure that the heap size is set to about half the memory available

# on the system and that the owner of the process is allowed to use this

# limit.

# 当系统交换内存时,Elasticsearch性能不佳。

# Elasticsearch performs poorly when the system is swapping the memory.

#

# ---------------------------------- 网络 -----------------------------------

# ---------------------------------- Network -----------------------------------

# 默认只能在本机使用,需要配置局域网ip(在内网环境中访问)

# By default Elasticsearch is only accessible on localhost. Set a different

# address here to expose this node on the network:

#

#IP

#network.host: 192.168.0.1

network.host: 192.168.0.101

#

# By default Elasticsearch listens for HTTP traffic on the first free port it

# finds starting at 9200. Set a specific HTTP port here:

#

#端口

#http.port: 9200

http.port: 9200

# For more information, consult the network module documentation.

#

# --------------------------------- 发现 ----------------------------------

# --------------------------------- Discovery ----------------------------------

# 在此节点启动时传递要执行查找的主机的初始列表:

# 主机的默认列表为[“127.0.0.1”、“[::1]”

# Pass an initial list of hosts to perform discovery when this node is started:

# The default list of hosts is ["127.0.0.1", "[::1]"]

#

#配置多个主机去发现

#discovery.seed_主机:[“主机1”、“主机2”]

#discovery.seed_hosts: ["192.168.1.1", "192.168.1.2"]

#discovery.seed_hosts: ["host1", "host2"]

#

# Bootstrap the cluster using an initial set of master-eligible nodes:

#使用初始节点引导集群

#cluster.initial_master_nodes: ["n1", "n2"]

#cluster.initial_master_nodes: ["node-1", "node-2"]

#

# For more information, consult the discovery and cluster formation module documentation.

#

# ---------------------------------- 其他 -----------------------------------

# ---------------------------------- Various -----------------------------------

# 删除索引时需要显式名称

# Require explicit names when deleting indices:

#

#action.destructive_requires_name: true
把ip和端口的注释打开,修改ip为内网ip

添加配置:
node.name: node-1
进入 es目录,启动es发现jdk找不到

安装JDK(如果启动不报错,或者已经安装省略这一步)
链接:https://pan.baidu.com/s/1PvT39Sa2O2YQBZ5PPLp2xg

提取码:good
放到es目录解压
tar -zvxf jdk-8u65-linux-x64.tar.gz
配置环境变量 编辑profile文件()添加如下:
JAVA_HOME=/home/es/jdk1.8.0_65
export PATH=$JAVA_HOME/bin:$PATH

测试是否可用 java --version

启动前的配置
sudo vim /etc/security/limits.conf
追加如下:
* soft nofile 65536
* hard nofile 65536

vim /etc/sysctl.conf
追加如下:
vm.max_map_count=655360

执行 sysctl -p
退连接工具重新登陆
启动es
cd elasticsearch-7.13.4/bin
./elasticsearch
访问 http://192.168.0.102:9200/

6、修改配置文件启动kibana
cd /home/es/elk/kibana-7.13.4-linux-x86_64/config
vim kibana.yml
添加配置
server.port: 5601
elasticsearch.hosts: ["http://0.0.0.0:9200"]
i18n.locale: "zh-CN"
server.host: "0.0.0.0"

配置说明:
基础配置
# 提供服务的IP

#server.host: "localhost"

# 提供服务的端口

#server.port: 5601

#es服务的地址

#elasticsearch.hosts: ["http://localhost:9200"]

#设置语言为中文

i18n.locale: "zh-CN"
详细配置
# 提供服务的端口

# Kibana is served by a back end server. This setting specifies the port to use.

#server.port: 5601

# 提供服务的IP

# Specifies the address to which the Kibana server will bind. IP addresses and host names are both valid values.

# The default is 'localhost', which usually means remote machines will not be able to connect.

# To allow connections from remote users, set this parameter to a non-loopback address.

#server.host: "localhost"

# 配置代理路径

# Enables you to specify a path to mount Kibana at if you are running behind a proxy.

# Use the `server.rewriteBasePath` setting to tell Kibana if it should remove the basePath

# from requests it receives, and to prevent a deprecation warning at startup.

# This setting cannot end in a slash.

#server.basePath: ""

# 指定Kibana是否应重写前缀为的请求,或要求它们由反向代理重写

# Specifies whether Kibana should rewrite requests that are prefixed with

# `server.basePath` or require that they are rewritten by your reverse proxy.

# This setting was effectively always `false` before Kibana 6.3 and will

# default to `true` starting in Kibana 7.0.

#server.rewriteBasePath: false

# 指定最终用户可以使用Kibana的公共URL。如果

# 已配置“server.basePath”。此URL应以相同的basePath结尾。

# Specifies the public URL at which Kibana is available for end users. If

# `server.basePath` is configured this URL should end with the same basePath.

#server.publicBaseUrl: ""

# 传入服务器请求的最大负载大小(以字节为单位)。

# The maximum payload size in bytes for incoming server requests.

#server.maxPayload: 1048576

# es服务的地址

# The URLs of the Elasticsearch instances to use for all your queries.

#elasticsearch.hosts: ["http://localhost:9200"]

# Kibana在Elasticsearch中使用索引来存储保存的搜索、可视化和仪表盘。如果索引不存在,Kibana将创建一个新索引。

# Kibana uses an index in Elasticsearch to store saved searches, visualizations and

# dashboards. Kibana creates a new index if the index doesn't already exist.

#kibana.index: ".kibana"

# 加载默认应用

# The default application to load.

#kibana.defaultAppId: "home"

# 如果es设置了账号和密码,在下面配置

# If your Elasticsearch is protected with basic authentication, these settings provide

# the username and password that the Kibana server uses to perform maintenance on the Kibana

# index at startup. Your Kibana users still need to authenticate with Elasticsearch, which

# is proxied through the Kibana server.

# 账号

#elasticsearch.username: "kibana_system"

# 密码

#elasticsearch.password: "pass"

# 配置ssl证书和ssl密钥

# Enables SSL and paths to the PEM-format SSL certificate and SSL key files, respectively.

# These settings enable SSL for outgoing requests from the Kibana server to the browser.

#server.ssl.enabled: false

#server.ssl.certificate: /path/to/your/server.crt

#server.ssl.key: /path/to/your/server.key

# 这些文件用于向Elasticsearch验证Kibana的身份,并且在以下情况下是必需的

# Optional settings that provide the paths to the PEM-format SSL certificate and key files.

# These files are used to verify the identity of Kibana to Elasticsearch and are required when

# xpack.security.http.ssl.client_authentication in Elasticsearch is set to required.

#elasticsearch.ssl.certificate: /path/to/your/client.crt

#elasticsearch.ssl.key: /path/to/your/client.key

# 可选设置,允许您为证书指定PEM文件的路径

# Optional setting that enables you to specify a path to the PEM file for the certificate

# authority for your Elasticsearch instance.

#elasticsearch.ssl.certificateAuthorities: [ "/path/to/your/CA.pem" ]

#若要忽略SSL证书的有效性,请将此设置的值更改为“无”。

# To disregard the validity of SSL certificates, change this setting's value to 'none'.

#elasticsearch.ssl.verificationMode: full

#等待Elasticsearch响应ping的时间(毫秒)。默认为的值

# Time in milliseconds to wait for Elasticsearch to respond to pings. Defaults to the value of

# the elasticsearch.requestTimeout setting.

#elasticsearch.pingTimeout: 1500

#等待后端或Elasticsearch响应的时间(毫秒)。此值

#必须是正整数。

# Time in milliseconds to wait for responses from the back end or Elasticsearch. This value

# must be a positive integer.

#elasticsearch.requestTimeout: 30000

#要发送到Elasticsearch的Kibana客户端头列表。发送*否*客户端

#标题,将此值设置为[](空列表)。

# List of Kibana client-side headers to send to Elasticsearch. To send *no* client-side

# headers, set this value to [] (an empty list).

#elasticsearch.requestHeadersWhitelist: [ authorization ]

#发送到Elasticsearch的标题名称和值。无法覆盖任何自定义标题

#通过客户端头,而不考虑elasticsearch.requestHeadersWhitelist配置。

# Header names and values that are sent to Elasticsearch. Any custom headers cannot be overwritten

# by client-side headers, regardless of the elasticsearch.requestHeadersWhitelist configuration.

#elasticsearch.customHeaders: {}

#Elasticsearch等待碎片响应的时间(毫秒)。设置为0以禁用。

#elasticsearch.shardTimeout:30000

# Time in milliseconds for Elasticsearch to wait for responses from shards. Set to 0 to disable.

#elasticsearch.shardTimeout: 30000

#记录发送到Elasticsearch的查询。需要将logging.verbose设置为true

# Logs queries sent to Elasticsearch. Requires logging.verbose set to true.

#elasticsearch.logQueries: false

#指定Kibana创建进程ID文件的路径

# Specifies the path where Kibana creates the process ID file.

#pid.file: /run/kibana/kibana.pid

#允许您指定Kibana存储日志输出的文件

# Enables you to specify a file where Kibana stores log output.

#logging.dest: stdout

#将此设置的值设置为true以抑制所有日志记录输出。

# Set the value of this setting to true to suppress all logging output.

#logging.silent: false

#将此设置的值设置为true以抑制除错误消息以外的所有日志输出。

# Set the value of this setting to true to suppress all logging output other than error messages.

#logging.quiet: false

#将此设置的值设置为true以记录所有事件,包括系统使用信息以及所有的请求。

# Set the value of this setting to true to log all events, including system usage information

# and all requests.

#logging.verbose: false

#设置采样系统和进程性能的间隔(以毫秒为单位)

# Set the interval in milliseconds to sample system and process performance

# metrics. Minimum is 100ms. Defaults to 5000.

#ops.interval: 5000

#指定用于所有可本地化字符串、日期和数字格式的区域设置。

#支持的语言如下:英语-en,默认情况下为中文-zh-CN。

# Specifies locale to be used for all localizable strings, dates and number formats.

# Supported languages are the following: English - en , by default , Chinese - zh-CN .

#i18n.locale: "en"
启动kibana
进入bin目录启动
cd /home/es/elk/kibana-7.13.4-linux-x86_64/bin
./kibana

添加数据,感受一下kibana的界面


7、配置启动logstash
基础配置
# IP

# http.host: 127.0.0.1

# 端口

# http.port: 9600
详细配置
#可以使用分层形式进行设置
# Settings file in YAML
#
# Settings can be specified either in hierarchical form, e.g.:
    #通道
#   pipeline:
      #批次
#     batch:
        #大小
#       size: 125
        #延时
#       delay: 5
#
# Or as flat keys:
#   #一行一行的配置属性值
#   pipeline.batch.size: 125
#   pipeline.batch.delay: 5
#

# ------------  节点标识 ------------
# ------------  Node identity ------------
#
# Use a descriptive name for the node:
# 节点名称
# node.name: test
# 如果省略,节点名称将默认为计算机的主机名
# If omitted the node name will default to the machine's host name
#
# ------------ 数据路径 ------------------
# ------------ Data path ------------------
#
#logstash及其插件应该使用哪个目录对于任何持续的需求。默认为LOGSTASH_HOME/data
# Which directory should be used by logstash and its plugins
# for any persistent needs. Defaults to LOGSTASH_HOME/data
#
# path.data:
#
# ------------ 管道设置 --------------
# ------------ Pipeline Settings --------------
# 管道的ID。
# The ID of the pipeline.

# 管道id:main
# pipeline.id: main

# 设置并行执行过滤器+输出的工作人员数量 管道阶段。
# Set the number of workers that will, in parallel, execute the filters+outputs
# stage of the pipeline.

# 这默认为主机的CPU核心数。
# This defaults to the number of the host's CPU cores.

# 管道工人:2名
# pipeline.workers: 2

# 在发送到筛选器+工作者之前,要从输入中检索多少事件
# How many events to retrieve from inputs before sending to filters+workers

# 管道.批次.尺寸:125
# pipeline.batch.size: 125

# 轮询下一个事件时等待的时间(毫秒)
# How long to wait in milliseconds while polling for the next event

# 在将较小的批次分配到过滤器+输出之前
# before dispatching an undersized batch to filters+outputs

# 管道.批次.延迟:50
# pipeline.batch.delay: 50

# 在停机期间强制Logstash退出记忆中的事件
# 默认情况下,logstash将拒绝退出,直到所有已将接收到的事件推送到输出。
# Force Logstash to exit during shutdown even if there are still inflight
# events in memory. By default, logstash will refuse to quit until all
# received events have been pushed to the outputs.

# 警告:启用此选项可能会导致关机期间数据丢失
# WARNING: enabling this can lead to data loss during shutdown
# pipeline.unsafe_shutdown: false

# 设置管道事件顺序。选项有“自动”(默认)、“真”或“假”。
# Set the pipeline event ordering. Options are "auto" (the default), "true" or "false".
# "auto" will  automatically enable ordering if the 'pipeline.workers' setting
# is also set to '1'.
# "true" will enforce ordering on the pipeline and prevent logstash from starting
# if there are multiple workers.
# "false" will disable any extra processing necessary for preserving ordering.
#
pipeline.ordered: auto
#
# ------------ Pipeline Configuration Settings --------------
# ------------ 管道配置设置 --------------
#
# Where to fetch the pipeline configuration for the main pipeline
# 从何处获取主管道的管道配置
# path.config:
# 主管道的管道配置字符串
# Pipeline configuration string for the main pipeline
#
# config.string:
# 启动时,测试配置是否有效并退出(干运行)
# At startup, test if the configuration is valid and exit (dry run)
#
# config.test_and_exit: false

# 定期检查配置是否已更改并重新加载管道这也可以通过SIGHUP信号手动触发
# Periodically check if the configuration has changed and reload the pipeline
# This can also be triggered manually through the SIGHUP signal
#
# config.reload.automatic: false
#
# 不建议以这种方式设置间隔,在以后的版本中可能会更改
# How often to check if the pipeline configuration has changed (in seconds)
# Note that the unit value (s) is required. Values without a qualifier (e.g. 60)
# are treated as nanoseconds.
# Setting the interval this way is not recommended and might change in later versions.
#
# config.reload.interval: 3s

# 将完全编译的配置显示为调试日志消息
# Show fully compiled configuration as debug log message
# NOTE: --log.level must be 'debug'
# 注意:--log.level必须为“调试”
# 是否启动debugger模式
# config.debug: false
#
# 启用时,处理中字符串中的转义字符,如\n和\“
# When enabled, process escaped characters such as \n and \" in strings in the
# pipeline configuration files.
#
# config.support_escapes: false
#
# ------------HTTP API设置 -------------
# ------------ HTTP API Settings -------------
# Define settings related to the HTTP API here.
#
# 默认情况下启用HTTP API。它可以被禁用,但功能依赖于它不会按预期工作。
# The HTTP API is enabled by default. It can be disabled, but features that rely
# on it will not work as intended.
# http.enabled: true
# 默认情况下,HTTP API仅绑定到主机的本地环回接口,确保网络的其余部分无法访问它。因为API
# 既不包括身份验证,也不包括授权,并且尚未加固或删除测试用作可公开访问的API,绑定到可公开访问的IP应尽可能避免。
# By default, the HTTP API is bound to only the host's local loopback interface,
# ensuring that it is not accessible to the rest of the network. Because the API
# includes neither authentication nor authorization and has not been hardened or
# tested for use as a publicly-reachable API, binding to publicly accessible IPs
# should be avoided where possible.
# IP
# http.host: 127.0.0.1
#
# The HTTP API web server will listen on an available port from the given range.
# Values can be specified as a single port (e.g., `9600`), or an inclusive range
# of ports (e.g., `9600-9700`).
# 端口
# http.port: 9600-9700
#
# ------------ 模块设置 ---------------
# ------------ Module Settings ---------------
#在这里定义模块。模块定义必须定义为数组。
#查看这一点的简单方法是在每个'name'前面加上一个'-',并保留
#与之关联的`name`下的所有关联变量,以及
#在下一个上面,像这样:
# Define modules here.  Modules definitions must be defined as an array.
# The simple way to see this is to prepend each `name` with a `-`, and keep
# all associated variables under the `name` they are associated with, and
# above the next, like this:
#
# modules:
#   - name: MODULE_NAME
#     var.PLUGINTYPE1.PLUGINNAME1.KEY1: VALUE
#     var.PLUGINTYPE1.PLUGINNAME1.KEY2: VALUE
#     var.PLUGINTYPE2.PLUGINNAME1.KEY1: VALUE
#     var.PLUGINTYPE3.PLUGINNAME3.KEY1: VALUE
#
# Module variable names must be in the format of
#
# var.PLUGIN_TYPE.PLUGIN_NAME.KEY
#
# modules:
#
# ------------ 云设置 ---------------
# ------------ Cloud Settings ---------------
# Define Elastic Cloud settings here.
# cloud.id的格式为base64值,例如dXMtZWFzdC0xLmF3cy5mb3VuZC5pbyRub3RhcmVhbCRpZGVudGlmaWVy
# Format of cloud.id is a base64 value e.g. dXMtZWFzdC0xLmF3cy5mb3VuZC5pbyRub3RhcmVhbCRpZGVudGlmaWVy
# and it may have an label prefix e.g. staging:dXMtZ...
# 它可能有一个标签前缀,例如staging:dXMtZ。。。
# This will overwrite 'var.elasticsearch.hosts' and 'var.kibana.host'
# cloud.id: <identifier>
#
# Format of cloud.auth is: <user>:<pass>
# This is optional
# 如果提供,这将覆盖“var.elasticsearch.username”和“var.elasticsearch.password”
# If supplied this will overwrite 'var.elasticsearch.username' and 'var.elasticsearch.password'
# If supplied this will overwrite 'var.kibana.username' and 'var.kibana.password'
# cloud.auth: elastic:<password>
#
# ------------ 队列设置 --------------
# ------------ Queuing Settings --------------
# 可以配置在硬盘或者内存中执行,默认为内存
# Internal queuing model, "memory" for legacy in-memory based queuing and
# "persisted" for disk-based acked queueing. Defaults is memory
#
# queue.type: memory
#
# 如果类型(queue.type)使用硬盘,此路径(path.queue:)则为数据文件的目录
# If using queue.type: persisted, the directory path where the data files will be stored.
# Default is path.data/queue
#
# path.queue:
#
# If using queue.type: persisted, the page data files size. The queue data consists of
# append-only data files separated into pages. Default is 64mb
# 仅追加分隔为页面的数据文件。默认值为64mb
# queue.page_capacity: 64mb
# 如果使用queue.type:persistend,则为队列中未读事件的最大数量。
# If using queue.type: persisted, the maximum number of unread events in the queue.
# Default is 0 (unlimited)
#
# queue.max_events: 0
#
#
# If using queue.type: persisted, the total capacity of the queue in number of bytes.
# If you would like more unacked events to be buffered in Logstash, you can increase the
# capacity using this setting. Please make sure your disk drive has capacity greater than
# the size specified here. If both max_bytes and max_events are specified, Logstash will pick
# whichever criteria is reached first
# Default is 1024mb or 1gb
# 队列容量
# queue.max_bytes: 1024mb
#
# If using queue.type: persisted, the maximum number of acked events before forcing a checkpoint
# Default is 1024, 0 for unlimited
# 强制检查点之前已确认的最大事件数
# queue.checkpoint.acks: 1024
#
# If using queue.type: persisted, the maximum number of written events before forcing a checkpoint
# Default is 1024, 0 for unlimited
# 则为强制检查点之前写入的最大事件数 默认值为1024,0表示无限制
# queue.checkpoint.writes: 1024
#
# If using queue.type: persisted, the interval in milliseconds when a checkpoint is forced on the head page
# Default is 1000, 0 for no periodic checkpoint.
# 如果使用queue.type:persisted,则在头页上强制设置检查点的间隔(以毫秒为单位)默认值为1000,0表示无定期检查点。
# queue.checkpoint.interval: 1000
#
# ------------ 死信队列设置 --------------
# ------------ Dead-Letter Queue Settings --------------
# Flag to turn on dead-letter queue.
# 死信队列。启用:false
# dead_letter_queue.enable: false
# 如果使用死信队列。enable:true,每个死信队列的最大大小。条目
# If using dead_letter_queue.enable: true, the maximum size of each dead letter queue. Entries
# 如果将死信队列的大小增加到超出此设置,则将删除
# will be dropped if they would increase the size of the dead letter queue beyond this setting.
# #默认值为1024mb
# Default is 1024mb
# 死信队列。最大字节数:1024mb
# dead_letter_queue.max_bytes: 1024mb
# 如果使用dead_letter_queue.enable:true,如果没有符合DLQ条件的其他事件,则间隔(以毫秒为单位)
# 创建后,将写入死信队列文件。这里的值越低,意味着队列文件越多、越小
# 可以写入,而较大的值将在“写入”死信队列的项目之间引入更多延迟,并且
# 当项目不经常写入时,死信队列输入可以读取。
# 默认值为5000。
# If using dead_letter_queue.enable: true, the interval in milliseconds where if no further events eligible for the DLQ
# have been created, a dead letter queue file will be written. A low value here will mean that more, smaller, queue files
# may be written, while a larger value will introduce more latency between items being "written" to the dead letter queue, and
# being available to be read by the dead_letter_queue input when items are are written infrequently.
# Default is 5000.
# 死信队列。刷新间隔:5000
# dead_letter_queue.flush_interval: 5000
# 如果使用dead_letter_queue.enable:true,则为存储数据文件的目录路径。
# If using dead_letter_queue.enable: true, the directory path where the data files will be stored.
# Default is path.data/dead_letter_queue
#
# path.dead_letter_queue:
#
# ------------- 指标设置 --------------
# ------------ Metrics Settings --------------
#
# Bind address for the metrics REST endpoint
# IP
# http.host: "127.0.0.1"
#
# Bind port for the metrics REST endpoint, this option also accept a range
# (9600-9700) and logstash will pick up the first available ports.
# 端口
# http.port: 9600-9700
#
# ------------ 调试设置 --------------
# ------------ Debugging Settings --------------
# 启动模式
# Options for log.level:
#   * fatal
#   * error
#   * warn
#   * info (default)
#   * debug
#   * trace
# 日志级别
# log.level: info
# path.logs:
#
# ------------ 其他设置 --------------
# ------------ Other Settings --------------
# 在哪里可以找到自定义插件
# Where to find custom plugins
# path.plugins: []
#
# 在单独的日志文件中输出每个管道的日志行的标志。每个日志文件名都包含pipeline.name默认值为false
# Flag to output log lines of each pipeline in its separate log file. Each log filename contains the pipeline.name
# Default is false
# pipeline.separate_logs: false
#
# X-Pack设置(不适用于OSS构建)
# ------------ X-Pack Settings (not applicable for OSS build)--------------
# X-Pack监控
# X-Pack Monitoring
# https://www.elastic.co/guide/en/logstash/current/monitoring-logstash.html
#xpack.monitoring.enabled: false
#xpack.monitoring.elasticsearch.username: logstash_system
#xpack.monitoring.elasticsearch.password: password
#xpack.monitoring.elasticsearch.proxy: ["http://proxy:port"]
#xpack.monitoring.elasticsearch.hosts: ["https://es1:9200", "https://es2:9200"]
# 主机+用户名/密码设置的替代方法是使用
# an alternative to hosts + username/password settings is to use cloud_id/cloud_auth
#xpack.monitoring.elasticsearch.cloud_id: monitoring_cluster_id:xxxxxxxxxx
#xpack.monitoring.elasticsearch.cloud_auth: logstash_system:password
# 另一种身份验证方法是使用Elasticsearch API密钥
# another authentication alternative is to use an Elasticsearch API key
#xpack.monitoring.elasticsearch.api_key: "id:api_key"
#xpack.monitoring.elasticsearch.ssl.certificate_authority: [ "/path/to/ca.crt" ]
#xpack.monitoring.elasticsearch.ssl.truststore.path: path/to/file
#xpack.monitoring.elasticsearch.ssl.truststore.password: password
#xpack.monitoring.elasticsearch.ssl.keystore.path: /path/to/file
#xpack.monitoring.elasticsearch.ssl.keystore.password: password
#xpack.monitoring.elasticsearch.ssl.verification_mode: certificate
#xpack.monitoring.elasticsearch.sniffing: false
#xpack.monitoring.collection.interval: 10s
#xpack.monitoring.collection.pipeline.details.enabled: true
# X-Pack管理
# X-Pack Management
# https://www.elastic.co/guide/en/logstash/current/logstash-centralized-pipeline-management.html
#xpack.management.enabled: false
#xpack.management.pipeline.id: ["main", "apache_logs"]
#xpack.management.elasticsearch.username: logstash_admin_user
#xpack.management.elasticsearch.password: password
#xpack.management.elasticsearch.proxy: ["http://proxy:port"]
#xpack.management.elasticsearch.hosts: ["https://es1:9200", "https://es2:9200"]
# 主机+用户名/密码设置的替代方法是使用
# an alternative to hosts + username/password settings is to use cloud_id/cloud_auth
#xpack.management.elasticsearch.cloud_id: management_cluster_id:xxxxxxxxxx
#xpack.management.elasticsearch.cloud_auth: logstash_admin_user:password
# 另一种身份验证方法是使用Elasticsearch API密钥
# another authentication alternative is to use an Elasticsearch API key
#xpack.management.elasticsearch.api_key: "id:api_key"
#xpack.management.elasticsearch.ssl.certificate_authority: [ "/path/to/ca.crt" ]
#xpack.management.elasticsearch.ssl.truststore.path: /path/to/file
#xpack.management.elasticsearch.ssl.truststore.password: password
#xpack.management.elasticsearch.ssl.keystore.path: /path/to/file
#xpack.management.elasticsearch.ssl.keystore.password: password
#xpack.management.elasticsearch.ssl.verification_mode: certificate
#xpack.management.elasticsearch.sniffing: false
#xpack.management.logstash.poll_interval: 5s
4. 收集springboot项目日志(windows版)
1、收集springboot项目日志
进入logstash配置目录,新建logstash.conf

input表示输入日志的服务,output是同步到es的服务地址

input{

tcp {

mode => "server"

host => "0.0.0.0" #我这里是本地

port => 9061 #开放这个端口进行采集

codec => json_lines # 编解码器 有的版本需要独自安装

}

}

output{

elasticsearch{ #es地址

hosts=>["127.0.0.1:9200"]

# 在es里产生的index的名称

index => "springboot-study-%{+YYYY.MM.dd}"

}

stdout{codec => rubydebug}

}
创建启动脚本


logstash.bat -f …/config/logstash.confspringboot项目中导入pom文件
<dependency>
    <groupId>net.logstash.logback</groupId>
    <artifactId>logstash-logback-encoder</artifactId>
    <version>6.1</version>
</dependency>
创建logstash同步文件

<?xml version="1.0" encoding="UTF-8"?>
<configuration>
    <include resource="org/springframework/boot/logging/logback/base.xml" />

    <appender name="LOGSTASH" class="net.logstash.logback.appender.LogstashTcpSocketAppender">
        <destination>0.0.0.0:9061</destination>
        <encoder charset="UTF-8" class="net.logstash.logback.encoder.LogstashEncoder" />
    </appender>

    <root level="INFO">
        <appender-ref ref="LOGSTASH" />
        <appender-ref ref="CONSOLE" />
    </root>
</configuration>
在application.yml配置
logging:
  config: classpath:logstash-spring.xml
注意:xml中的端口要和logstash.conf输入日志的端口相同
#启动springboot项目 -》启动start-logstash.bat脚本
启动成功命令行中会有信息输出:

查看同步的数据


5. 收集springboot项目日志(linux版)
1、收集springboot项目日志
进入logstash配置目录,新建logstash.conf
cd logstash-7.13.4/config
vi logstash.conf
输入内容如下
input{

tcp {

mode => "server"

host => "0.0.0.0" #我这里是本地

port => 9061 #开放这个端口进行采集

codec => json_lines # 编解码器 有的版本需要独自安装

}

}

output{

elasticsearch{ #es地址

hosts=>["127.0.0.1:9200"]

# 在es里产生的index的名称

index => "springboot-study-%{+YYYY.MM.dd}"

}

stdout{codec => rubydebug}

}
输入:wq!保存
input表示输入日志的服务,output是同步到es的服务地址

创建启动脚本
cd /home/es/elk/logstash-7.13.4/bin
vi start-logstash.sh
输入如下:
./logstash -f ../config/logstash.conf
保存 :wq!
赋权 chmod u+x start-logstash.sh
springboot项目中导入pom文件
<dependency>
    <groupId>net.logstash.logback</groupId>
    <artifactId>logstash-logback-encoder</artifactId>
    <version>6.1</version>
</dependency>
创建logstash同步文件

<?xml version="1.0" encoding="UTF-8"?>
<configuration>
    <include resource="org/springframework/boot/logging/logback/base.xml" />

    <appender name="LOGSTASH" class="net.logstash.logback.appender.LogstashTcpSocketAppender">
        <destination>0.0.0.0:9061</destination>
        <encoder charset="UTF-8" class="net.logstash.logback.encoder.LogstashEncoder" />
    </appender>

    <root level="INFO">
        <appender-ref ref="LOGSTASH" />
        <appender-ref ref="CONSOLE" />
    </root>
</configuration>
在application.yml配置
logging:
  config: classpath:logstash-spring.xml
注意:xml中的端口要和logstash.conf输入日志的端口相同
#打包springboot项目 部署到linux中,启动springboot项目-》启动start-logstash.sh
打包springboot项目

上传jar包

启动jar包,查看实时日志
nohup java -jar network-0804.jar > network-0804.log &
tail -f network-0804.log

启动start-logstash.sh
cd logstash-7.13.4/bin/
./start-logstash.sh

查看同步的数据


6. elk 补充(后台运行,开机自启)
1、后台运行 :
在linux环境下,如果想要后台启动,需要在执行启动脚本是后面加一个"&"符号表示后台运行,例如:后台运行es 进入es的bin目录,执行./elasticsearch &,如果想要生成运行的日志nohup ./elasticsearch > es.log &,
如果想要查看es.log日志可以,可以使用vi vim cat 查看静态日志,也可以通过tail -f 查看动态日志;
例如:tail -f es.log
2、开机启动
cd /etc/init.d #进入目录
sudo touch elasticsearch logstash kibana #创建启动脚本
sudo chmod +x elasticsearch logstash kibana #设置可执行权限
编辑文件分别保存进去
elasticsearch
#!/bin/bash

# chkconfig: 2345 21 89 # description: elasticsearch

es_home=/home/es/elk/elasticsearch-7.13.4

case $1 in

start) sudo -iu elk $es_home/bin/elasticsearch &;;

*) echo "require start" ;;

esac
kibana
#!/bin/bash # chkconfig: 2345 98 02 # description: kibana

kibana_home=/home/es/elk/kibana-7.13.4-linux-x86_64

case $1 in

start) sudo -iu elk $kibana_home/bin/kibana &;;

*) echo "require start" ;;

esac
logstash
#!/bin/bash # chkconfig: 2345 50 50 # description: logstash

logstash_home=/home/es/elk/logstash-7.13.4

case $1 in

start) sudo -iu elk $elk_home/bin/elasticsearch &;;

*) echo "require start" ;;

esac
添加到开机启动
sudo chkconfig --add elasticsearch sudo chkconfig --add logstash sudo chkconfig --add kibana
配置java环境变量 sudo vim /etc/profile
JAVA_HOME=/home/es/jdk1.8.0_65

JRE_HOME=$JAVA_HOME/jre

PATH=$PATH:$JAVA_HOME/bin:/sbin:/usr/bin:/usr/sbin

CLASSPATH=.:$JAVA_HOME/lib/dt.jar:$JAVA_HOME/lib/tools.jar

export JAVA_HOME

export JRE_HOME

export PATH

export CLASSPATH
刷新环境变量文件:source /etc/profile
重启服务器 reboot

为开发者提供学习成长、分享交流、生态实践、资源工具等服务,帮助开发者快速成长。
更多推荐


 60
60 0
0- 0


 已为社区贡献2条内容

所有评论(0)