perf简介和使用
perf 简介和使用
perf 简介
Performance analysis tools for Linux.
Performance counters for Linux are a new kernel-based subsystem that provide a framework for all things performance analysis. It covers hardware level (CPU/PMU, Performance Monitoring Unit) features and software features (software counters, tracepoints) as well.
perf是内置于Linux内核源码树中的系统性能剖析(profiling)工具,原理是在CPU的PMU register中Get/Set performance counters来获得诸如instructions executed,cache-missed suffered,branches mispredicted等信息。
perf基于事件采样原理,以性能事件为基础,支持针对处理器相关性能指标与操作系统相关性能指标的性能剖析。常用于性能瓶颈的查找与热点代码的定位。
通过它,应用程序可以利用 PMU,tracepoint 和内核中的特殊计数器来进行性能统计。它不但可以分析指定应用程序的性能问题,也可以用来分析内核的性能问题,当然也可以同时分析应用代码和内核,从而全面理解应用程序中的性能瓶颈。
最初的时候,它叫做 Performance counter,在 2.6.31 中第一次亮相。此后他成为内核开发最为活跃的一个领域。在 2.6.32 中它正式改名为 Performance Event,因为 perf 已不再仅仅作为 PMU 的抽象,而是能够处理所有的性能相关的事件。
perf分析程序运行期间发生的硬件事件,比如 instructions retired ,processor clock cycles 等;也可以分析软件事件,比如 Page Fault 和进程切换等。
perf 也拥有了众多的性能分析能力,举例来说,它可以计算每个时钟周期内的指令数,称为 IPC,IPC 偏低表明代码没有很好地利用 CPU;还可以对程序进行函数级别的采样,从而了解程序的性能瓶颈究竟在哪里等。
perf还可以替代 strace,可以添加动态内核 probe 点,还可以做 benchmark 衡量调度器的好坏等。
很多人称它为进行性能分析的“瑞士军刀”
Perf是一个包含22种子工具的工具集,以下介绍最常用的5种:
perf list
perf stat
perf top
perf record
perf report
注意:性能事件的采集和分析请在物理机上进行,虚拟机很多性能事件屏蔽掉了。
环境信息
#cat /proc/cpuinfo | grep name | cut -f2 -d: | uniq -c
     24  Intel(R) Xeon(R) CPU E5-2620 v3 @ 2.40GHz
#free -h
total   used    free      shared  buff/cache   available
Mem:    62G     20G     24G         27M         17G         41G
Swap:   6.0G    0B      6.0G
#uname -r
3.10.0-229.el7.x86_64+
注意:环境不同,下面例子中命令执行的结果会不一样。
perf 二级命令
perf --help之后可以看到perf的二级命令。
perf --help

 usage: perf [--version] [--help] COMMAND [ARGS]

 The most commonly used perf commands are:
   annotate        Read perf.data (created by perf record) and display annotated code
   archive         Create archive with object files with build-ids found in perf.data file
   bench           General framework for benchmark suites
   buildid-cache   Manage build-id cache.
   buildid-list    List the buildids in a perf.data file
   diff            Read perf.data files and display the differential profile
   evlist          List the event names in a perf.data file
   inject          Filter to augment the events stream with additional information
   kmem            Tool to trace/measure kernel memory(slab) properties
   kvm             Tool to trace/measure kvm guest os
   list            List all symbolic event types
   lock            Analyze lock events
   mem             Profile memory accesses
   record          Run a command and record its profile into perf.data
   report          Read perf.data (created by perf record) and display the profile
   sched           Tool to trace/measure scheduler properties (latencies)
   script          Read perf.data (created by perf record) and display trace output
   stat            Run a command and gather performance counter statistics
   test            Runs sanity tests.
   timechart       Tool to visualize total system behavior during a workload
   top             System profiling tool.
   trace           strace inspired tool
   probe           Define new dynamic tracepoints

 See 'perf help COMMAND' for more information on a specific command.
| 序号 | 命令 | 作用 |
|---|---|---|
| 1 | annotate | 解析perf record生成的perf.data文件,显示被注释的代码。 |
| 2 | archive | 根据数据文件记录的build-id,将所有被采样到的elf文件打包。利用此压缩包,可以再任何机器上分析数据文件中记录的采样数据。 |
| 3 | bench | perf中内置的benchmark,目前包括两套针对调度器和内存管理子系统的benchmark。 |
| 4 | buildid-cache | 管理perf的buildid缓存,每个elf文件都有一个独一无二的buildid。buildid被perf用来关联性能数据与elf文件。 |
| 5 | buildid-list | 列出数据文件中记录的所有buildid。 |
| 6 | diff | 对比两个数据文件的差异。能够给出每个符号(函数)在热点分析上的具体差异。 |
| 7 | evlist | 列出数据文件perf.data中所有性能事件。 |
| 8 | inject | 该工具读取perf record工具记录的事件流,并将其定向到标准输出。在被分析代码中的任何一点,都可以向事件流中注入其它事件。 |
| 9 | kmem | 针对内核内存(slab)子系统进行追踪测量的工具 |
| 10 | kvm | 用来追踪测试运行在KVM虚拟机上的Guest OS。 |
| 11 | list | 列出当前系统支持的所有性能事件。包括硬件性能事件、软件性能事件以及检查点。 |
| 12 | lock | 分析内核中的锁信息,包括锁的争用情况,等待延迟等。 |
| 13 | mem | 内存存取情况 |
| 14 | record | 收集采样信息,并将其记录在数据文件中。随后可通过其它工具对数据文件进行分析。 |
| 15 | report | 读取perf record创建的数据文件,并给出热点分析结果。 |
| 16 | sched | 针对调度器子系统的分析工具。 |
| 17 | script | 执行perl或python写的功能扩展脚本、生成脚本框架、读取数据文件中的数据信息等。 |
| 18 | stat | 执行某个命令,收集特定进程的性能概况,包括CPI、Cache丢失率等。 |
| 19 | test | perf对当前软硬件平台进行健全性测试,可用此工具测试当前的软硬件平台是否能支持perf的所有功能。 |
| 20 | timechart | 针对测试期间系统行为进行可视化的工具 |
| 21 | top | 类似于linux的top命令,对系统性能进行实时分析。 |
| 22 | trace | 关于syscall的工具。 |
| 23 | probe | 用于定义动态检查点。 |
perf list
perf list用来查看perf所支持的性能事件,有软件的也有硬件的。
环境不同列出的信息可能不同,可以根据需求对指定事件进行采样。
命令使用
命令格式
perf list -h
 usage: perf list [hw|sw|cache|tracepoint|pmu|event_glob]
命令举例
perf list hw

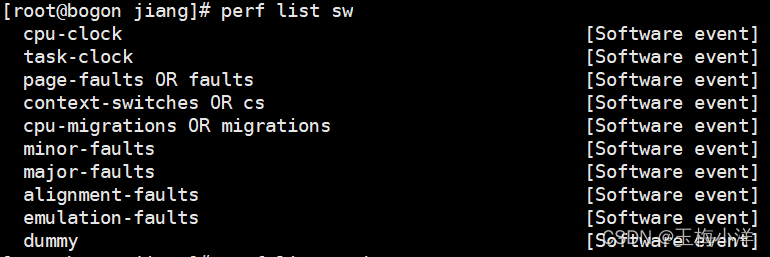
perf list sw
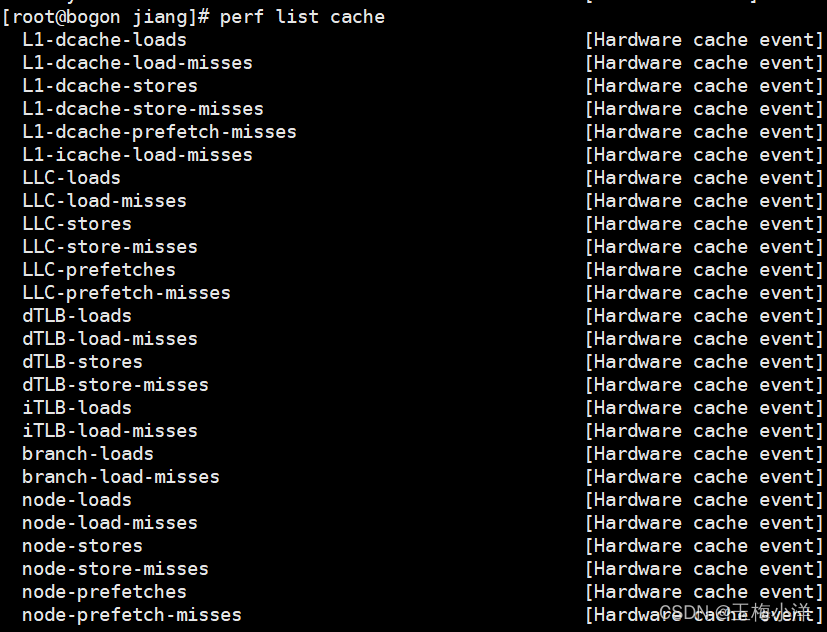
perf list cache
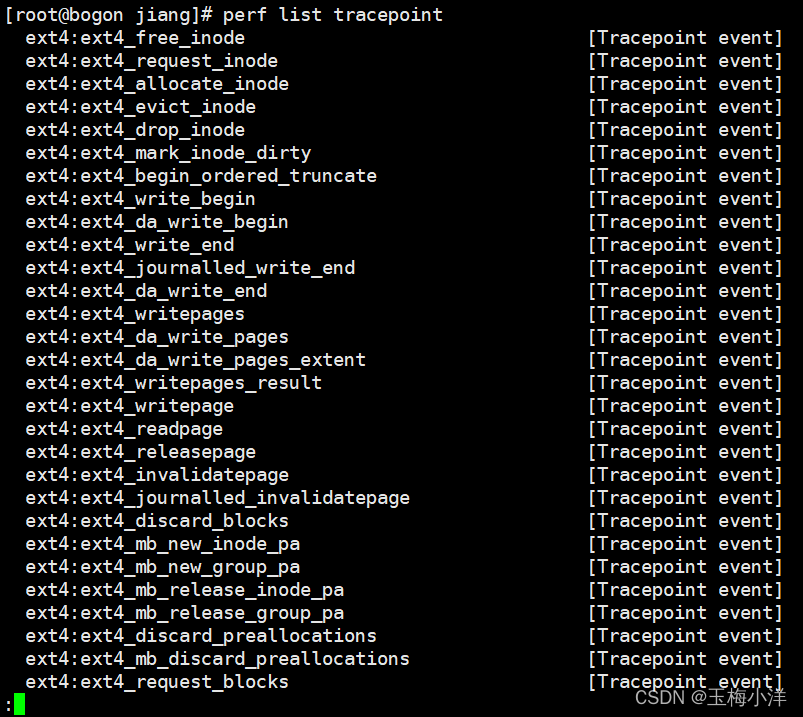
perf list tracepoint
perf list pmu

输出解读
总体分为三类hardware(硬件产生)、software(内核软件产生)、tracepoint(内核中静态tracepoint触发事件)。
hw(Hardware event)和cache(Hardware cache event) 是由 PMU 硬件产生的事件,比如 cache 命中,当您需要了解程序对硬件特性的使用情况时,便需要对这些事件进行采样。
sw(Software event) 是内核软件产生的事件,比如进程切换,tick 数等。
tracepoint(Tracepoint event) 是内核中的静态 tracepoint 所触发的事件,这些 tracepoint 用来判断程序运行期间内核的行为细节,比如 slab 分配器的分配次数等。
上述每一个事件都可以用于采样,并生成一项统计数据。
perf stat
面对一个问题程序,最好采用自顶向下的策略。先整体看看该程序运行时各种统计事件的大概,再针对某些方向深入细节,而不是一下子扎进琐碎细节,否则会一叶障目的。
有些程序慢是因为计算量太大,其多数时间都应该在使用CPU进行计算,这叫做CPU bound(CPU密集)型;有些程序慢是因为过多的IO,这种时候其CPU利用率应该不高,这叫做IO bound(IO密集)型;对于CPU bound程序的调优和IO bound的调优是不同的。
perf stat 就是一个很好的工具,它通过概括精简的方式提供被调试程序运行的整体情况和汇总数据。
命令使用
命令格式
perf stat -h
 usage: perf stat [<options>] [<command>]
常用参数
-e, --event <event>   event selector. use 'perf list' to list available events
-p, --pid <pid>       stat events on existing process id
-t, --tid <tid>       stat events on existing thread id
-a, --all-cpus        system-wide collection from all CPUs
-r, --repeat <n>      repeat command and print average + stddev (max: 100, forever: 0)
-C, --cpu <cpu>       list of cpus to monitor in system-wide
-d, --detailed        detailed run - start a lot of events

-e,指定性能事件
-p,指定分析进程的PID
-t,指定待分析线程的TID
-r N,连续分析N次
-d,全面性能分析,采用更多的性能事件

#指定事件
-e <event>:u // userspace
-e <event>:k // kernel
-e <event>:h // hypervisor
-e <event>:G // guest counting (in KVM guests)
-e <event>:H // host counting (not in KVM guests)
命令举例
例如查看ls的cpu周期数,分别为总周期数,用户态周期数,内核态周期数。
[root@bogon test]# perf stat -e cycles ls

 Performance counter stats for 'ls':

         1,701,168      cycles

       0.001918895 seconds time elapsed

[root@bogon test]# perf stat -e cycles:u ls

 Performance counter stats for 'ls':

           670,422      cycles:u

       0.001387917 seconds time elapsed

[root@bogon test]# perf stat -e cycles:k ls

 Performance counter stats for 'ls':

         1,036,760      cycles:k

       0.001821355 seconds time elapsed
可以发现,总周期数≈用户态周期数+内核态周期数。
用-e指定相应事件,举例如下:
[root@bogon test]# perf stat -e cycles,instructions,cache-references,cache-misses,L1-dcache-loads,L1-dcache-load-misses,LLC-loads,LLC-load-misses,dTLB-loads,dTLB-load-misses -p 2347 sleep 10

输出解读
[root@bogon test]# perf stat -d ls

下面这个是网上找的事件比较全的例子。

- task-clock:任务真正占用CPU的时间,单位为ms。
CPUs utilized = task-clock(ms) / time elapsed(s) * 1000,s表示多核,此数值可以大于1。
CPUs utillized指这个进程在运行perf的这段时间内的CPU利用率,该值高说明程序的多数时间花费在 CPU 计算上而非 IO。 - **context-switches:**上下文切换次数,前半部分是切换次数,后面是平均每秒发生次数。应避免频繁的上下文切换。
- **cpu-migrations:**程序在运行过程中发生的CPU迁移次数。Linux为了维持多个CPU的负载均衡,在特定条件下会将某个任务从一个CPU迁移到另一个CPU。
这里要注意下CPU迁移和上下文切换的不同之处:发生上下文切换时不一定会发生CPU迁移,而发生CPU迁移时肯定会发生上下文切换。发生上下文切换时有可能只是把上下文从当前CPU中换出,下一次调度器还是将进程安排在这个CPU上执行。 - page-faults: 缺页异常的次数。当应用程序请求的页面尚未建立、请求的页面不在内存中或者请求的页面虽然在内存中,但物理地址和虚拟地址的映射关系尚未建立时,都会触发缺页异常。另外TLB 不命中()、页面访问权限不匹配等情况也会触发缺页异常。
- cycles: CPU时钟周期数。CPU从它的指令集(instruction set)中选择指令执行。一个指令包含以下的步骤,每个步骤由CPU的一个叫做功能单元(functional unit)的组件来进行处理,每个步骤的执行都至少需要花费一个时钟周期。
- 指令读取(instruction fetch)
- 指令解码(instruction decode)
- 执行**(execute**)
- 内存访问(memory access)
- 寄存器回写(register write-back)
如果把被ls使用的CPU cycles看成是一个处理器的,那么它的主频为1.023GHz,可以用cycles / task-clock * 1000算出。
- stalled-cycles:字面意义是停滞周期,这个跟CPU流水线有关,前面已经介绍了。在理想状态下,CPU可以在一个时钟周期中完成一个指令,而stalled-cycles,则是指令流水线未能按理想状态发挥并行作用,发生停滞的时钟周期。stalled-cycles-frontend指令读取或解码的指令步骤,而stalled-cycles-backend则是指令执行步骤。第二列中的cycles idle其实意思跟stalled是一样的,由于指令执行停滞了,所以指令流水线也就空闲了,千万不要误解为CPU的空闲率。这个数值是由stalled-cycles-frontend或stalled-cycles-backend除以上面的cycles得出的。
- instructions:任务在执行期间完成的CPU指令数。第二列insns per cycle(instructions perf cycle),简称IPC,表示一个时钟周期内能完成多少个CPU指令,该值越大越好。第二行的stalled cycles per insn,表示完成每个指令,有多少个时钟周期是被停滞的,该值越小越好。该值是由stalled-cycles-frontend / instructions得到的。用stalled-cycles-frontend具体原因还不清楚,可能是stalled-cycles-backend会受它影响,用它比较靠谱些。
- **branches:**任务在执行期间发生的分支预测的次数。
- branch-misses:任务在执行期间发生的分支预测失败的次数。
- **L1-dcache-loads:**一级数据缓存读取的次数。
- **L1-dcache-load-misses:**一级数据缓存读取失败的次数。
- **LLC-loads:**last level cache读取的次数。
- **LLC-load-misses:**last level cache读取失败的次数。
其他一些事件
14. **cache-references:**cache的命中次数。
15. **cache-misses:**cache失效的次数。
16. **dTLB-loads:**数据读取TLB的次数。
17. **dTLB-load-misses:**数据读取TLB失败的次数。
18. iTLB-loads: 指令读取TLB的次数。
19. **iTLB-load-misses:**指令读取TLB失败的次数。
这里应该注意到misses的值越小越好。
perf top
命令使用
命令格式
perf top -h
 usage: perf top [<options>]
常用参数
-e, --event <event>   event selector. use 'perf list' to list available events
-p, --pid <pid>       profile events on existing process id
-t, --tid <tid>       profile events on existing thread id
-a, --all-cpus        system-wide collection from all CPUs
-C, --cpu <cpu>       list of cpus to monitor
-k, --vmlinux <file>  vmlinux pathname
-K, --hide_kernel_symbols
                          hide kernel symbols
-U, --hide_user_symbols
                          hide user symbols
-g                        enables call-graph recording

-e <event>:指明要分析的性能事件。
-p <pid>:Profile events on existing Process ID (comma sperated list). 仅分析目标进程及其创建的线程。
-k <path>:Path to vmlinux. Required for annotation functionality. 带符号表的内核映像所在的路径。
-K:不显示属于内核或模块的符号。
-U:不显示属于用户态程序的符号。
-d <n>:界面的刷新周期,默认为2s,因为perf top默认每2s从mmap的内存区域读取一次性能数据。
-g:得到函数的调用关系图。
命令举例
perf top –K

perf top –U

perf top –g

交互命令
输入perf top就能进入交互模式
h:显示帮助

UP/DOWN/PGUP/PGDN/SPACE:上下和翻页。
a:annotate current symbol,注解当前符号。能够给出汇编语言的注解,给出各条指令的采样率。

d:过滤掉所有不属于此DSO的符号。非常方便查看同一类别的符号。

P:将当前信息保存到perf.hist.N中,存在当前路径。
[root@bogon test]# ls
perf.hist.0
输出解读
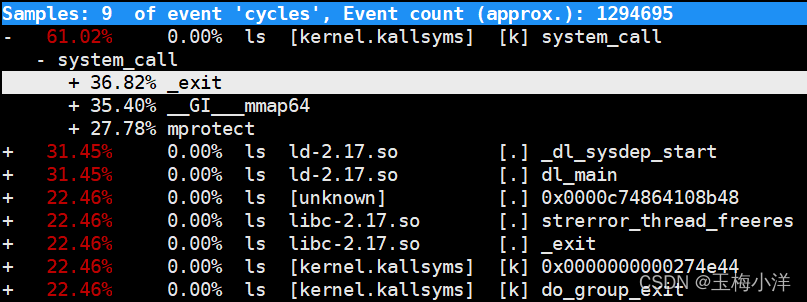
perf top

第一列:符号引发的性能事件的比例,默认指占用的cpu周期比例。
第二列:符号所在的DSO(Dynamic Shared Object),可以是应用程序、内核、动态链接库、模块。
第三列:DSO的类型。[.]表示此符号属于用户态的ELF文件,包括可执行文件与动态链接库)。[k]表述此符号属于内核或模块。
第四列:符号名。有些符号不能解析为函数名,只能用地址表示。
perf record
Run a command and record its profile into perf.data. This command runs a command and gathers a performance counter profile from it, into perf.data, without displaying anything. This file can then be inspected later on, using perf report.
收集采样信息,并将其记录在数据文件中(如果没有通过-o指定文件,则在当前目录生成perf.data文件),随后可以通过其它工具(perf report)对数据文件进行分析,结果类似于perf top的。
perf record 可以记录单个函数级别的统计信息,并使用 perf report 来显示统计结果。调优应该将注意力集中到百分比高的热点代码片段上,假如一段代码只占用整个程序运行时间的 0.1%,即使您将其优化到仅剩一条机器指令,恐怕也只能将整体的程序性能提高 0.1%。俗话说,好钢要用在刀刃上。
命令使用
命令格式
perf record -h
 usage: perf record [<options>] [<command>]
常用参数
-e, --event <event>   event selector. use 'perf list' to list available events
        --filter <filter>
                          event filter
-p, --pid <pid>       record events on existing process id
-t, --tid <tid>       record events on existing thread id
-a, --all-cpus        system-wide collection from all CPUs
-C, --cpu <cpu>       list of cpus to monitor
-o, --output <file>   output file name
-g                    enables call-graph recording

-e record指定PMU事件
   --filter event事件过滤器
-a  录取所有CPU的事件
-p  录取指定pid进程的事件
-o  指定录取保存数据的文件名
-g  使能函数调用图功能
-C  录取指定CPU的事件
命令举例
1.收集某个命令的事件信息
[root@bogon test]# perf record -g ls
perf.data
[ perf record: Woken up 1 times to write data ]
[ perf record: Captured and wrote 0.016 MB perf.data (~704 samples) ]
[root@bogon test]# ls
perf.data
[root@bogon test]# perf report -i perf.data
2.收集某个进程的事件信息 sleep 10 表示收集10秒中。
[root@bogon test]# perf record -g -p 2347 -o 2347.data sleep 10
[ perf record: Woken up 1 times to write data ]
[ perf record: Captured and wrote 0.669 MB 2347.data (~29242 samples) ]
[root@bogon test]# ls
2347.data  perf.data
[root@bogon test]# perf report -i 2347.data

perf report
解析perf record产生的数据,并给出分析结果。
命令使用
命令格式
perf report -h
 usage: perf report [<options>]
常用参数
-i  导入的数据文件名称,如果没有则默认为perf.data
-g  生成函数调用关系图

为开发者提供学习成长、分享交流、生态实践、资源工具等服务,帮助开发者快速成长。
更多推荐


 4
4 0
0- 0


 已为社区贡献5条内容

所有评论(0)