logstash 日志收集
1、logstash 收集系统日志logstash配置文件root@logstash-node1:~# vim /etc/logstash/conf.d/syslog-to-es.confinput {file {path =>"/var/log/syslog"#第一次从头收集,之后从新添加的日志收集start_position => "beginning"#日志收集的间隔时间stat
·
1、logstash 收集系统日志
1.1 logstash配置文件
root@logstash-node1:~# vim /etc/logstash/conf.d/syslog-to-es.conf

input {
  file {
    path =>"/var/log/syslog"
    #第一次从头收集,之后从新添加的日志收集
    start_position => "beginning"
    #日志收集的间隔时间
    stat_interval =>"3"
    type=>"syslog"
  }
}
output {
  if [type] == "syslog" {
    elasticsearch {
      hosts => ["10.10.100.120:9200"]
      index => "syslog-100.105-%{+YYYY.MM.dd}"
    }
  }
}
1.2 启动logstash
#添加syslog文件读权限,或者直接使用root用户启动logstash
root@logstash-node1:~# chmod o+r /var/log/syslog

#启动前可以通过命令测试配置文件
root@logstash-node1:~# /usr/share/logstash/bin/logstash -f /etc/logstash/conf.d/syslog-to-es.conf -t

#测试正常后重启logstash
root@logstash-node1:~# systemctl restart logstash
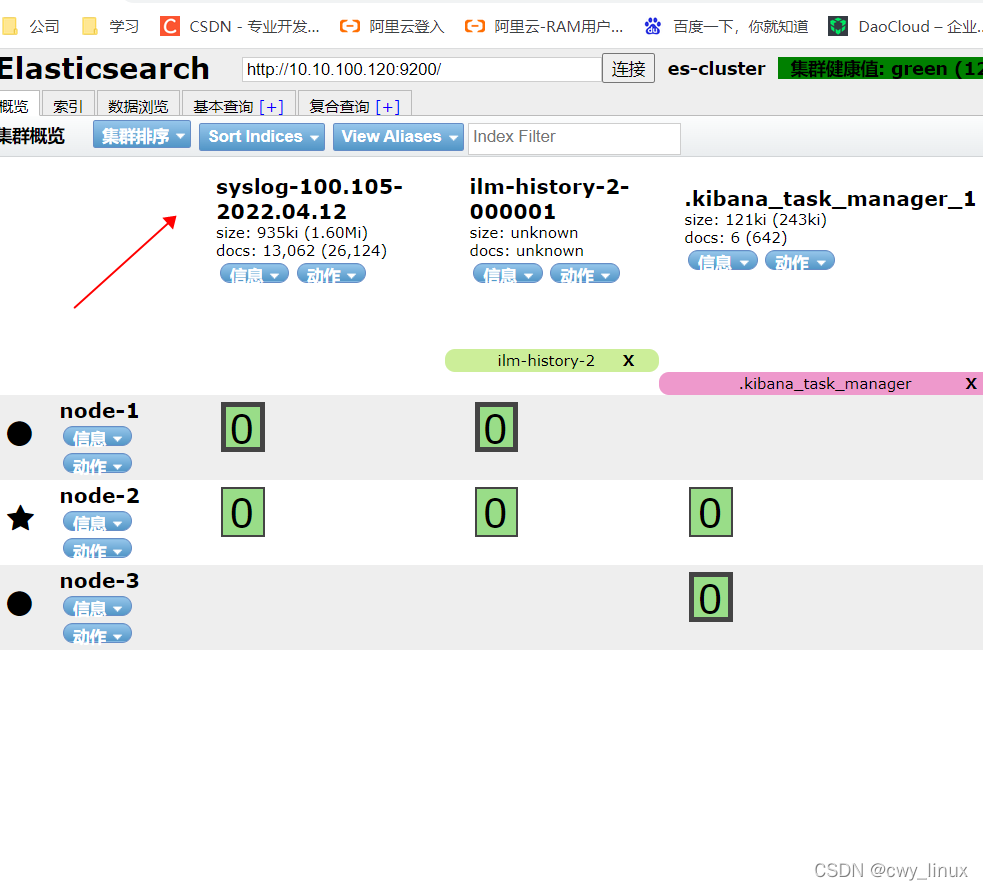
1.3 查看es索引
root@es-node1:~# curl 'localhost:9200/_cat/indices?v'
health status index                          uuid                   pri rep docs.count docs.deleted store.size
green  open   syslog-100.105-2022.04.12      2sKdW70BSz2ob8Jfxb6jXw   1   1      13062            0      4.8mb          2.4mb
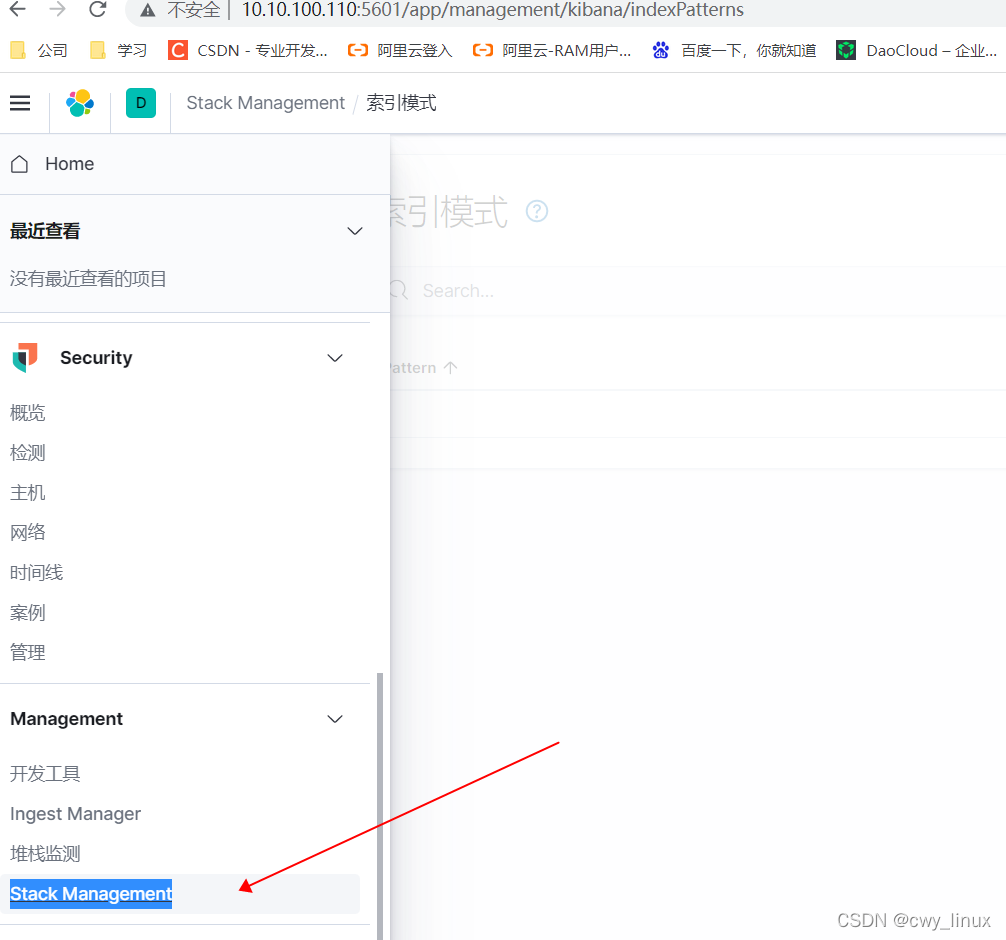
1.4 kibana 查看日志
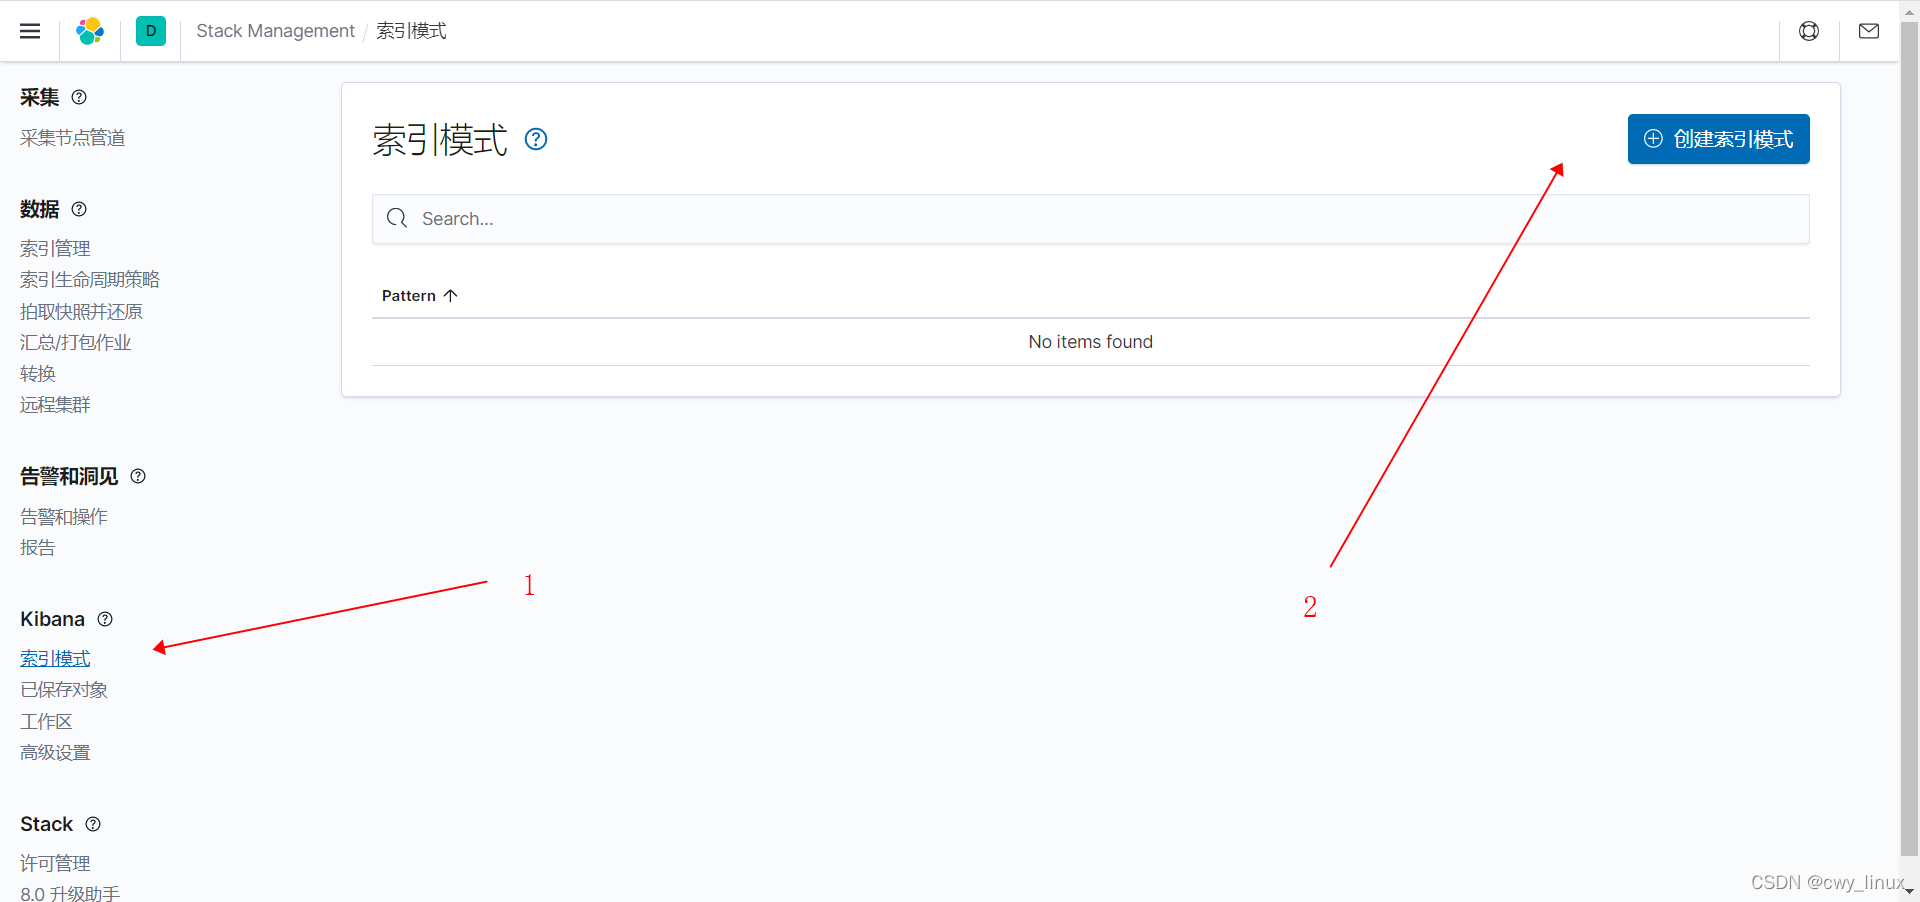
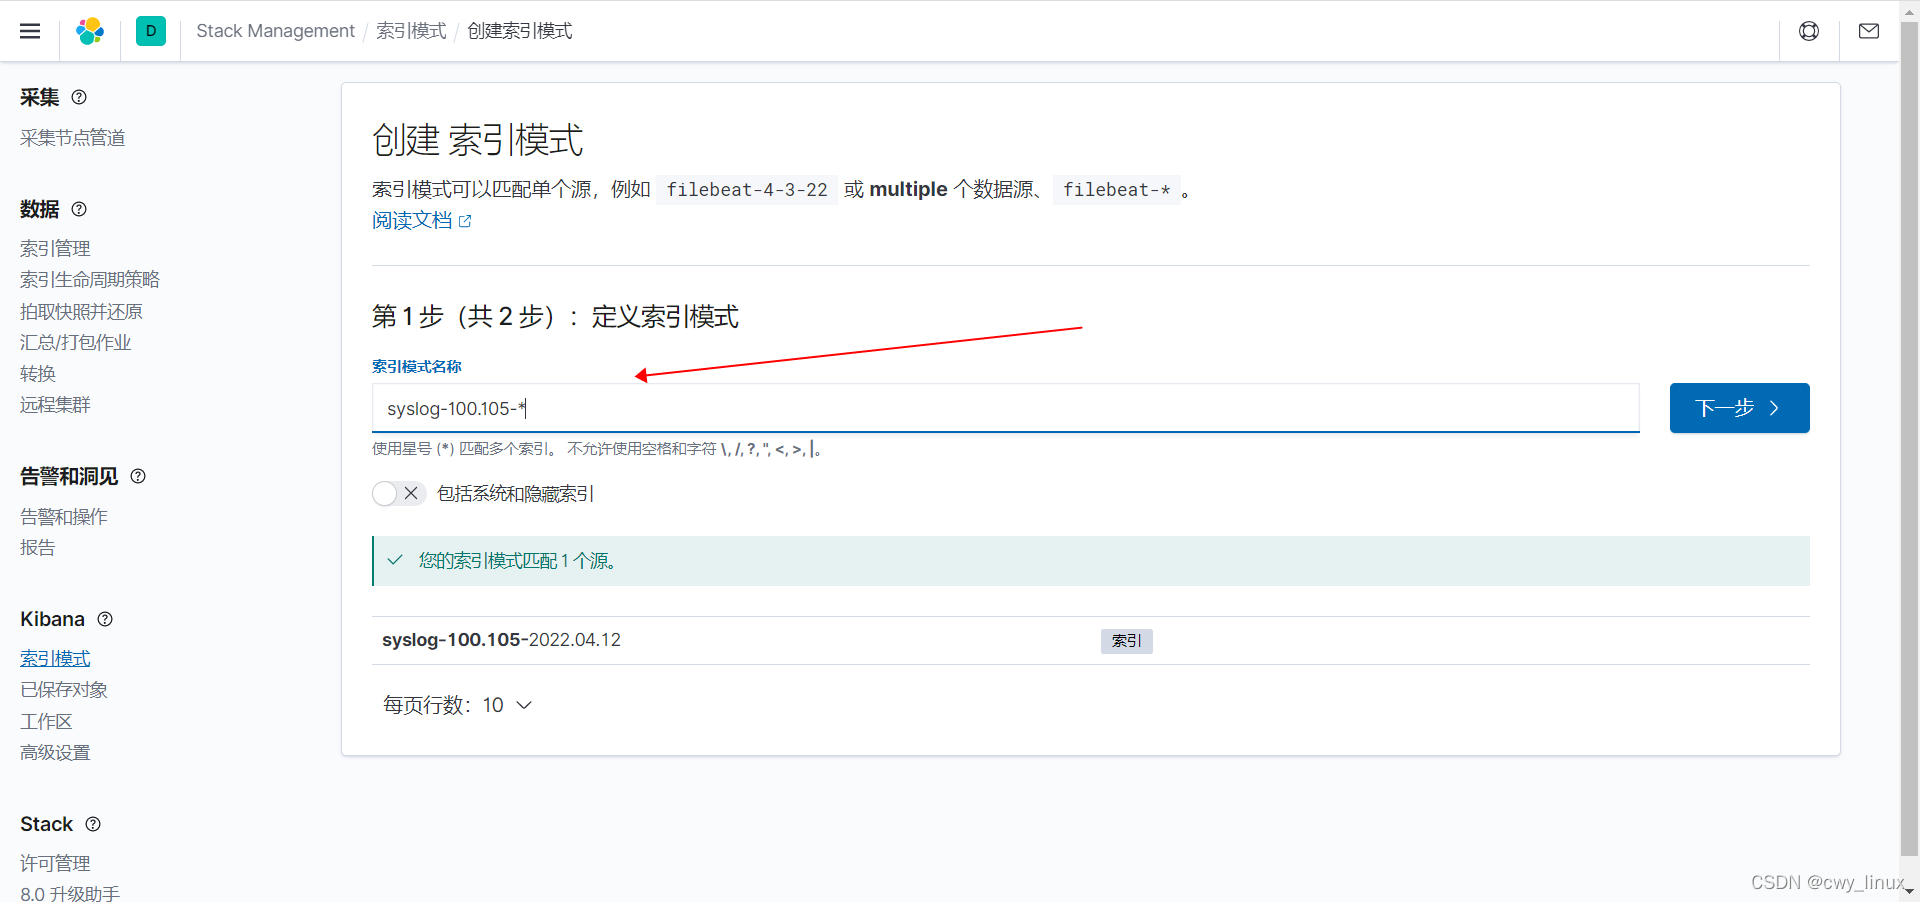
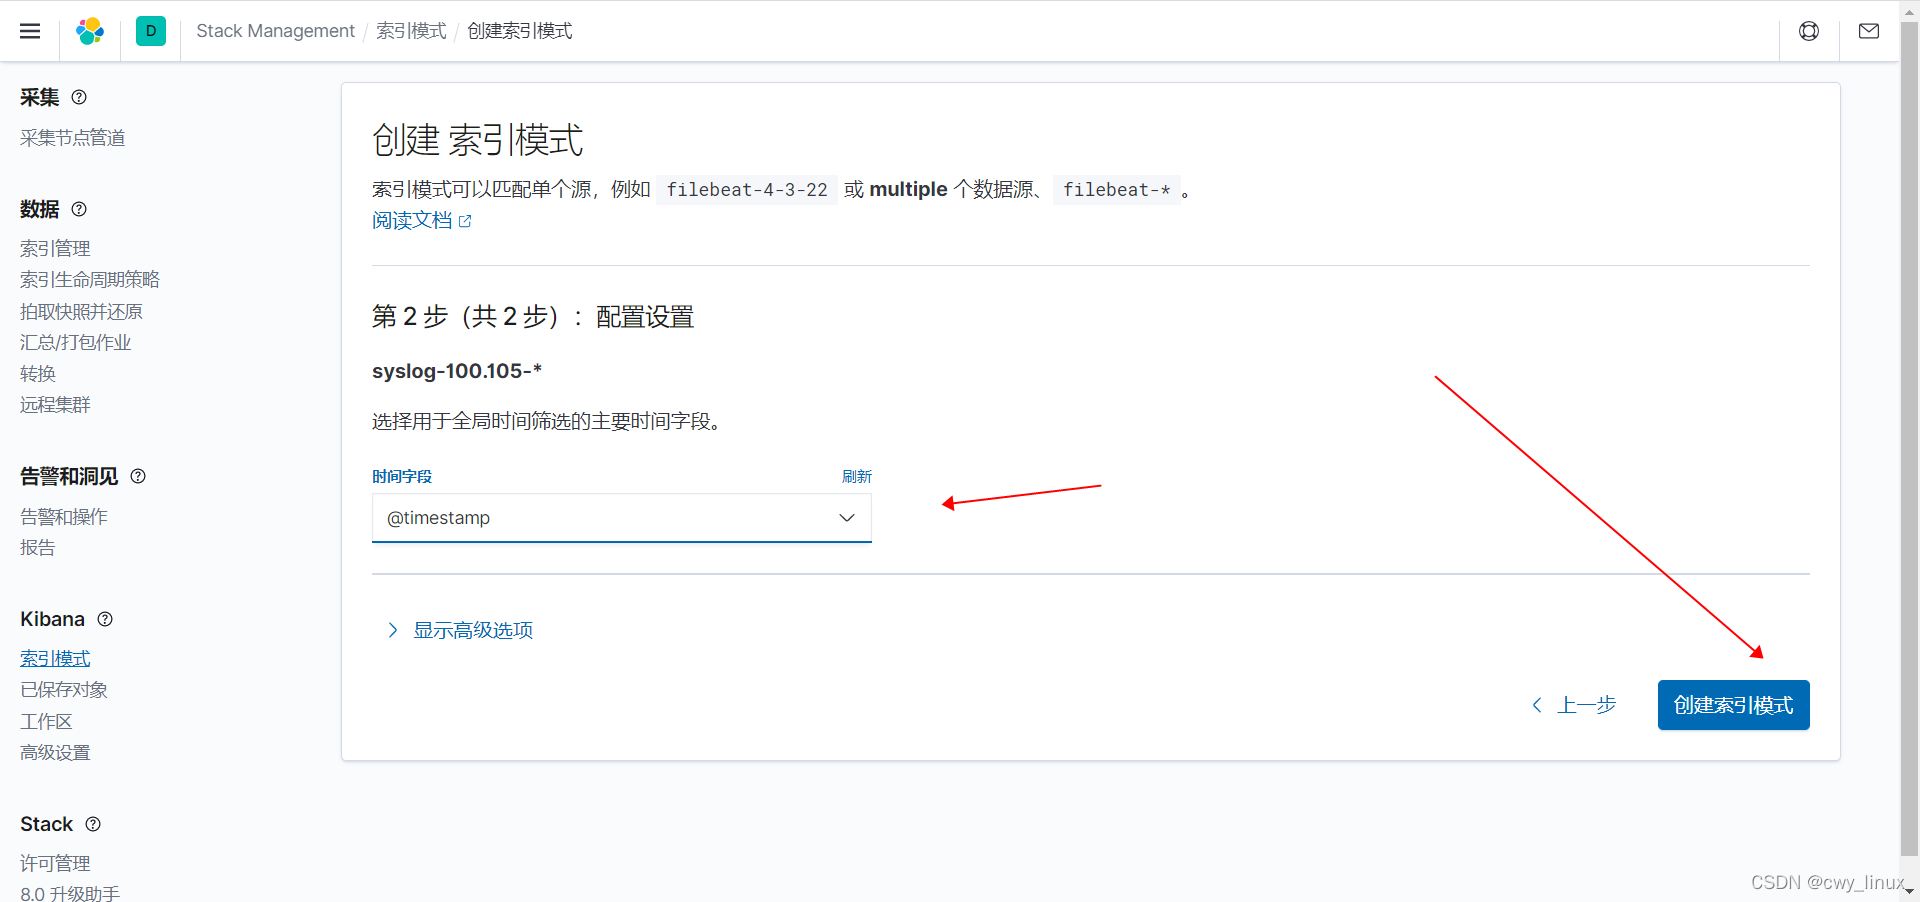
1.4.1 创建索引模式
Stack Management >> 索引模式 >> 创建索引模式
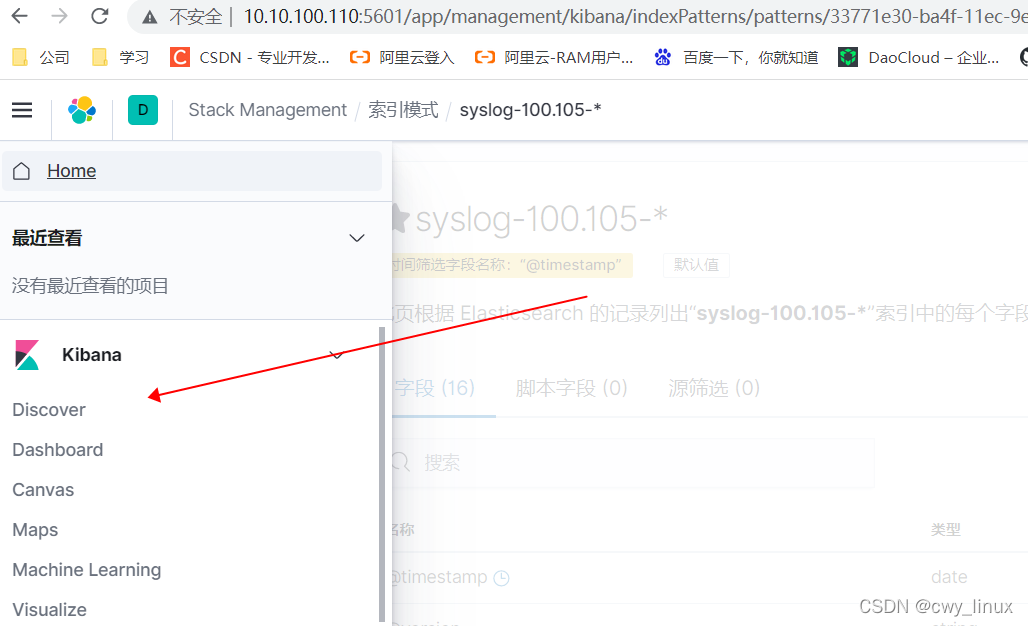
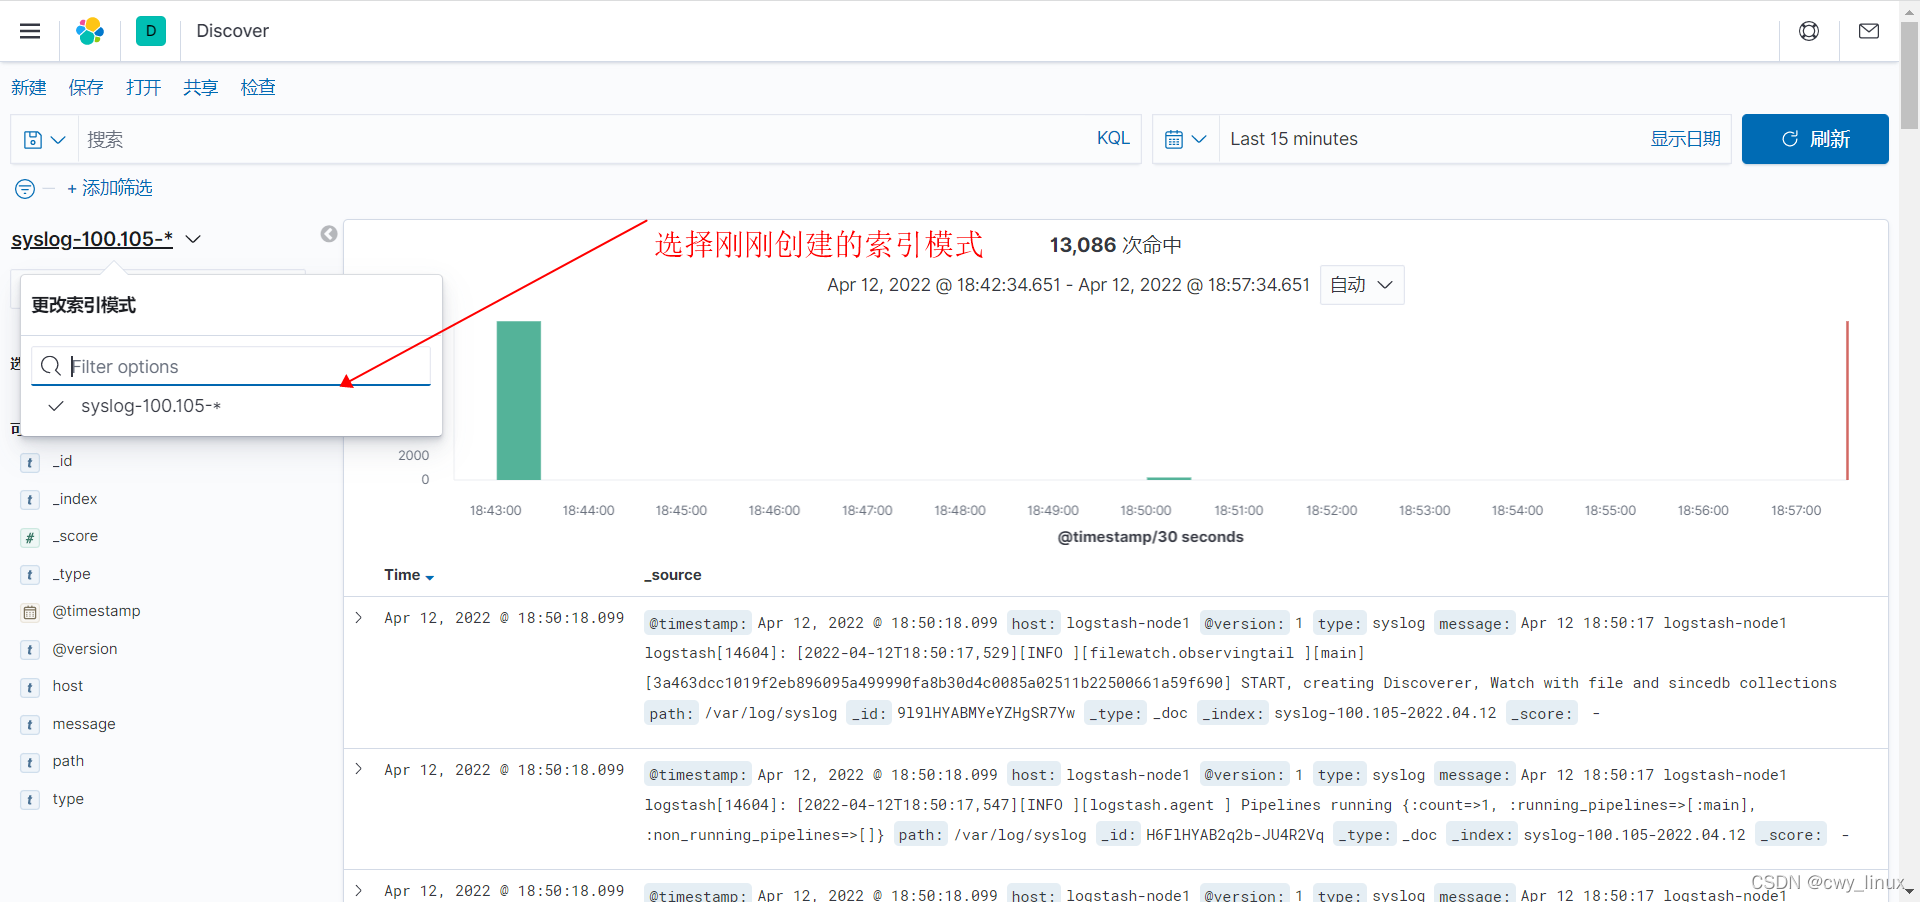
1.4.2 查看日志
Discover
2、tomcat日志收集
2.1 tomcat 日志转 json
root@logstash-node1:/apps/tomcat# vim conf/server.xml
<Valve className="org.apache.catalina.valves.AccessLogValve" directory="logs"
prefix="localhost_access_log" suffix=".log"
pattern="{"clientip":"%h","ClientUser":"%l","authenticated":"%u","AccessTime":"%t","method":"%r","status":"%s","SendBytes":"%b","Query?string":"%q","partner":"%{Referer}i","AgentVersion":"%{User-Agent}i"}"/>
#验证查看日志
root@logstash-node1:/apps/tomcat# tail -f logs/localhost_access_log.2022-04-13.log
{"clientip":"10.10.100.1","ClientUser":"-","authenticated":"-","AccessTime":"[13/Apr/2022:11:32:18 +0800]","method":"GET / HTTP/1.1","status":"200","SendBytes":"14","Query?string":"","partner":"-","AgentVersion":"Mozilla/5.0 (Windows NT 10.0; Win64; x64) AppleWebKit/537.36 (KHTML, like Gecko) Chrome/100.0.4896.75 Safari/537.36"}
{"clientip":"10.10.100.1","ClientUser":"-","authenticated":"-","AccessTime":"[13/Apr/2022:11:32:18 +0800]","method":"GET /favicon.ico HTTP/1.1","status":"200","SendBytes":"21630","Query?string":"","partner":"http://10.10.100.115:8080/","AgentVersion":"Mozilla/5.0 (Windows NT 10.0; Win64; x64) AppleWebKit/537.36 (KHTML, like Gecko) Chrome/100.0.4896.75 Safari/537.36"}
2.2 配置logstash
root@logstash-node1:~# vim /etc/logstash/conf.d/tomcat_access_log.conf

input {
    file {
    path => "/apps/tomcat/logs/localhost_access_log.2022-04-13.log"
    start_position => "beginning"
    stat_interval =>"3"
    type=>"tomcat_access_log"
    codec => "json"
  }
}
output {
  if [type] == "tomcat_access_log" {
     elasticsearch {
      hosts => ["10.10.100.120:9200"]
      index => "tomcat-accesslog-100.105-%{+YYYY.MM.dd}"
    }
  }
}

#添加日志文件权限
root@logstash-node1:~# chmod o+r /apps/tomcat/logs/localhost_access_log.2022-04-13.log

#重启logstash
root@logstash-node1:~# systemctl restart logstash
2.3 验证查看
查看索引
root@es-node1:~# curl '10.10.100.120:9200/_cat/indices?v'
health status index                               uuid                   pri rep docs.count docs.deleted store.size pri.store.size
green  open   tomcat-accesslog-100.105-2022.04.13 nXmwge_JQo6oTDx5BZK_3g   1   1         23            0    124.9kb         73.3kb
green  open   syslog-100.105-2022.04.13           8sm8Asb1RSyZZQvVSvsjhw   1   1         42            0     90.8kb         57.9kb
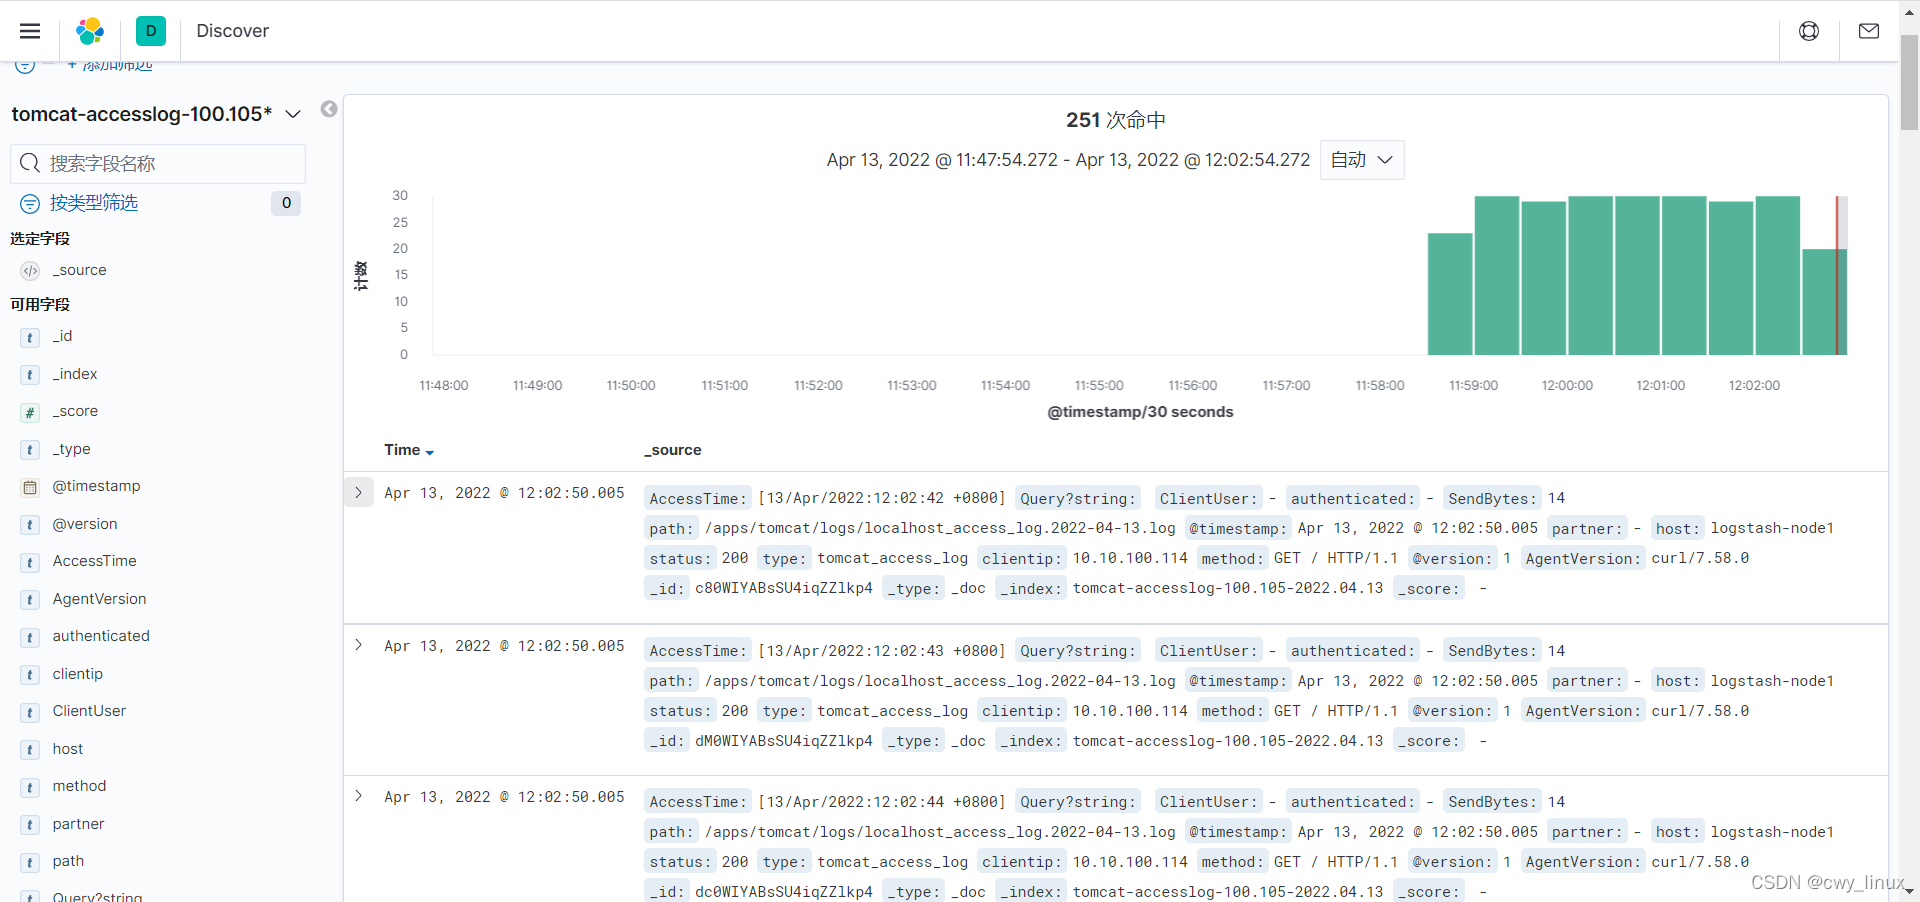
kibana查看日志
3、nginx日志收集
3.1 配置nginx json格式日志
root@logstash-node1:/apps/nginx# vim conf/nginx.conf
    log_format access_json '{"@timestamp":"$time_iso8601",'
         '"host":"$server_addr",'
         '"clientip":"$remote_addr",'
         '"size":$body_bytes_sent,'
         '"responsetime":$request_time,'
         '"upstreamtime":"$upstream_response_time",'
         '"upstreamhost":"$upstream_addr",'
         '"http_host":"$host",'
         '"url":"$uri",'
         '"domain":"$host",'
         '"xff":"$http_x_forwarded_for",'
         '"referer":"$http_referer",'
         '"status":"$status"}';
     access_log /apps/nginx/logs/access.log access_json;
#添加权限
root@logstash-node1:/apps/nginx# chmod o+r /apps/nginx/logs/access.log
3.2 配置logstash
root@logstash-node1:~# vim /etc/logstash/conf.d/nginx-access.log

input {
  file {
    path => "/apps/nginx/logs/access.log"
    start_position => "beginning"
    stat_interval => "3"
    type => "nginx-access-log"
    codec => json
  }
}
output {
  if [type] == "nginx-access-log" {
     elasticsearch {
       hosts => ["10.10.100.120:9200"]
       index => "nginx-accesslog-100.105-%{+YYYY.MM.dd}"
    }
  }
}

#重启logstash
root@logstash-node1:~# systemctl restart logstash
3.3 验证查看
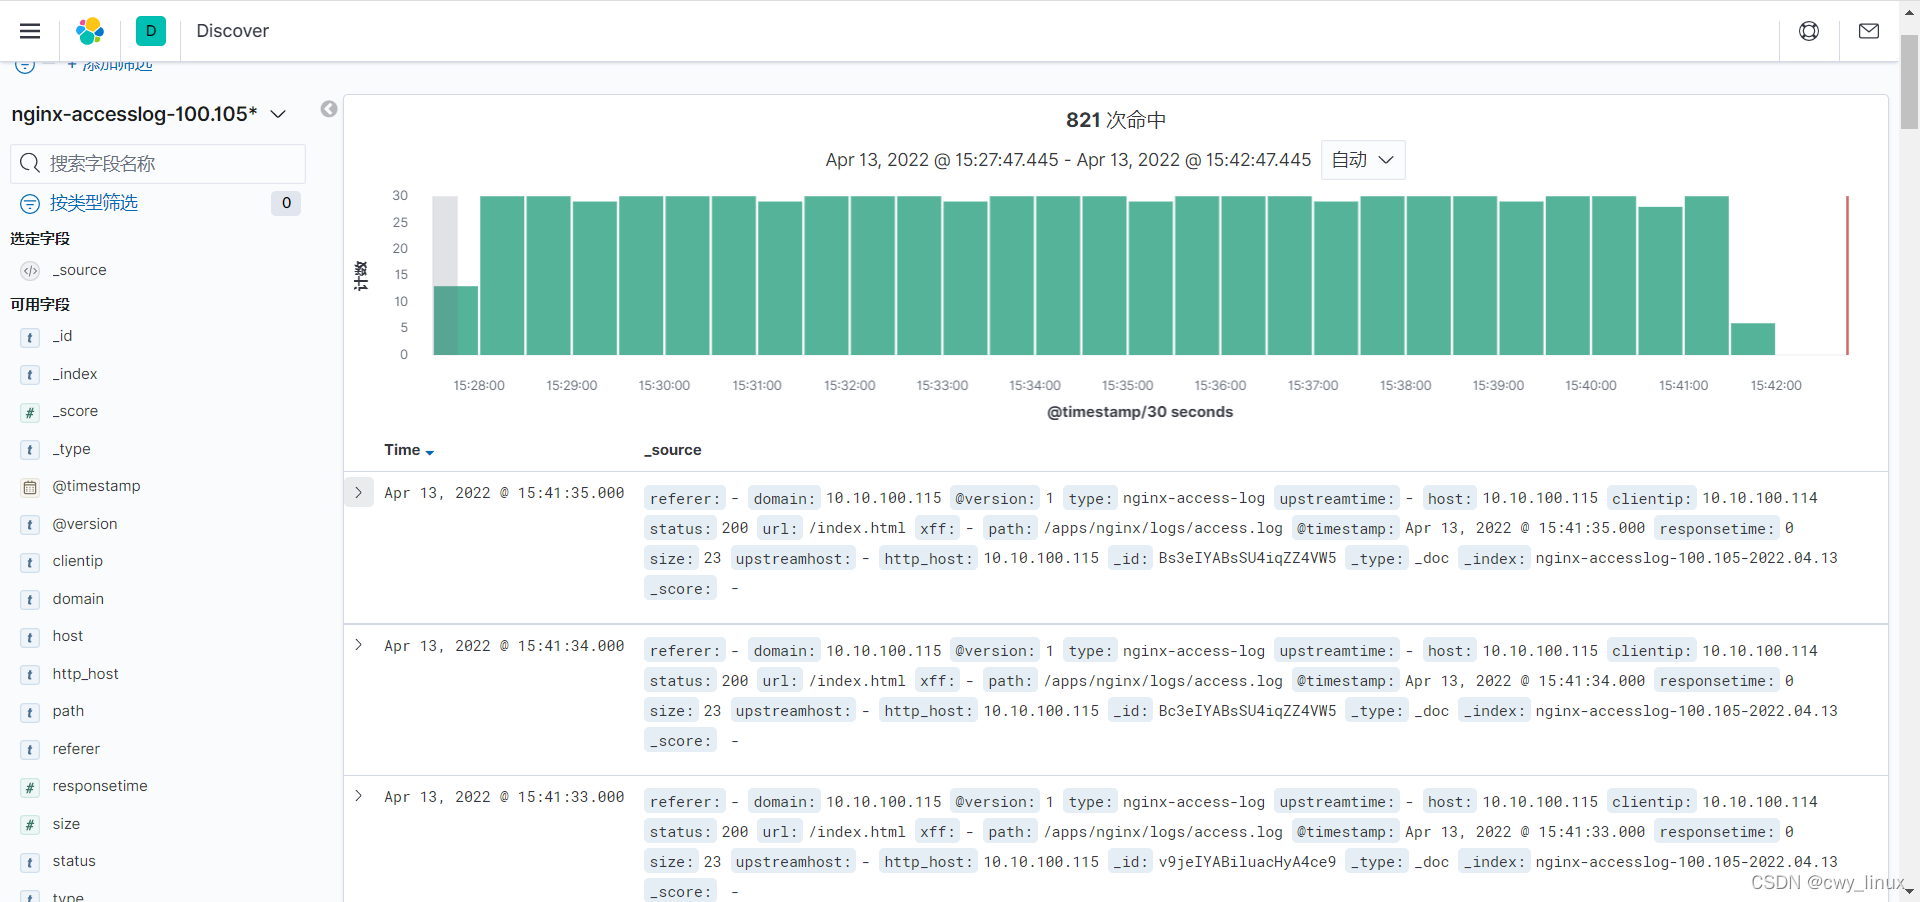
4、java 日志搜集
使用 codec 的 multiline 插件实现多行匹配,这是一个可以将多行进行合并的插件,而且可以使用 what 指定将匹配到的行与前面的行合并还是和后面的行合并,
https://www.elastic.co/guide/en/logstash/current/plugins-codecs-multiline.html
4.1 配置logstash
root@logstash-node1:~# vim /etc/logstash/conf.d/java_log.conf
input {
  file {
    path = "/tmp/java.log"
    type = "java-log"
    start_position => "beginning"
    stat_interval => "3"
      codec => multiline {
        #匹配年月日开头行时进行多行合并
        pattern => "^([0-9]{4}-[0-9]{2}-[0-9]{2}"
        #true 为匹配成功进行操作,false 为不成功进行操作
        negate => true
        #与之前的行合并,如果是下面的行合并就是 next
        what =>"previous"
  }
  }
}
output {
   if [type] == "syslog" {
    elasticsearch {
      hosts => ["10.10.100.120:9200"]
      index => "javalog-100.105-%{+YYYY.MM.dd}"
    }
  }
}
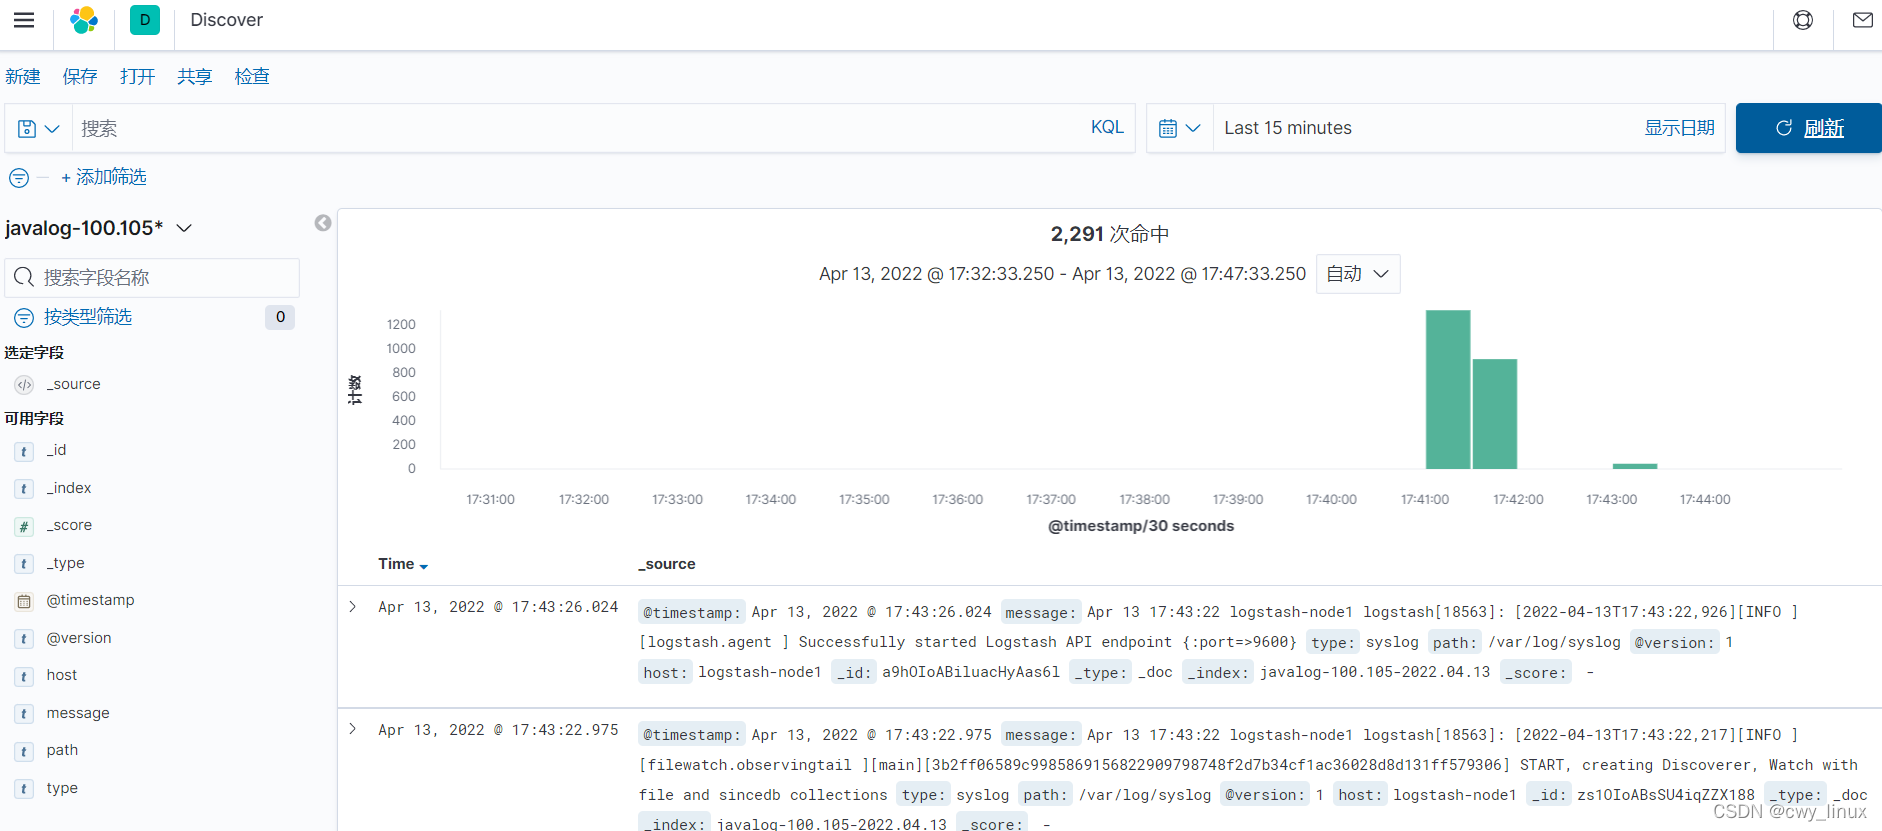
4.2 kibana 查看日志

为开发者提供学习成长、分享交流、生态实践、资源工具等服务,帮助开发者快速成长。
更多推荐


 0
0 0
0- 0


 已为社区贡献3条内容

所有评论(0)