apisix+apisix dashboard+grafana+prometheus搭配和使用在centos7
1. OpenResty 的官方 RPM 仓库sudo yum install -y https://repos.apiseven.com/packages/centos/apache-apisix-repo-1.0-1.noarch.rpm2.RPM 仓库和 Apache APISIXsudo yum-config-manager --add-repo https://repos.apiseve
1. OpenResty 的官方 RPM 仓库
sudo yum install -y https://repos.apiseven.com/packages/centos/apache-apisix-repo-1.0-1.noarch.rpm
2.RPM 仓库和 Apache APISIX
    sudo yum-config-manager --add-repo https://repos.apiseven.com/packages/centos/apache-apisix.repo
    sudo yum info -y apisix
    sudo yum --showduplicates list apisix
    sudo yum install apisix
3.安装相关依赖
# 安装 etcd
   wget https://github.com/etcd-io/etcd/releases/download/v3.4.13/etcd-v3.4.13-linux-amd64.tar.gz
   tar -xvf etcd-v3.4.13-linux-amd64.tar.gz
   cd etcd-v3.4.13-linux-amd64
   sudo cp -a etcd etcdctl /usr/bin/
# 添加 OpenResty 源
   sudo yum install yum-utils
   sudo yum-config-manager --add-repo  https://openresty.org/package/centos/openresty.repo
# 安装 OpenResty 和 编译工具
  sudo yum install -y openresty curl git gcc openresty-openssl111-devel unzip pcre pcre-devel
# 安装 LuaRocks
  curl https://raw.githubusercontent.com/apache/apisix/master/utils/linux-install-luarocks.sh -sL | bash -
# 开启 etcd server
  nohup etcd &
4.apisxi服务启动
运行以下命令初始化 NGINX 配置文件和 etcd
apisix init
测试配置文件
apisix test
启动 |停止Apache APISIX
apisix start|apisix quit( 启动apisix必须保证etcd服务启动)
5. 安装apisix-dashboard
1.需要先安装相关依赖
安装go(版本需要大于1.13)
yum install Golang
需要给go换个国内的源,方便后续go下载相关依赖
go env -w GOPROXY=https://goproxy.cn,direct
安装yarn(版本需要大于14)
curl --silent --location https://dl.yarnpkg.com/rpm/yarn.repo | sudo tee /etc/yum.repos.d/yarn.repo
yum install yarn
安装node(版本需要大于11以上)
yum install nodejs
2. 安装apisix-dashboard(2.12版本适配apisix-dashboard版本2.11)
sudo git clone https://github.com/apache/apisix-dashboard.git
cd apisix-dashboard
sudo git checkout  release/2.11
sudo make build
创建服务单元
mkdir -p /usr/local/apisix-dashboard
cd apisix-dashboard/
cp -rf ./output/* /usr/local/apisix-dashboard
cd apisix-dashboard/api/service
cp apisix-dashboard.service /usr/lib/systemd/system/apisix-dashboard.service
cd /usr/lib/systemd/system
systemctl daemon-reload
启动 |停止|查看apisix-dashboard状态命令
systemctl start|stop|staus apisix-dashboard
6.需要修改的相关配置
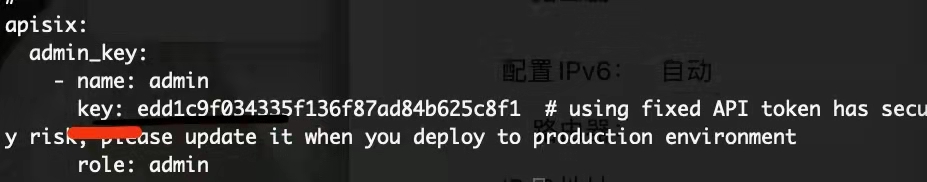
- 建议修改apisix密钥
sudo vim apisix/conf/config.yaml( 中key的值,自己随机修改,用于鉴权)。
2.修改登录的账号

3.目前apisix只监听9080和9443两端口。
sudo vim apisix/conf/config-default.yaml
apisix:
  # node_listen: 9080               # APISIX listening port
  node_listen: (添加需要监听的端口)                     # This style support multiple ports
    - 9080
    - 80
  #   - port: 9081
  #     enable_http2: true          # If not set, the default value is `false`.
  #   - ip: 127.0.0.2               # Specific IP, If not set, the default value is `0.0.0.0`.
  #     port: 9082
  #     enable_http2: true
7. 仪表盘配置
- 需要下载安装prometheus
wget https://github.com/prometheus/prometheus/releases/download/v2.34.0/prometheus-2.34.0.linux-amd64.tar.gz
tar xvfz prometheus-2.34.0.linux-amd64.tar.gz
cd prometheus-2.34.0.linux-amd64
./prometheus --config.file=prometheus.yml --web.listen-address=:9093 &
(启动命令默认是9090端口,但是由于端口被占用所以指定9093端口)
(查看端口是否被占用netstat -lnp|grep 9093)
安装成功后访问 http://ip:9093( 必须勾选use local time,因为promethus用的不是东八区,需要和granfana时间同步)
成功
- 下载安装grafana
wget    https://dl.grafana.com/enterprise/release/grafana-enterprise-8.4.4-1.x86_64.rpm
sudo yum install grafana-enterprise-8.4.4-1.x86_64.rpm
sudo systemctl daemon-reload
启动|查看服务状态服务
sudo systemctl start grafana-server
sudo systemctl status grafana-server
参考文档连接:
https://grafana.com/grafana/download
输入http://ip+3000进入grafana页面账号密码默认是admin/admin
3. 获取apisix提供的prometheus 数据格式的监控指标数据
1.开启apisix中prometheus插件
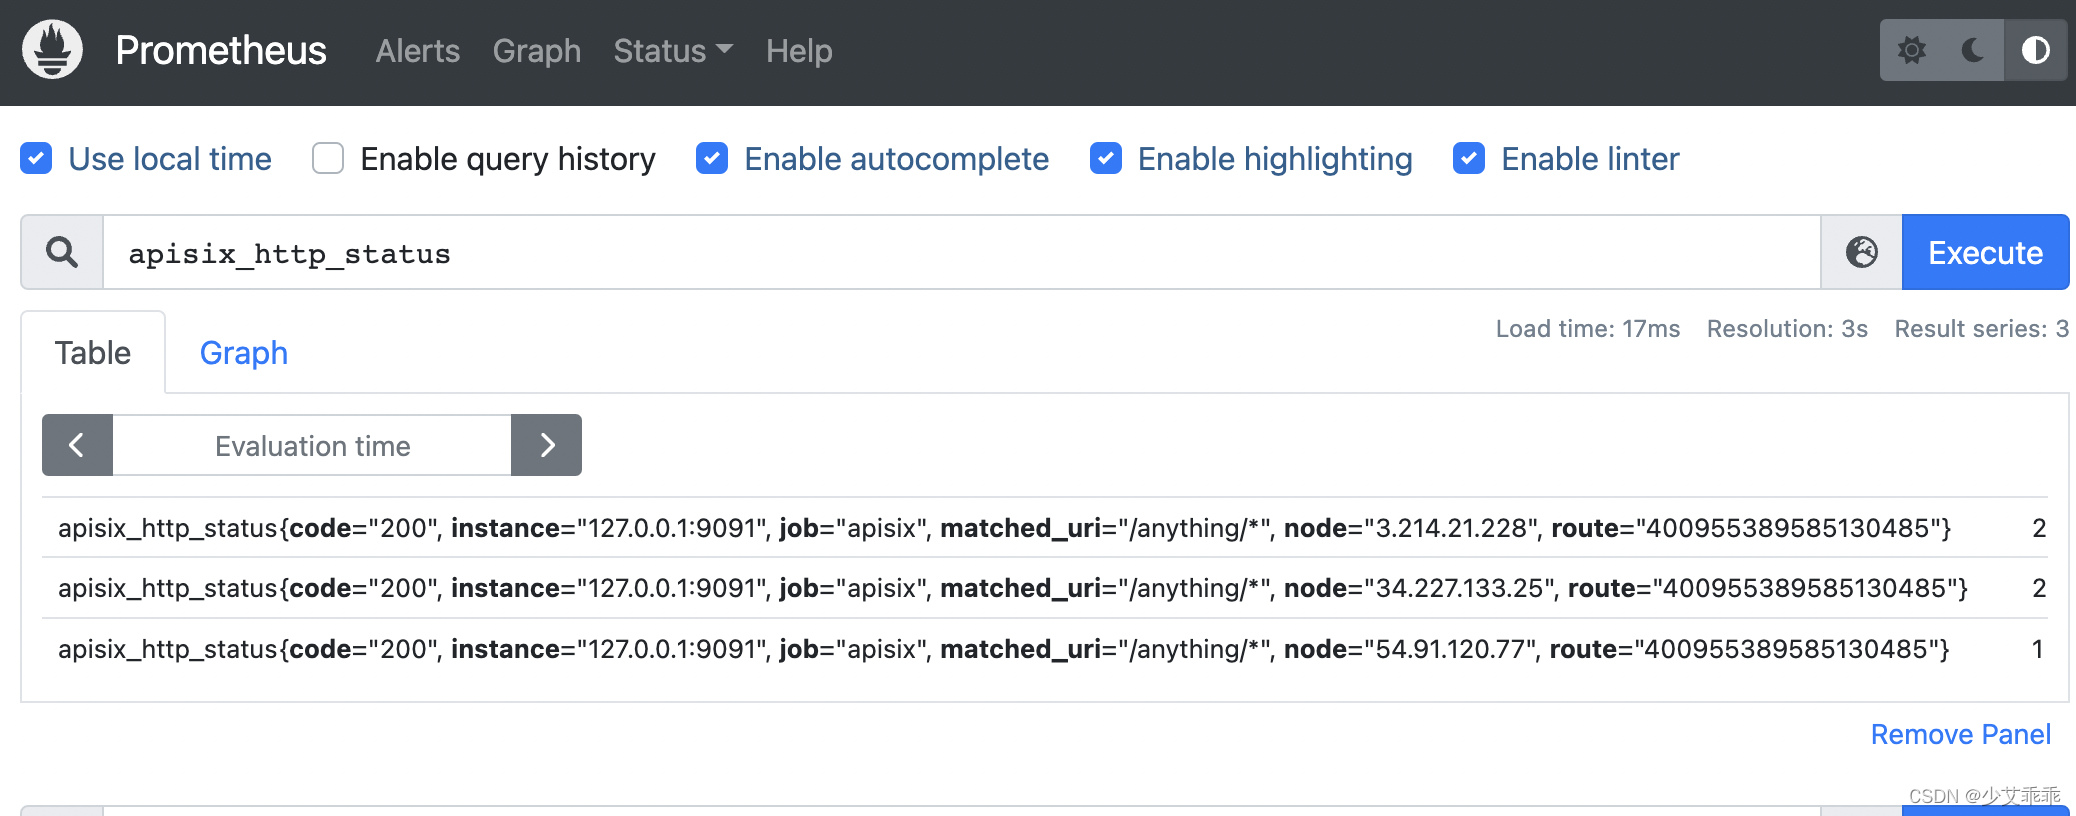
2.查看是否有数据
curl -i http://127.0.0.1:9091/apisix/prometheus/metrics(有输出就有数据)
3. 修改prometheus配置如图


4.granfana 配置prometheus数据
图4-1
图4-2

图4-3
 图4-4
图4-4

下载Grafana 中apisix 控制面板josn配置文件
https://grafana.com/grafana/dashboards/11719/revisions
图4-5

图4-6

图4-7

图4-8

点击Apache APISIX
图4-9

注意:如果在这一步页面展示不出来任何数据。
1. 检查prometheus时区是否与granfana一致。
2. 检查每个模块是否有对应的metrics browser配置(具体可以参考文档apisix prometheus插件
例如:

打开apisix dashboard
图4-10

配置成功后显示
图4-11


为开发者提供学习成长、分享交流、生态实践、资源工具等服务,帮助开发者快速成长。
更多推荐


 2
2 0
0- 0


 已为社区贡献1条内容

所有评论(0)